

The Cardano (ADA) price has been increasing rapidly since it reached a low on Sept 23. However, the price has yet to clear a significant resistance level and has not confirmed the upward trend.
Current Movement
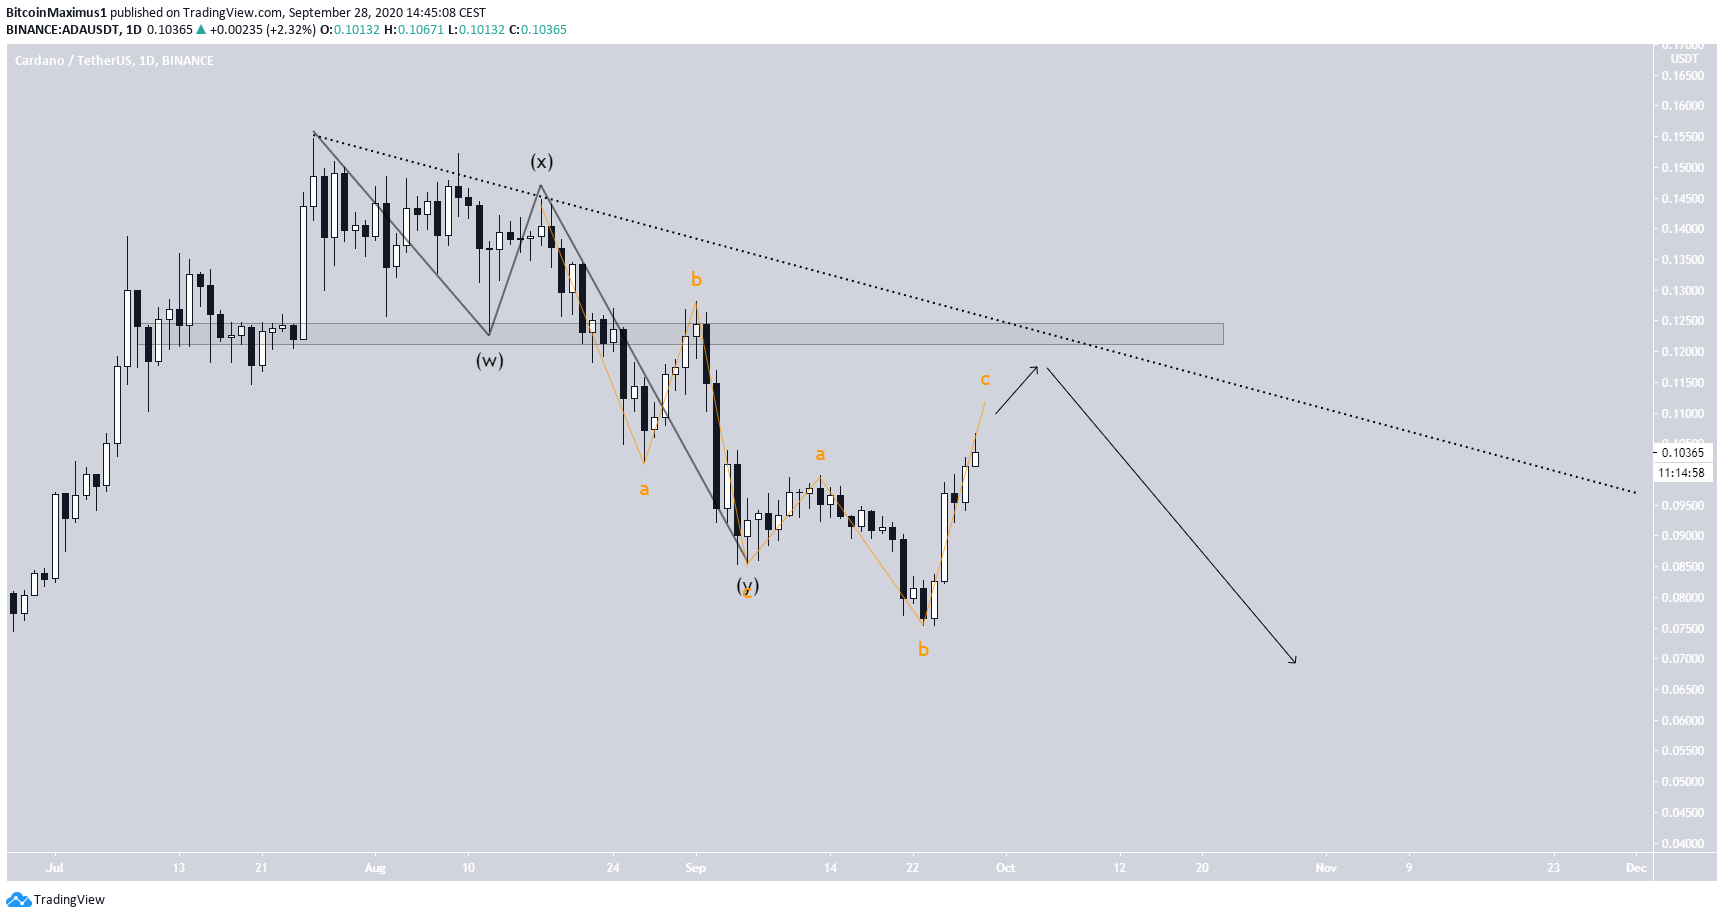
The ADA price has been falling since July 24, when it reached a top of $0.154. The decline continued without much relief until a low of $0.075 was reached on Sept 23. Since then, the price has begun a rapid upward move. At the time of writing, ADA was trading inside a minor resistance area found between $0.102 – $0.108, the 0.5 – 0.618 Fib levels of the previous decline. In a broader range, ADA is trading between support and resistance at $0.075 and $0.125, respectively.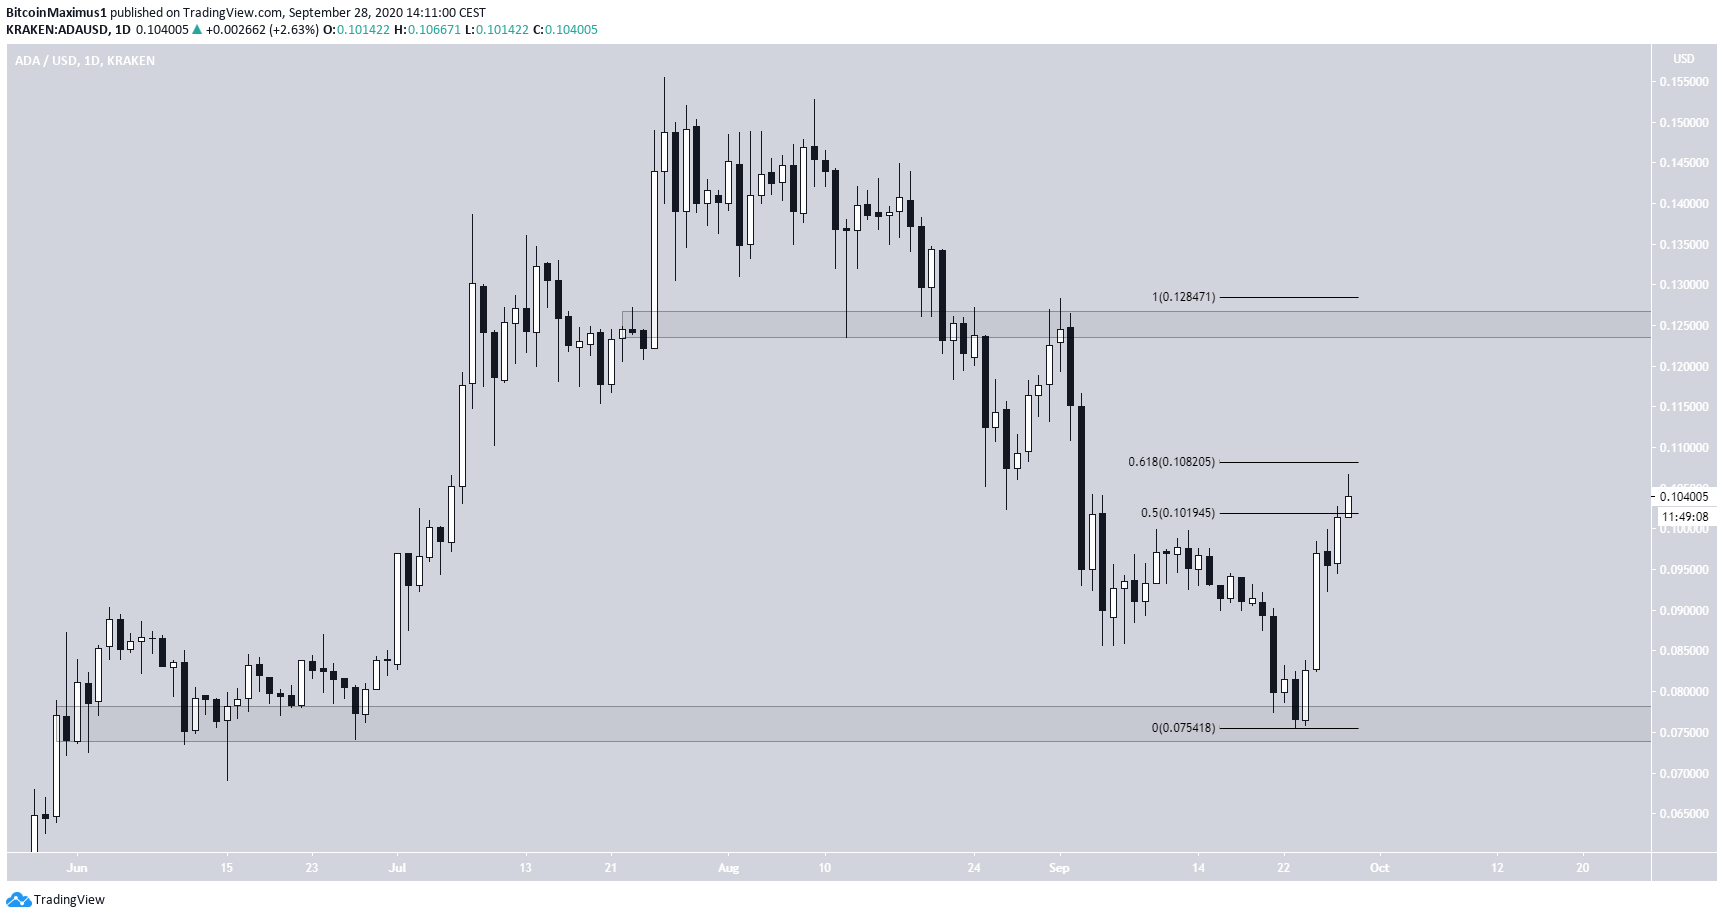
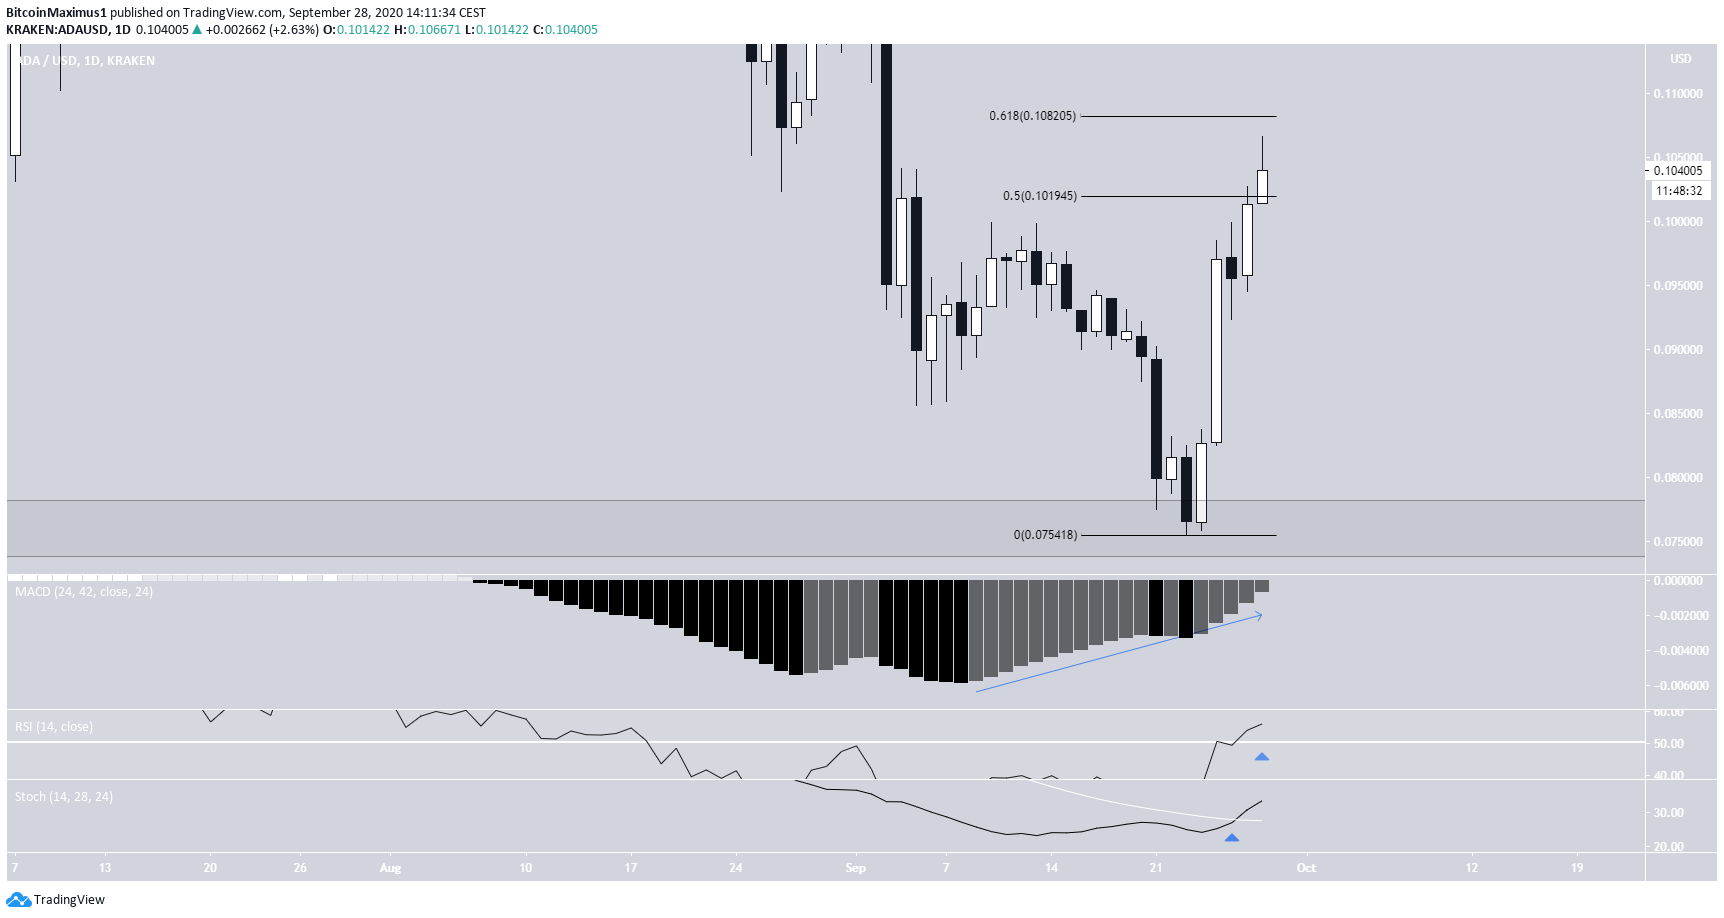
- The MACD has generated bullish divergence and is increasing.
- The RSI has moved above 50
- The Stochastic Oscillator has made a bullish cross and is also moving upwards.
Short-Term
Cryptocurrency trader @crypto618 outlined an ADA chart, which shows that the price has just reached the resistance line of a descending channel. They predict a price fall.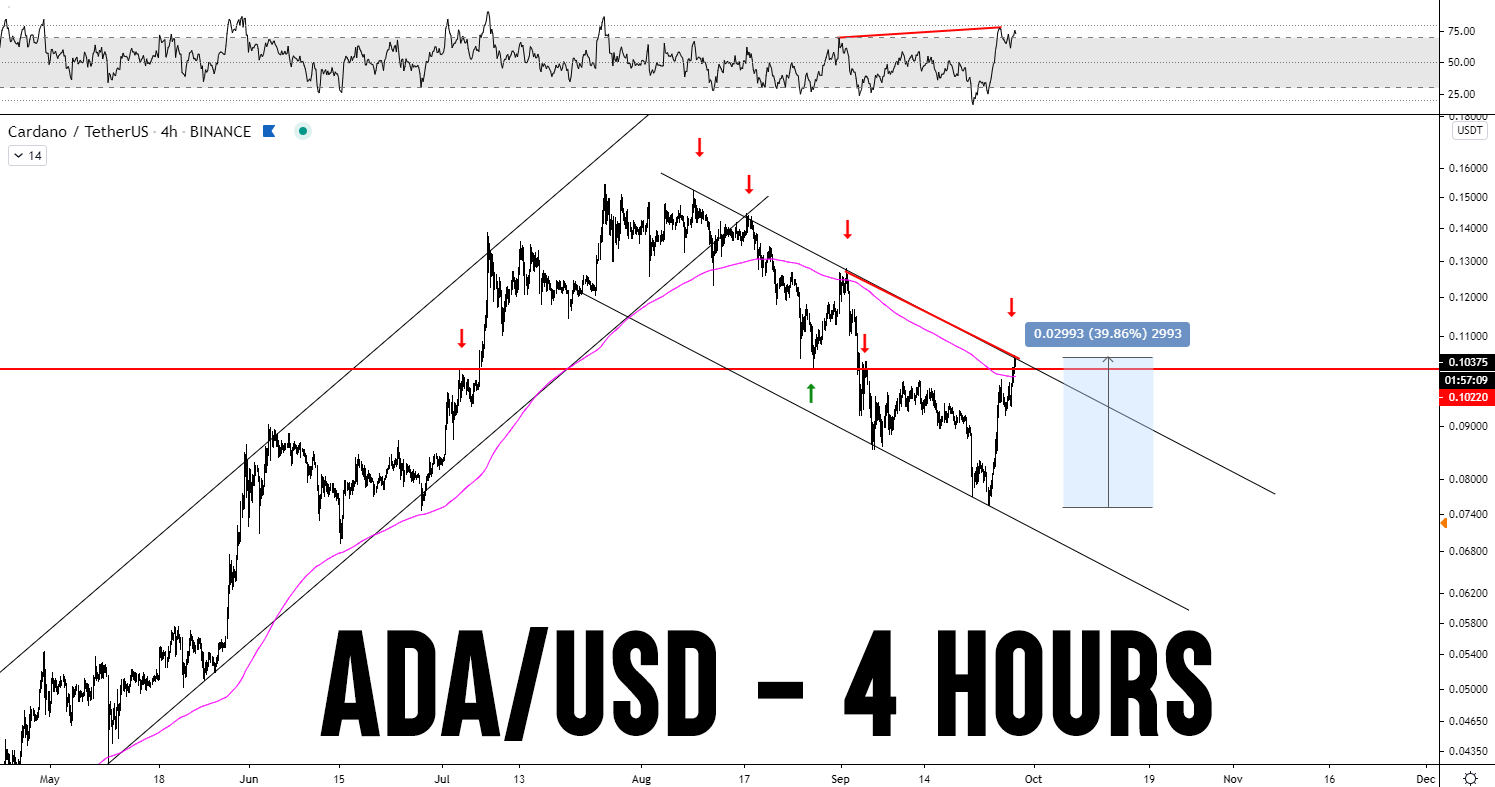
Wave Count
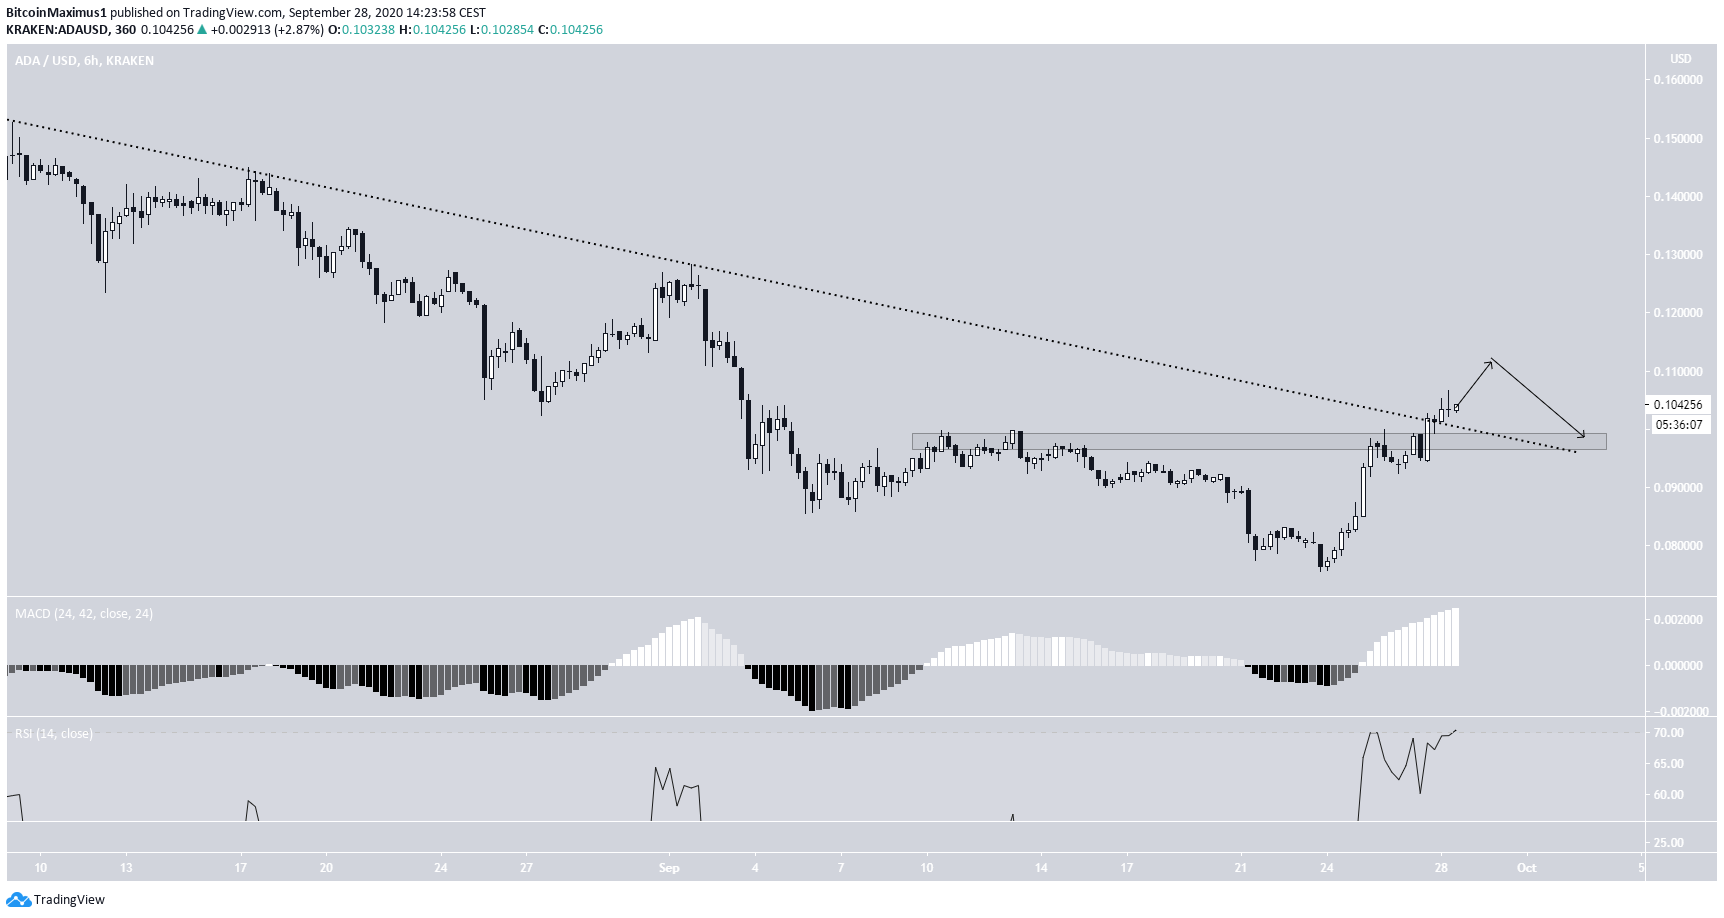
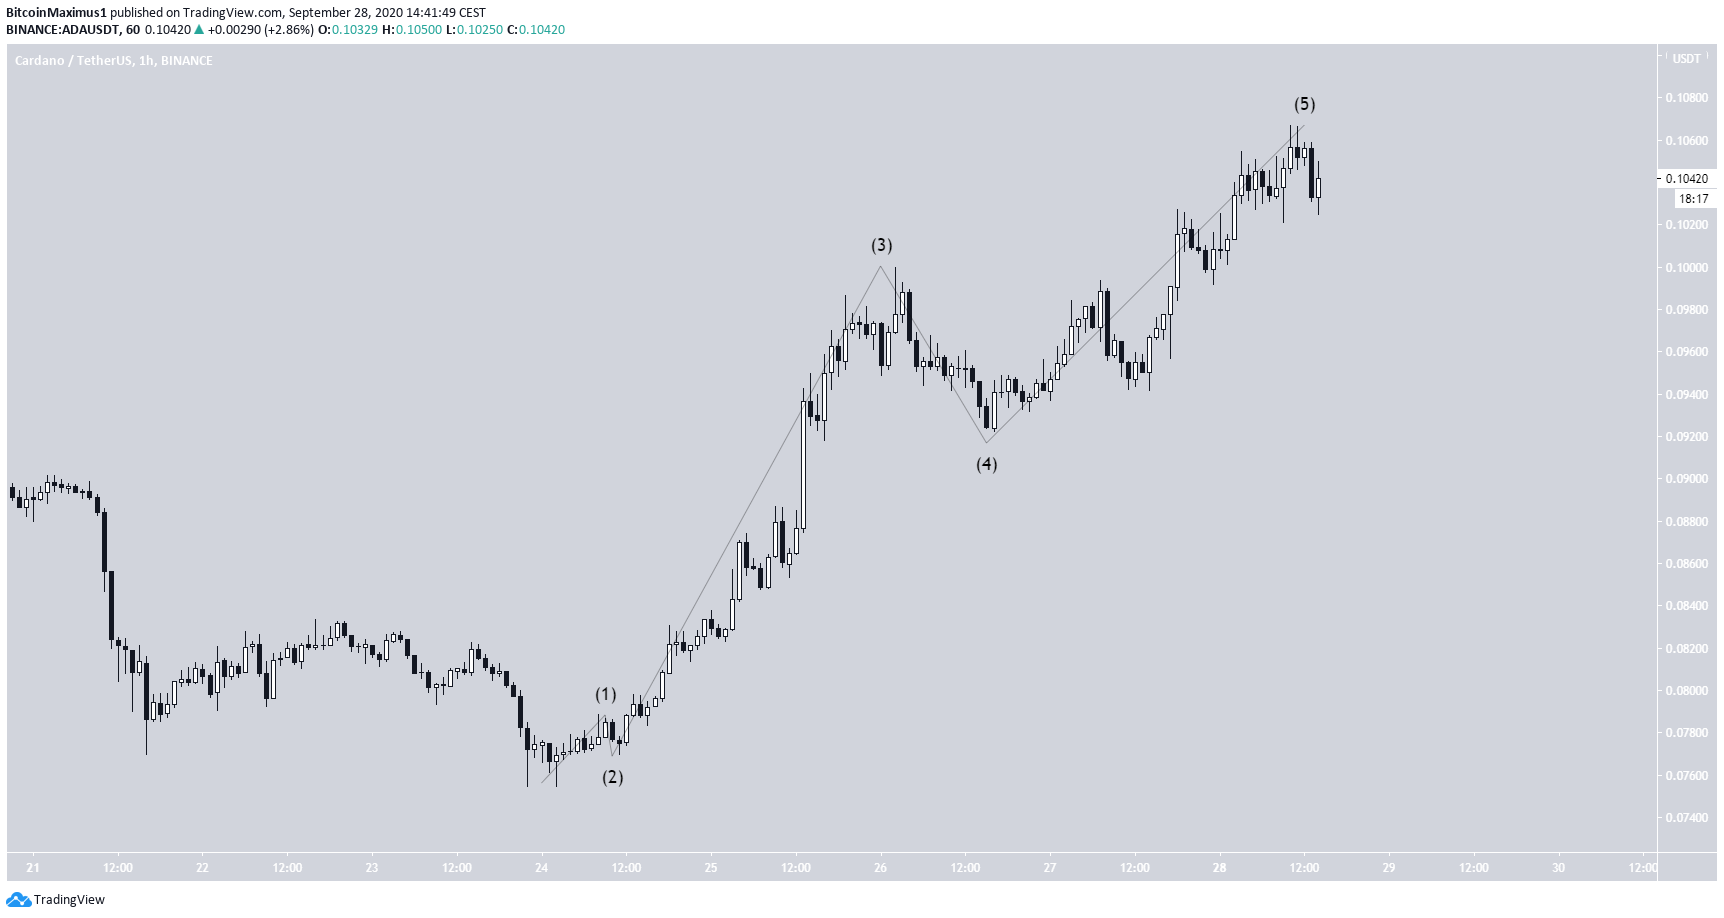
In BeInCrypto’s previous analysis, it was stated that,the decrease could end at $0.078 if sub-waves A to C have a 1:1 ratio, which is quite common.The price reached a low of $0.074 and began the current upward movement. The move from the lows looks impulsive, so this may be the beginning of a new upward trend.
Disclaimer
In line with the Trust Project guidelines, this price analysis article is for informational purposes only and should not be considered financial or investment advice. BeInCrypto is committed to accurate, unbiased reporting, but market conditions are subject to change without notice. Always conduct your own research and consult with a professional before making any financial decisions. Please note that our Terms and Conditions, Privacy Policy, and Disclaimers have been updated.

Valdrin Tahiri
Valdrin discovered cryptocurrencies while he was getting his MSc in Financial Markets from the Barcelona School of Economics. Shortly after graduating, he began writing for several different cryptocurrency related websites as a freelancer before eventually taking on the role of BeInCrypto's Senior Analyst.
(I do not have a discord and will not contact you first there. Beware of scammers)
READ FULL BIO
Sponsored
Sponsored