
Polkadot (DOT) has been moving upwards, since bouncing at the $28.30 support area on April 23.
DOT is expected to continue moving upwards and eventually reach a new all-time high price.
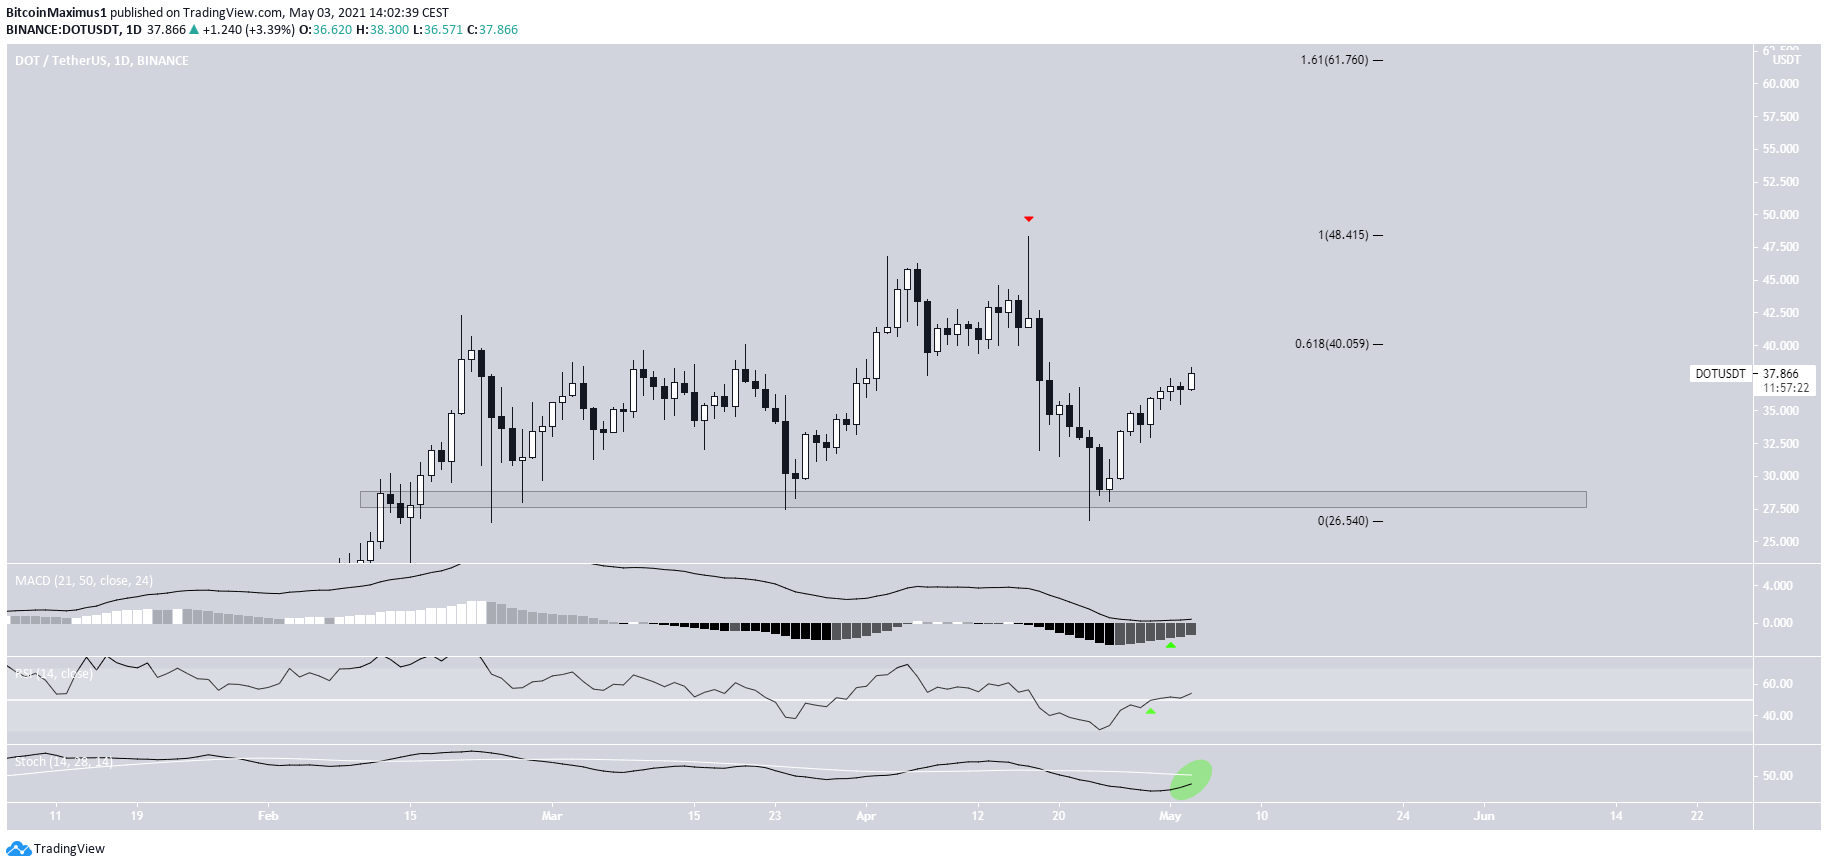
Daily DOT Movement
DOT has been moving downwards since April 1, when it had reached an all-time high price of $48.36. The same day, it created a shooting star candlestick and dropped.
The downward movement continued, until DOT bounced at the $28.30 support area on April 23. It has been moving upwards since.
Currently, it is trading right at the $40 resistance area, which is created by the 0.618 Fib retracement resistance level. The next resistances are found at $48.40 and $61.70, respectively.
Technical indicators are bullish, supporting the continuation of the upward movement. The MACD has given a bullish reversal signal. Both the RSI & Stochastic oscillator are increasing, the former having just crossed above 50.
Therefore, the token is expected to successfully break out from the $40 resistance area and move towards a new all-time high.
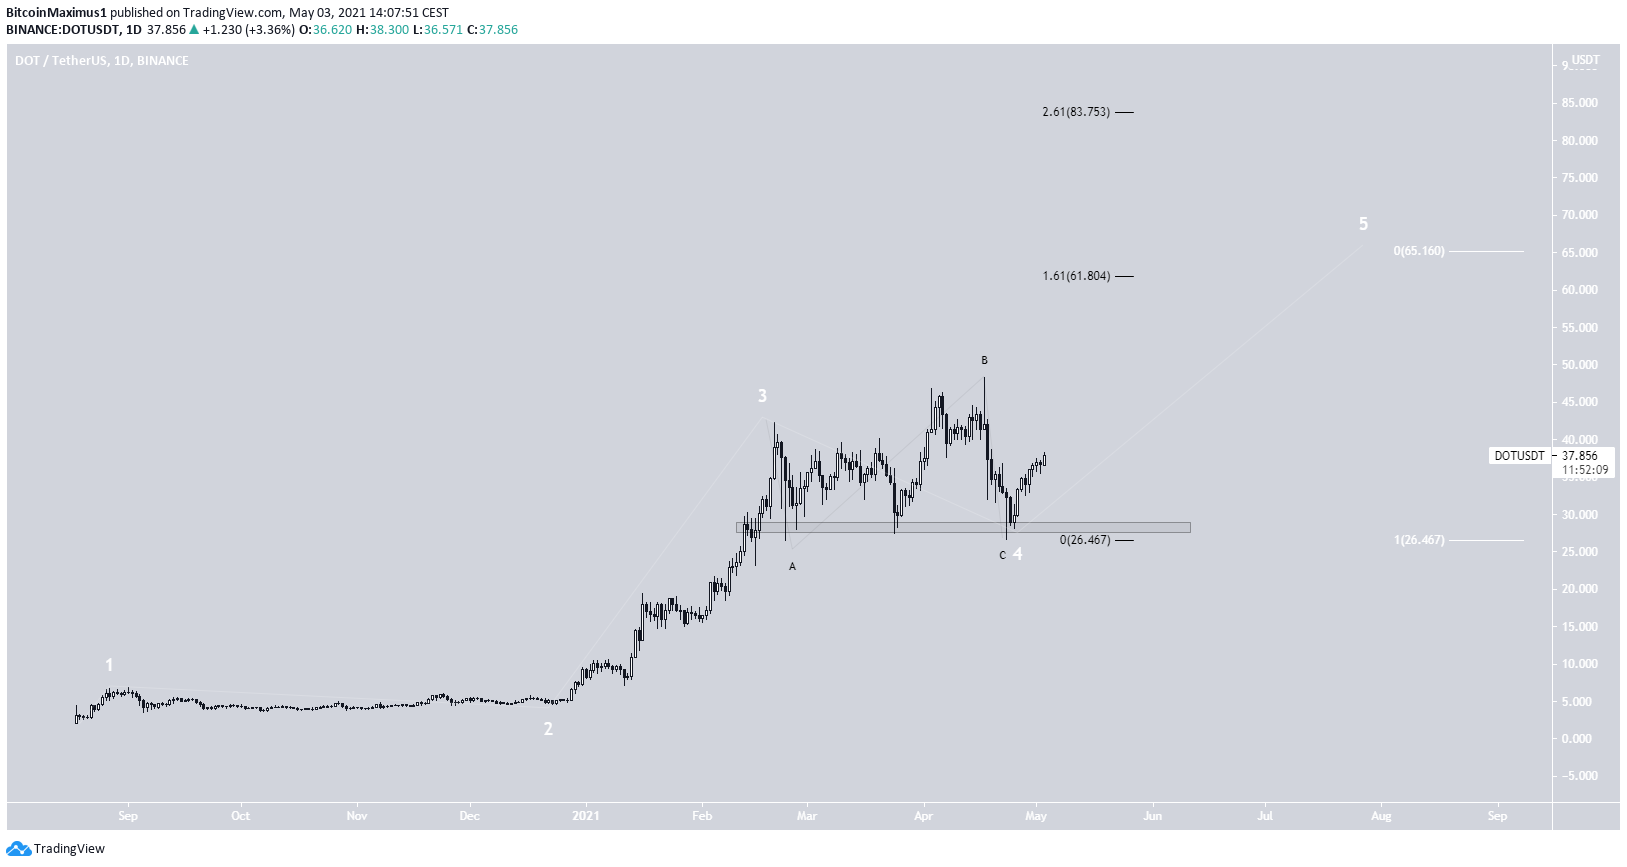
Wave Count For DOT
Cryptocurrency trader @Altstreetbets outlined a DOT chart, stating that it is likely to move to a new all-time high price near $60.

The wave count does indicate that the movement since March was a completed flat correction, likely as a part of wave four. If correct, it would indicate that DOT has now begun wave five.
The most likely target for the top of the movement is found between $61 and $65. It is found using an external retracement and Fib projection.
Afterwards, the next most likely resistance area would be found at $84.
DeFi index
The DeFi index has been increasing since April 18. On May 3, it managed to reach a new all-time high price of $3,650.
Furthermore, technical indicators support the continuation of the upward movement.
Similarly to DOT, we can use an external Fib retracement to find the next closest resistance areas. They are located at $4,319 and $5,620.

To conclude, DOT is expected to continue increasing and eventually reach a new all-time high price. A potential target for the top of the move is found between $61 and $65.
For BeInCrypto’s latest bitcoin (BTC) analysis, click here.
