


The DeFi Index (DEFIPERP) is breaking down from a long-term ascending support line. Uniswap (UNI) has broken down below the $17.50 horizontal area. SushiSwap (SUSHI) has broken down from the $8.10 area and is trading inside a descending wedge.
SUSHI
SUSHI has been decreasing since reaching an all-time high on March 13. It created a lower high on May 18 and has been falling at an accelerated rate since.
On June 19, it broke down from the $8.10 area and validated it as resistance two days later. It is now approaching the next support level at $5.60.
Technical indicators are bearish. The MACD, RSI & Stochastic oscillator are falling. The MACD is negative, the RSI is below 50 and the Stochastic oscillator has made a bearish cross.

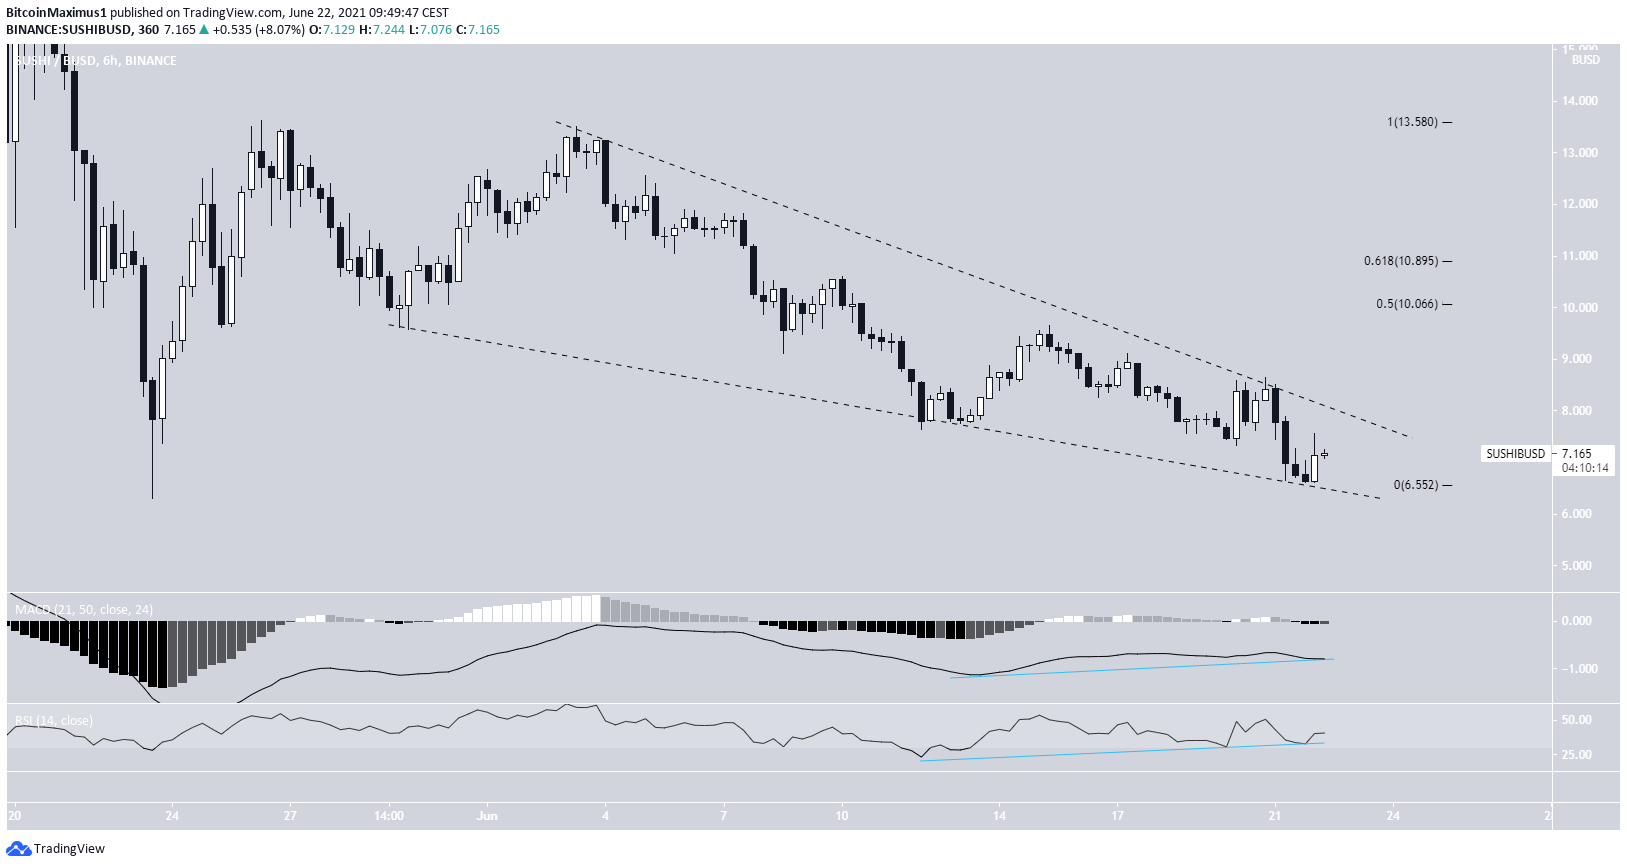
The shorter-term six-hour chart shows a descending wedge that has been in place since June 3. Currently, the token is trading right at the support line of the wedge, which is considered a bullish pattern.
In addition to this, the MACD & RSI have generated bullish divergence.
If a breakout occurs, the $10.06-$10.9 area could act as the top. However, the longer-term trend would likely still remain bearish.
Highlights
- There is resistance at $8.10 and support at $5.60.
- SUSHI is trading inside a short-term descending wedge.
UNI
UNI has been decreasing since May 3, when it reached an all-time high price of $45. The decrease continued until a low of $13 was reached on May 23. The ensuing bounce validated the $17.50 area as support.
However, the upward movement was short-lived, and the token has fallen back below the $17.50 area since. It is currently decreasing towards the next support level at $9.75.
Technical indicators in the daily time-frame are bearish. The Stochastic oscillator has made a bearish cross, the MACD is negative and the RSI is falling below 30.
As a result, a drop towards this area would be expected.

Highlights
- UNI has broken down from the $17.50 support area.
- Technical indicators are bearish.
DeFi Index
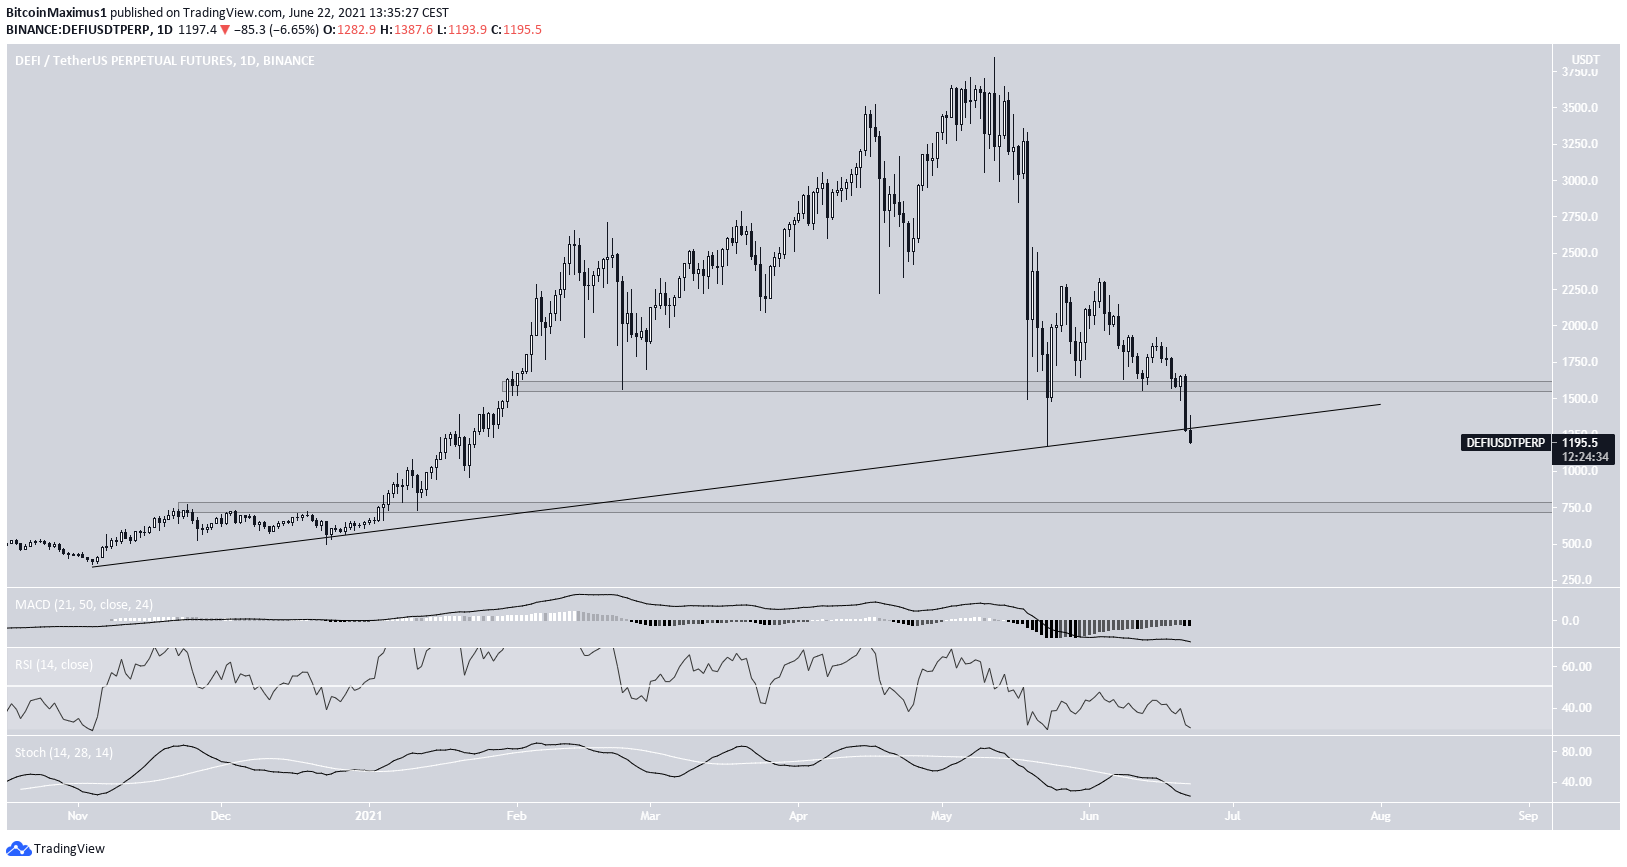
The DeFi Index has been falling since. While it bounced at a long-term ascending support line on May 19, the ensuing upward movement was short-lived.
On June 21, it broke down from the $1600 support area and is currently in the process of breaking down from the ascending support line.
This would take the index down to the next support area of $750.
Technical indicators are bearish, supporting the possibility that the index continues falling.
For BeInCrypto’s latest bitcoin (BTC) analysis, click here.


