


1inch (1INCH) has been moving upwards since April 23, potentially completing wave four in the process.
Band Protocol (BAND) is trading inside an ascending parallel channel and seems to have completed a running flat correction.
Kava.io (KAVA) is attempting to reclaim the $5.20 area, which could determine if the trend is still bullish.
1inch (1INCH)
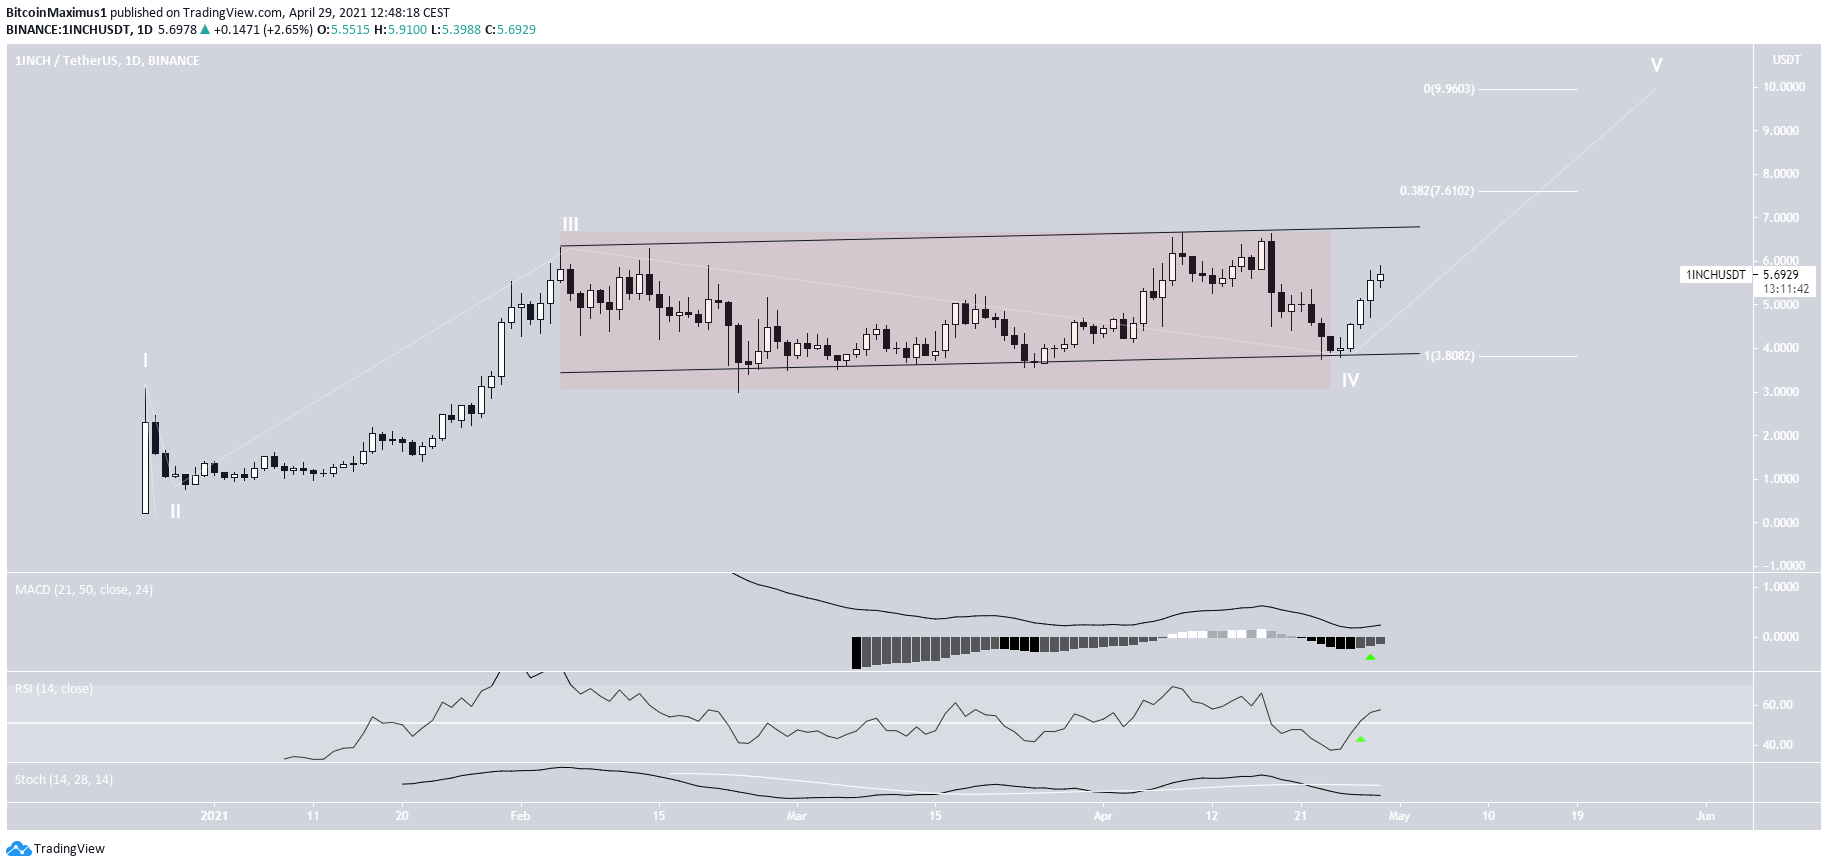
On Feb. 15, 1INCH reached a high of $6.33. This marked an end to a rapid upward movement that had been ongoing since the beginning of the year.
While the token made a slightly higher high of $6.67 on April 9, the movement between February and April looks corrective. Therefore, it is likely that the entire period was wave four, transpiring inside a running flat correction.
1INCH has been increasing since April 23, in a move that looks impulsive.
The two most likely targets for the top of the upward movement are found at $7.61 and $9.96, respectively.
Stochastic Oscillator is still bearish. However, both the MACD and RSI support the possibility of a breakout.
Highlights
- 1INCH completed a running flat correction.
- There is potential resistance at $7.6 and $9.96.
Band Protocol (BAND)
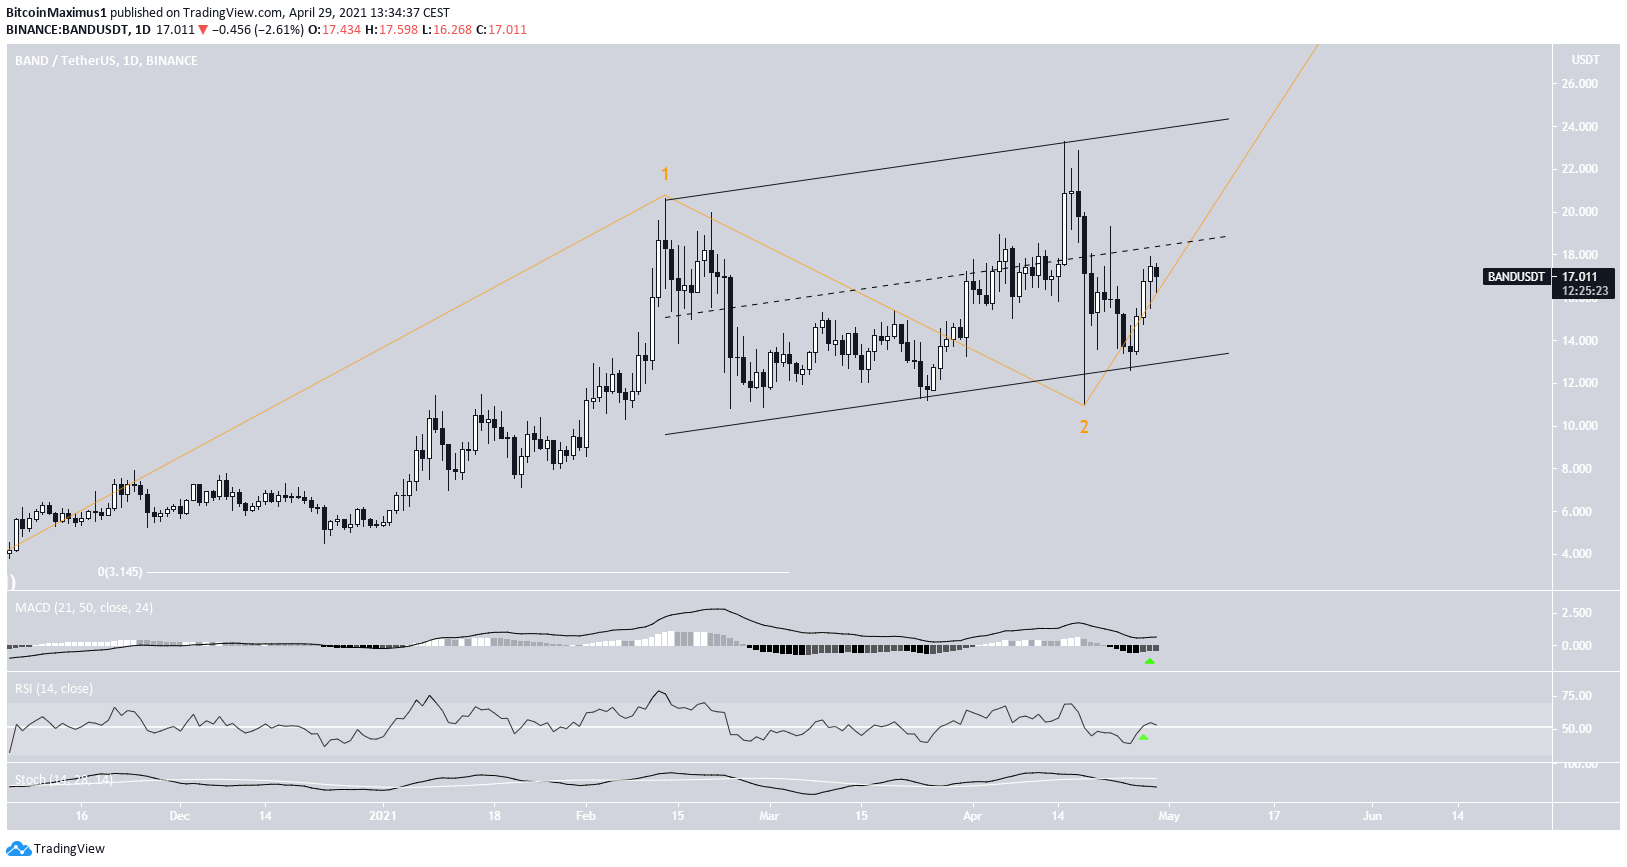
On April 15, BAND reached a high of $23.30, but dropped sharply almost immediately afterwards. It proceeded to reach a low of 11, three days later.
Despite the drop, the token bounced at the support line of an ascending parallel channel. Similarly to 1INCH, BAND seems to have completed a running flat correction.
Both the MACD and RSI have turned bullish, and the Stochastic Oscillator could soon follow suit.
While BAND is still trading in the lower portion of the channel, the reclaim of the middle would confirm that the trend is bullish and the token is heading towards new highs.
Highlights
- BAND is trading inside an ascending parallel channel.
- The MACD and RSI have turned bullish.
Kava.io (KAVA)
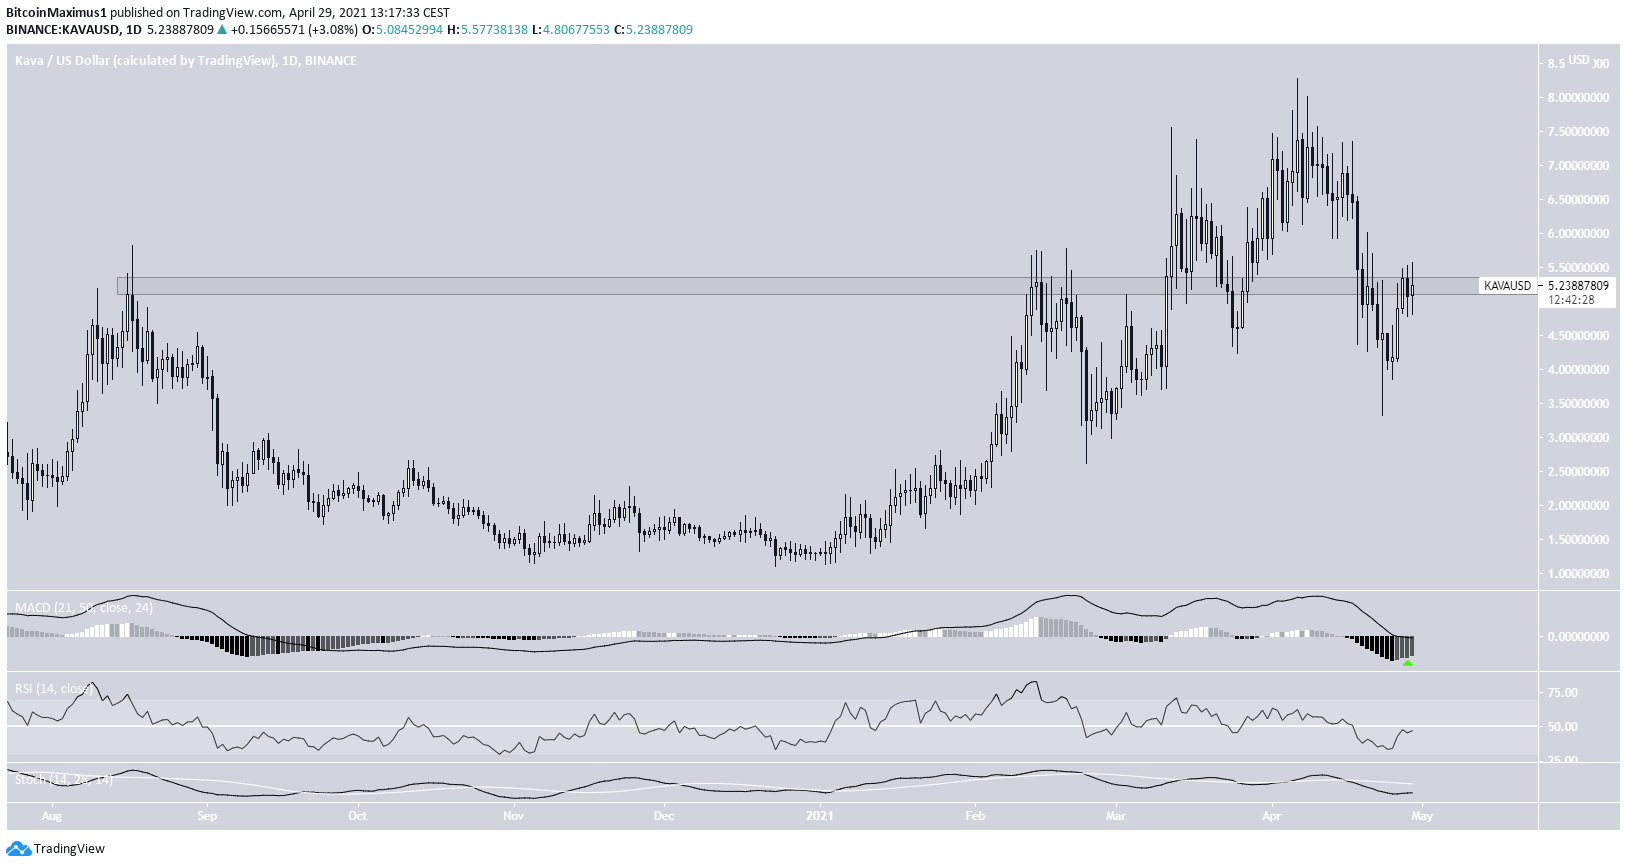
KAVA has been moving downwards since April 6, when it reached an all-time high price of $8.28. The decrease took it to a low of $3.31, considerably below the $5.20 area, which was supposed to act as support. Currently, the token is attempting to reclaim it once more.
The $5.20 area has intermittently acted as both resistance and support since August 2020. Therefore, its reclaim is crucial if the upward trend is to resume.
However, technical indicators are neutral/bearish, failing to confirm the continuation of the upward movement.
Highlights
- KAVA is attempting to reclaim the $5.20 area.
- Technical indicators are neutral.
For BeInCrypto’s latest bitcoin (BTC) analysis, click here.


