


Both the Decentraland (MANA) and the Sandbox (SAND) prices are following descending resistance lines. The potential for a drop is steeper in the case of SAND.
Decentraland (MANA) Price Approaches Long-Term Support
Decentraland is a virtual reality platform built on the Ethereum blockchain technology. Hence, the MANA token is an ERC-20 token. MANA can be used to buy plots of land in the Decentraland marketplace, upon which they can build upon and monetize.
MANA price has fallen underneath a descending resistance line since reaching an all-time high price of $5.90 in Nov. 2021. In Nov. 2022, the line caused a sharp rejection (red icon), leading to a breakdown below the $0.50 area. This was a crucial movement since the area had provided support since May 2021.
Decentraland price has decreased since and is approaching the next long-term support area at $0.31. The area also coincides with the 0.618 Fib retracement support level when measuring the entire upward movement since 2020.
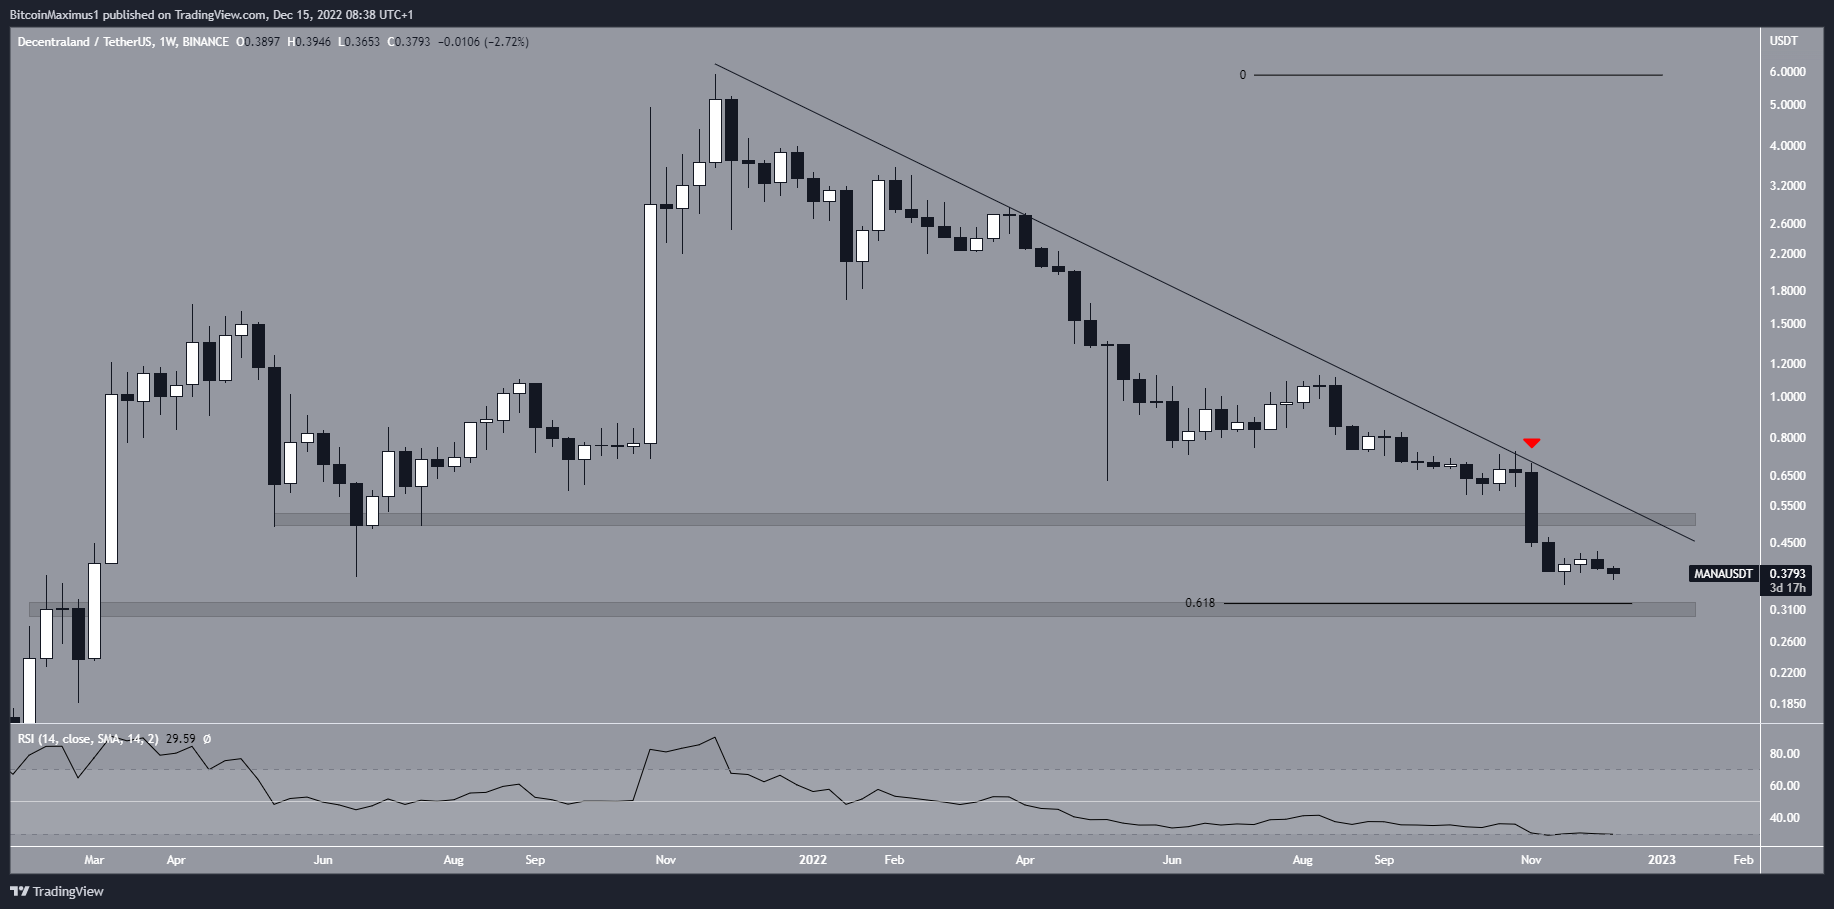
Since the weekly RSI is falling without any bullish divergence, there are no bullish reversal signs in place yet. The most likely Decentraland price projection is a fall toward the $0.31 level. This would represent a 20% downswing from the current MANA price.
Decentraland would have to print a weekly close above the $0.50 area and descending resistance line to invalidate the bearish MANA price prediction.
Sandbox (SAND) Price Could Fall Sharply
SAND is the utility token of the blockchain-based virtual world Sandbox. SAND price has also decreased below a descending resistance line since its all-time high of $8.48 in Nov. 2021.
In the beginning of Nov. 2022, SAND price broke down from the $0.80 horizontal support area, which had been in place since before the all-time high. In similar fashion to Decentraland, the weekly RSI is decreasing and has not generated any bullish divergence.
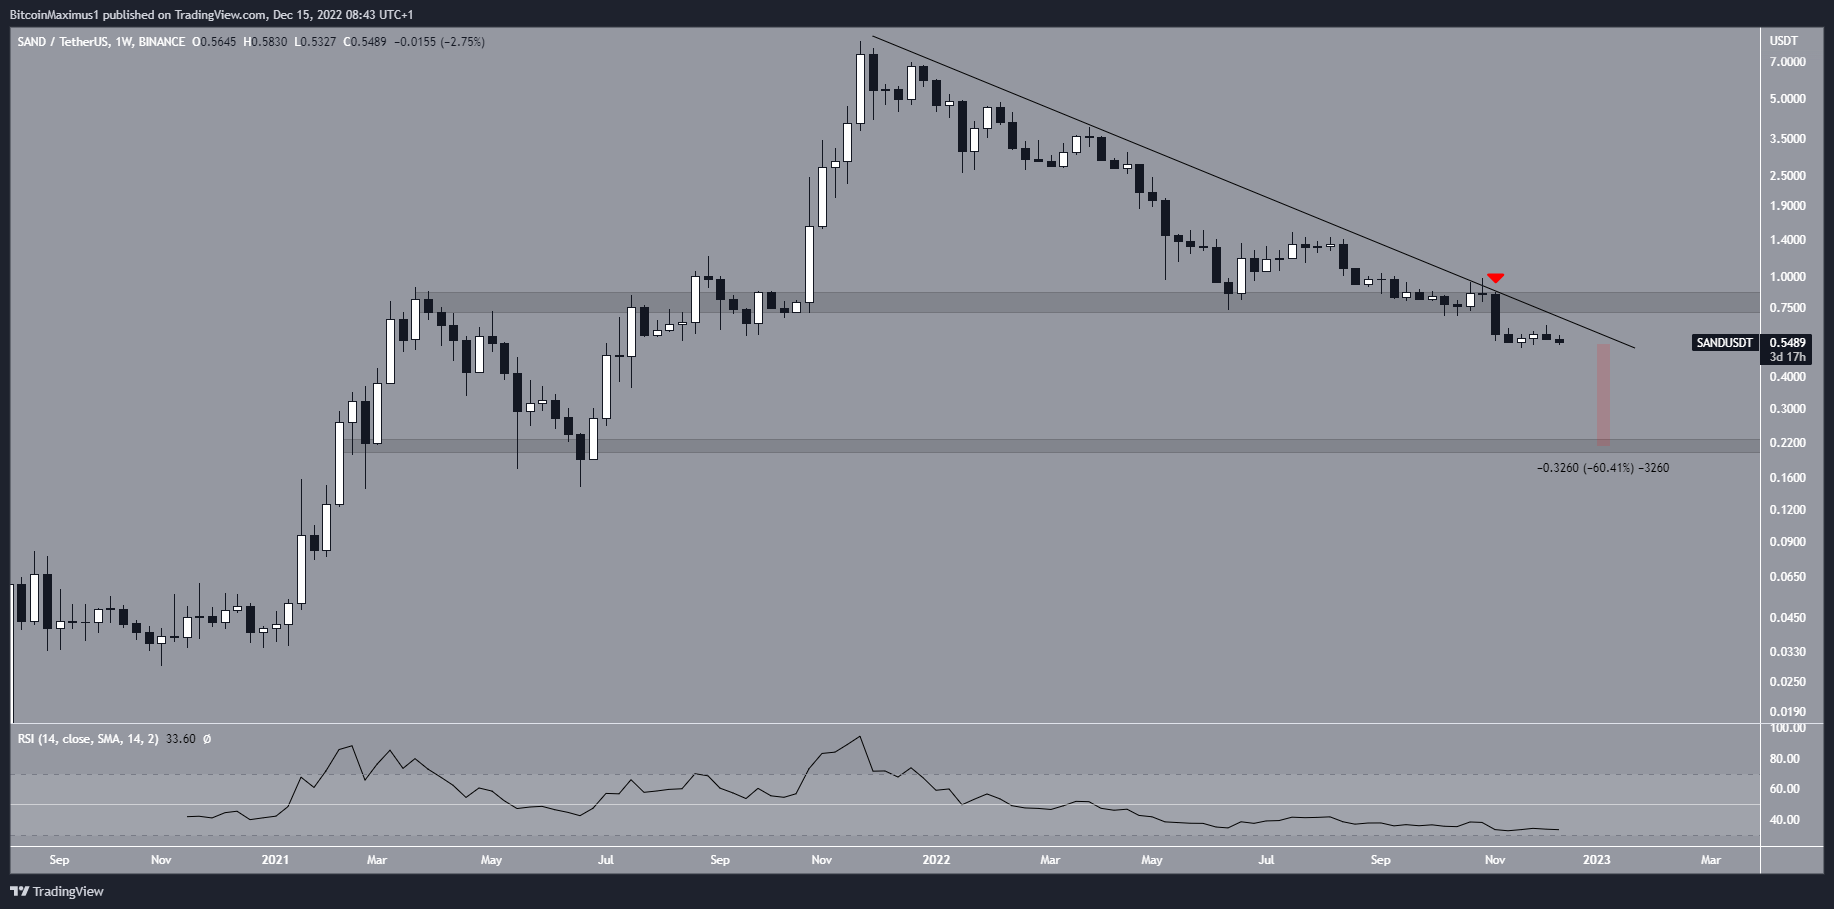
If the downward movement continues, the next closest support area for Sandbox price is at $0.22. A downswing to this level would represent a 60% price drop for SAND. Therefore, the potential for a sharp sell-off seems to be higher for the SAND price when compared to the MANA price.
A breakout from the descending resistance line would invalidate this bearish projection.
For BeInCrypto’s latest crypto market analysis, click here.


