


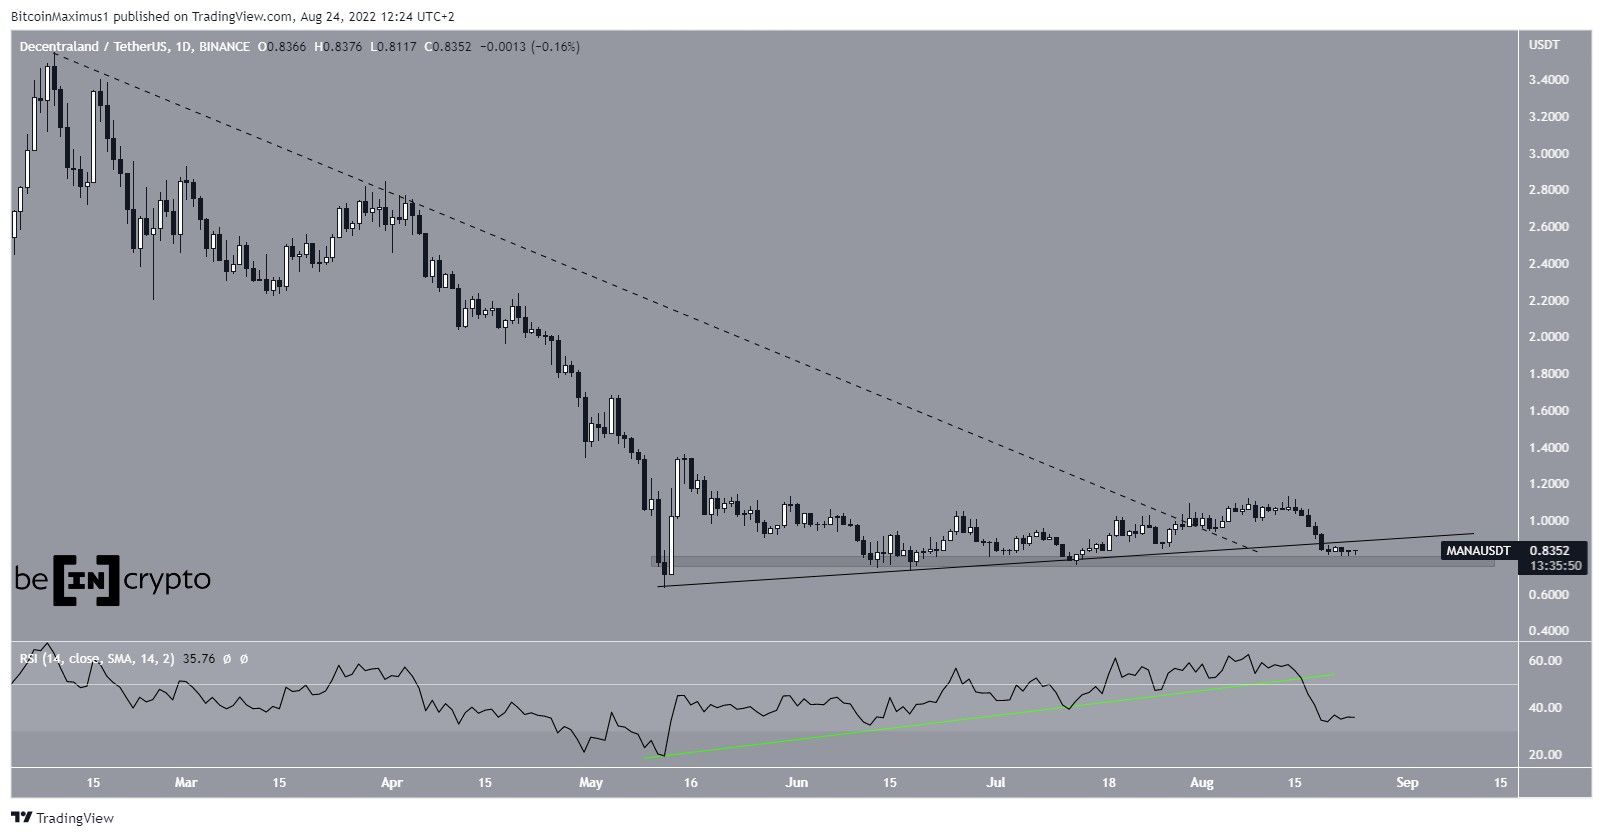
Decentraland (MANA) has broken down from a short-term support level and risks invalidating its bullish structure.
MANA has been increasing alongside an ascending support line since May 12. The upward movement caused a breakout from a long-term descending resistance line (dashed) on July 30.
However, the price failed to sustain its upward movement and has been decreasing since shortly after the breakout.
On Aug 19, MANA broke down from the aforementioned ascending support line. This decrease was preceded by a daily RSI breakdown (green line) below both an ascending support line and the 50 line. Both of these are considered signs of bearish trends.
The closest support area is at $0.77. A breakdown below it could trigger a sharp sell off and the acceleration of the downward movement.
Ongoing decrease
Analytics account @NFTgators tweeted a chart which shows that Decentraland sales have fallen to a new six-month low.
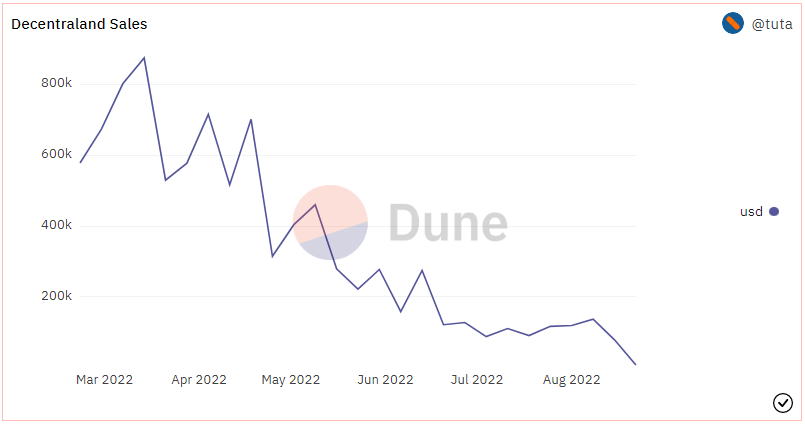
This decrease in demand has also been reflected in the price, which has been falling for the past 272 days.
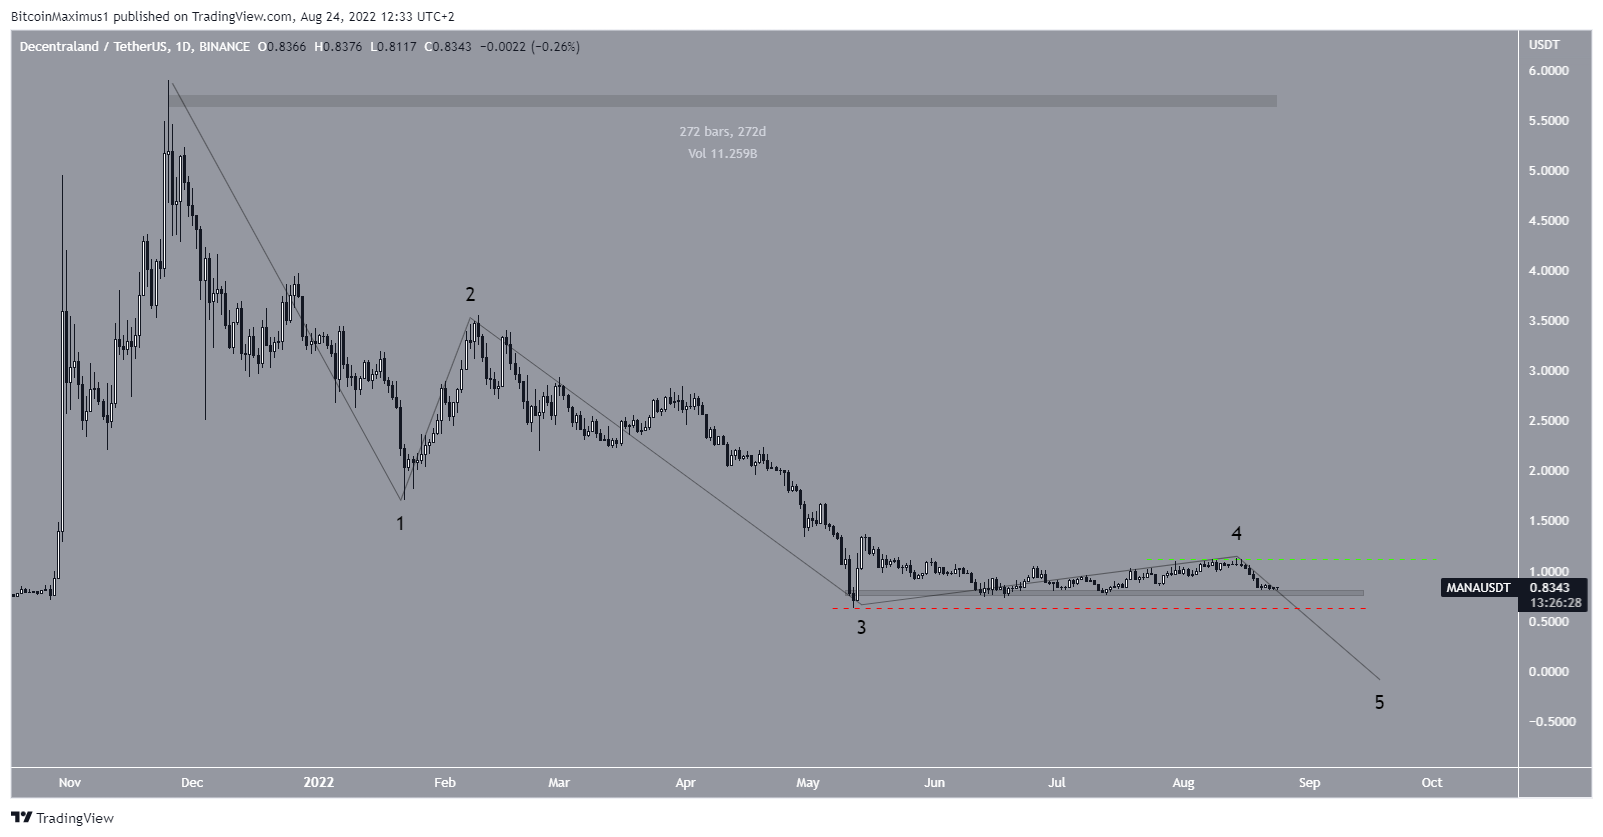
Due to the aforementioned breakdown, it is possible that the price has just completed wave four of a five-wave downward movement (black). In this possibility, the price will break down from the $0.77 area and decrease towards $0.30.
A decrease below $0.63 (red line) would confirm this count while an increase above $1.13 (green line) would invalidate it.
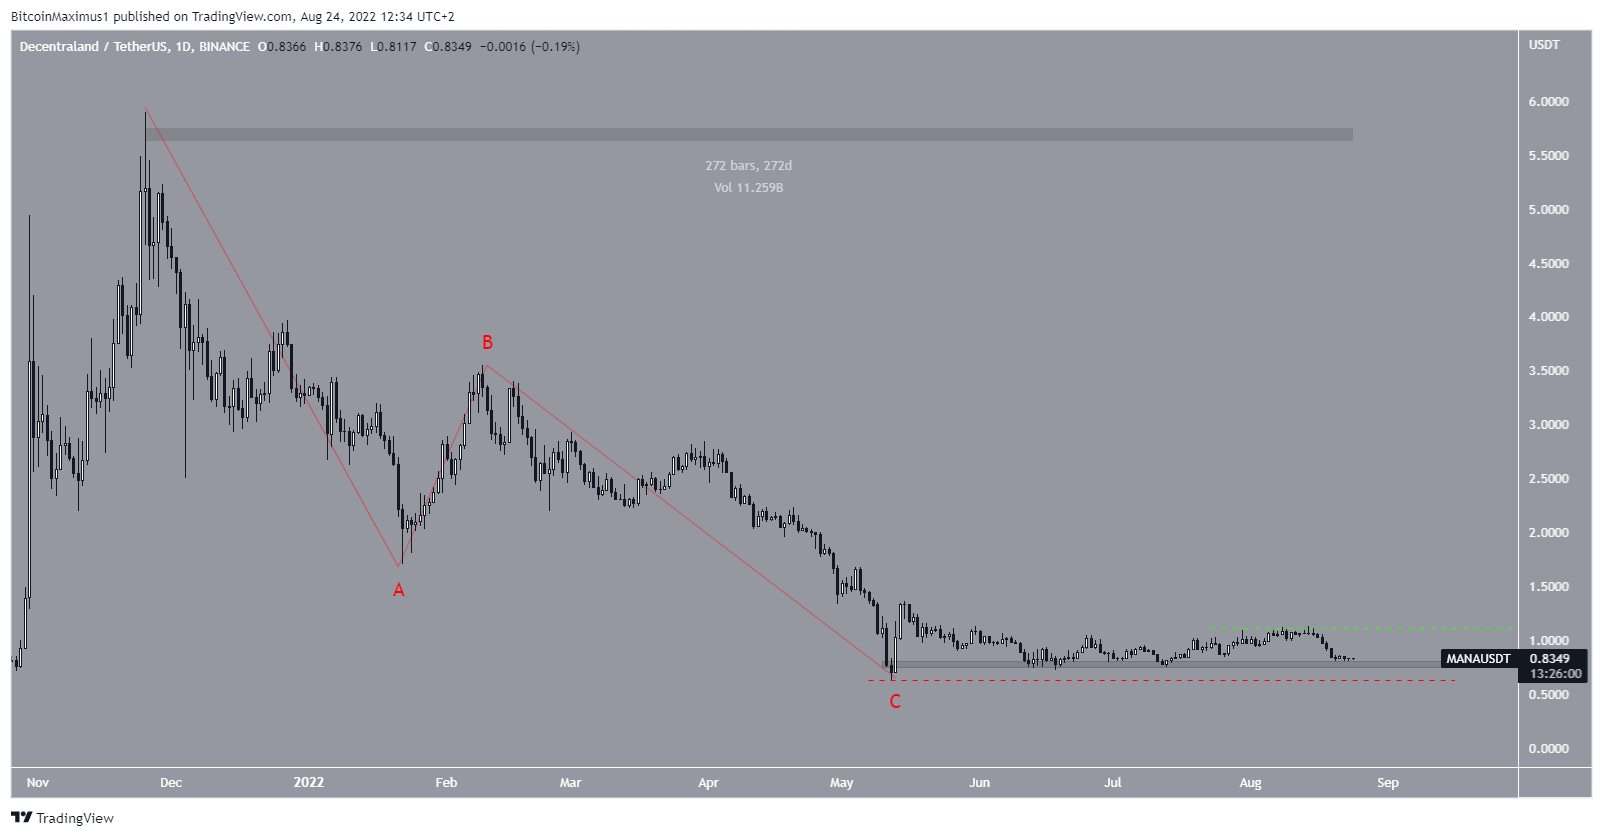
The alternative bullish count suggests that measuring from the all-time high, MANA has completed an A-B-C corrective structure.
So, it will now initiate an upward movement as part of a bullish trend reversal.
Inversely to the previous count, an increase above $1.13 (green line) would confirm this count while a decrease below $0.63 (red line) would invalidate it.
For Be[in]Crypto’s latest Bitcoin (BTC) analysis, click here
