


Decentraland (MANA) price is showing bullish signs in the weekly time frame, but the daily chart suggests more downside is likely prior to a reversal.
Meanwhile, The Sandbox (SAND) price has a bearish outlook in both long- and short-term time frames. It broke down from a horizontal support area and is at risk of decreasing below its yearly lows. This could greatly accelerate the rate of decrease.
MANA price breaks down below 17-month support
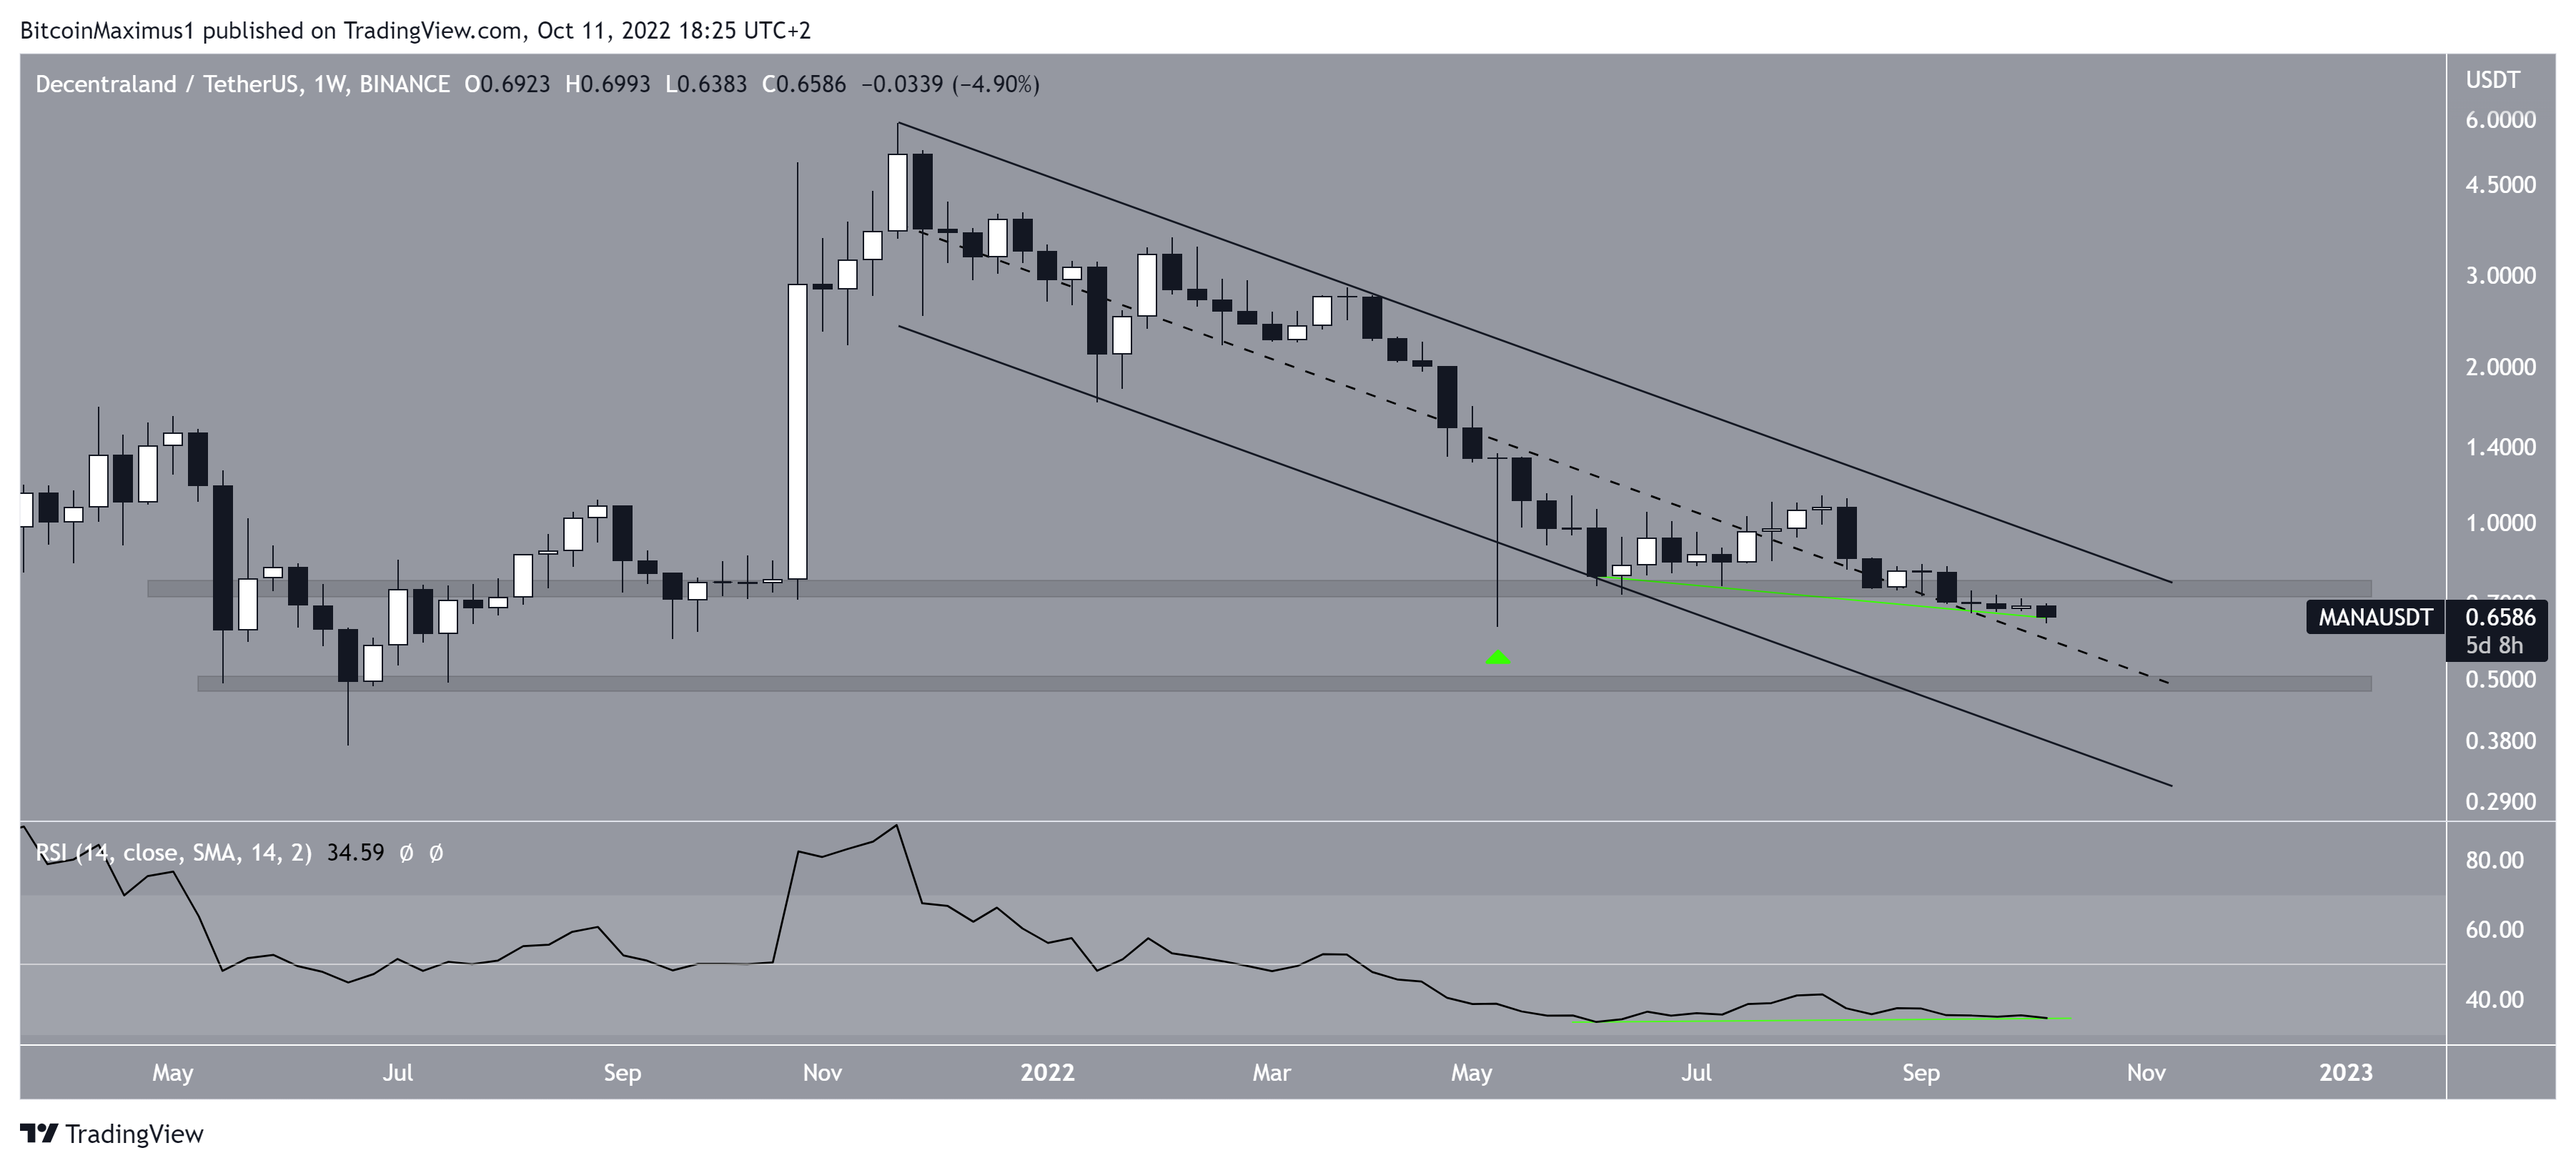
MANA price has been decreasing inside a descending parallel channel since reaching an all-time high price of $5.91 in May 2021. The downward movement so far has led to a low of $0.62 in May 2022.
Initially, it seemed that the downward movement caused a breakdown from the support line of the channel. However, MANA price reversed trend shortly afterward and created a very long lower wick in the process (green icon).
Since such channels usually contain corrective movements, an eventual breakout from it would be the most likely scenario.
This possibility is further strengthened by the fact that Decentraland price is trading in the upper portion of the channel and the bullish divergence is present in the weekly RSI (green line).
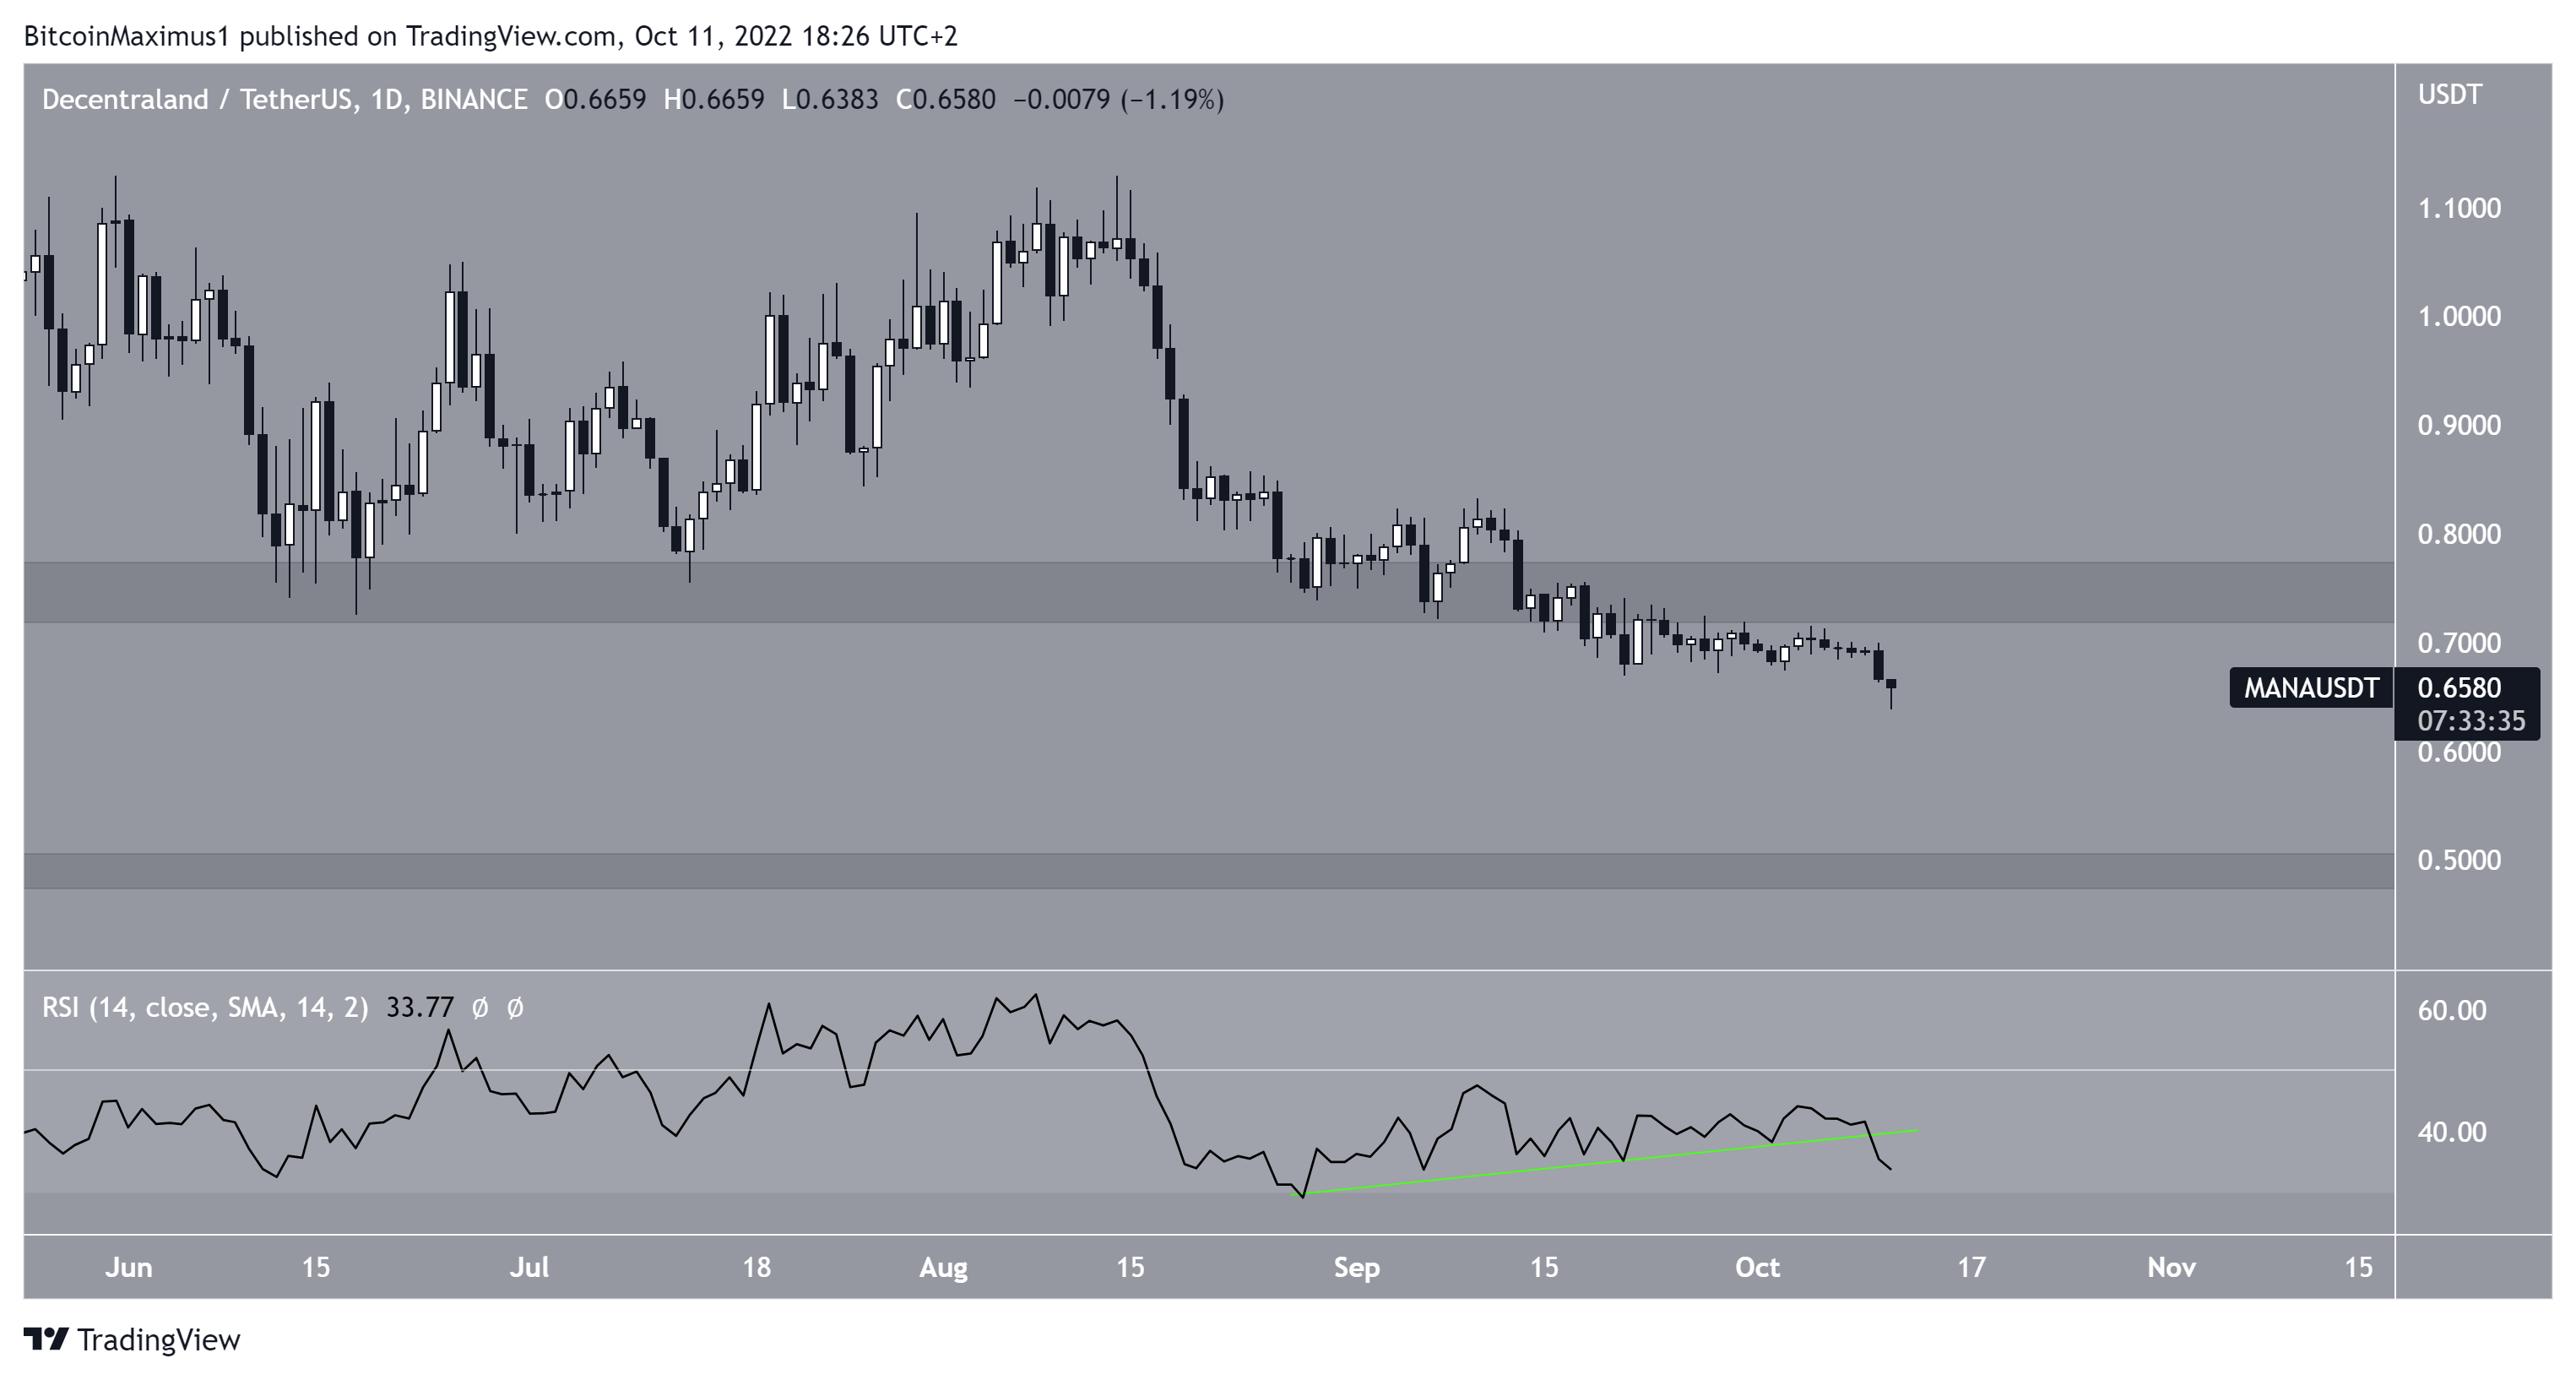
Despite these bullish readings, MANA price has fallen below the crucial $0.75 horizontal area, which had previously provided support since Aug. 2021.
Moreover, the bullish divergence trend line in the daily timeframe of the RSI has now been broken. This indicates that the downward Decentraland price movement is likely to continue toward the next closest support area is at $0.49.
So, the combined readings of the weekly and daily time frame indicate that a MANA price fall toward $0.49 could occur prior to an eventual breakout.
SAND price faces a move downward
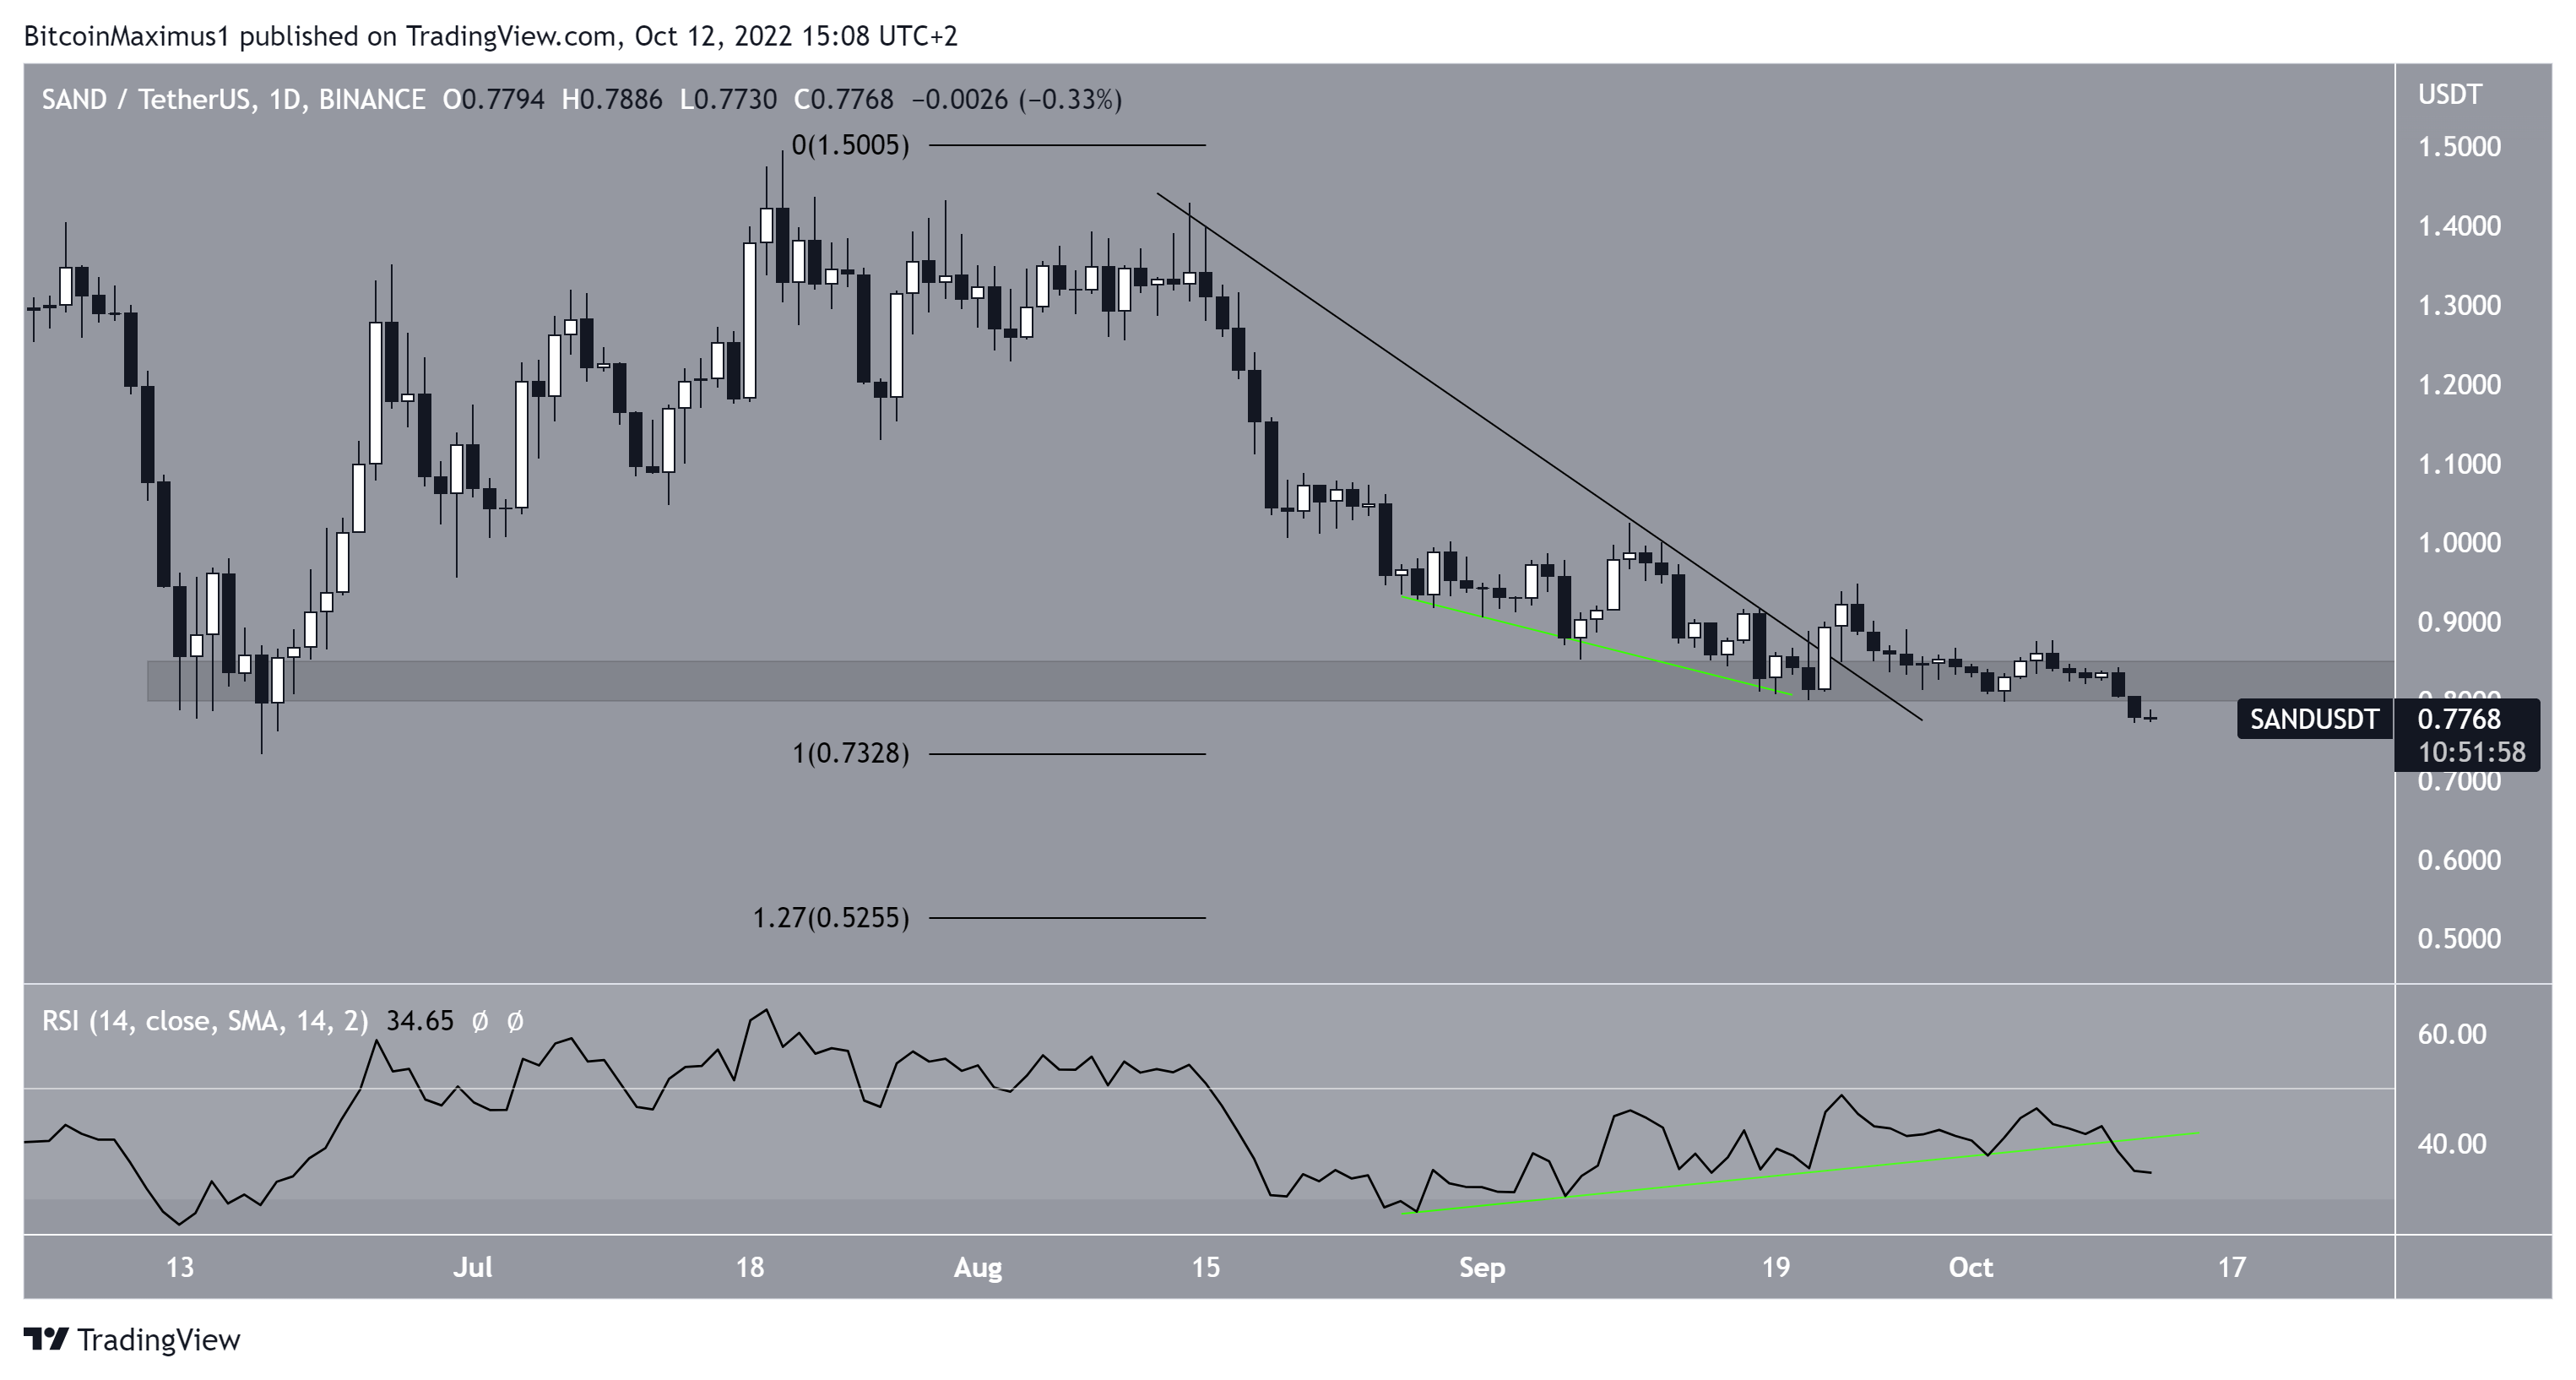
The daily time frame for The Sandbox price shows that the price initiated an upward movement on Sept. 22 and broke out from a descending resistance line in the process.
The upward movement was preceded by bullish divergence in the daily RSI. However, it could not be sustained, and the SAND price has fallen below the pre-breakout levels.
Similar to MANA price, the bullish divergence trend line in the daily RSI (green line) has been broken. Additionally, the SAND price has fallen below the $0.83 horizontal support area, which had previously been in place since the aforementioned June lows.
Therefore, more downside in the daily time frame is expected. When using a Fib retracement on the most recent portion of the upward movement, the closest support area for SAND price is at $0.55, created by the 1.27 external Fib retracement level.
MANA price has higher return potential than SAND price
Based on their price action and technical indicator readings, both SAND and MANA prices are expected to decrease in the short-term. However, the long-term outlook remains bullish for MANA price, while that of SAND price is leaning on bearish.
For Be[In]Crypto’s latest Bitcoin (BTC) analysis, click here
Disclaimer: Be[in]Crypto strives to provide accurate and up-to-date information, but it will not be responsible for any missing facts or inaccurate information. You comply and understand that you should use any of this information at your own risk. Cryptocurrencies are highly volatile financial assets, so research and make your own financial decisions.


