


Key Highlights For March 12, 2019.
- The price has been on an upward trend since Mar 5.
- Price is trading inside an ascending triangle.
- The MACD and SMAs triggered a buy signal.
- There is resistance near $85 and $90.5.
- There is support near $80.
Horizontal Resistance
The price of Dash (DASH) on Binance is analyzed at one-hour intervals from Mar 4 to Mar 12.
The price reached a high of $85.98 on Mar 7. By Mar 12, it had revisited the same level four times. Tracing these highs gives us a horizontal resistance line.

The resistance line can act as a ceiling to price. It predicts the upper limits of price. Theoretically, the price should not move above resistance.
In several incidences, the price of DASH did rise above the resistance, but these highs quickly fell back below the line. Wicks above resistance without sustained movement above the line is relatively insignificant. For this reason, DASH’s deviations from the norm can be ignored.
Ascending Triangle
The price reached a low of $78.29 on Mar 4. Since then, it has been on a gradual upward move. Tracing these lows gives us an ascending support line.
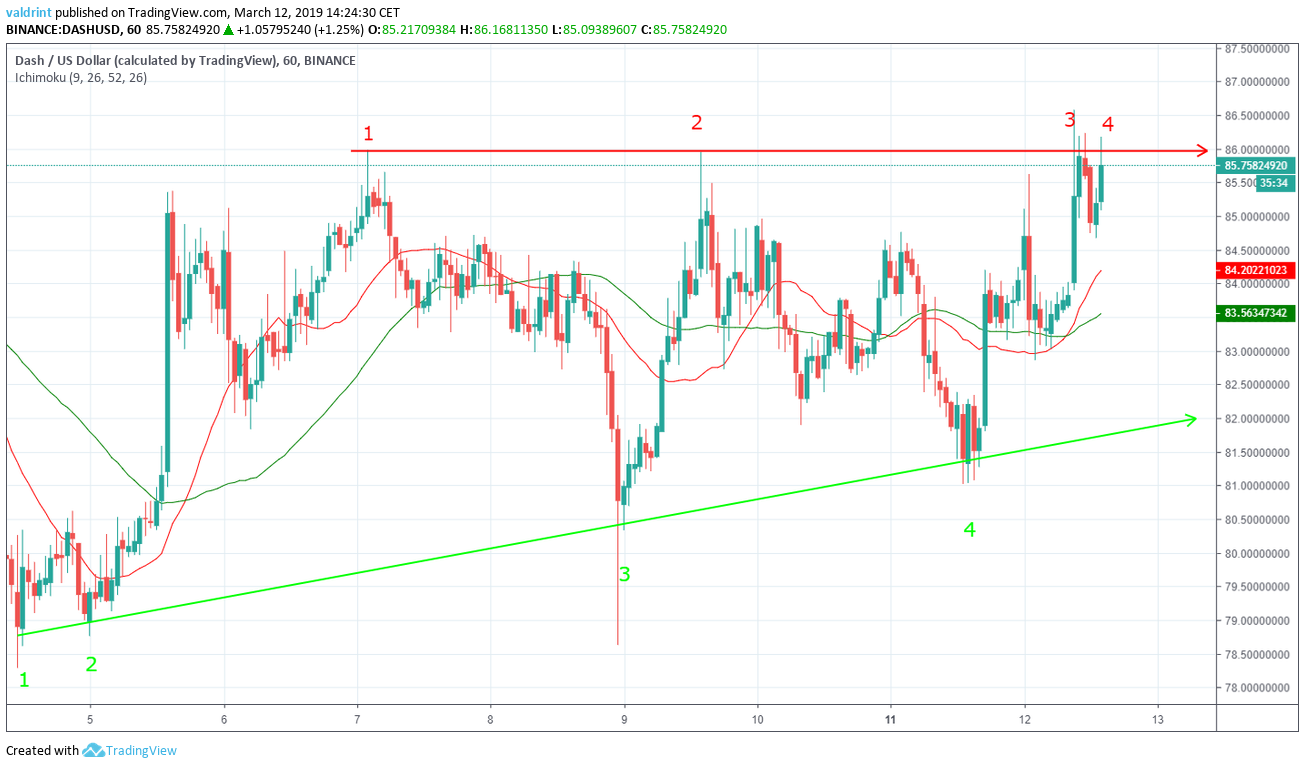
The resistance and support lines combine to create an ascending triangle. This is a bullish pattern—which means that a price increase is more likely than a decrease.
Given the current market conditions, it is likely that the price trades inside the ascending triangle until a possible breakout above the resistance. This could lead to rapid and significant price spikes.
Signal Triggered
The moving average convergence divergence (MACD) is a trend indicator that shows the relationship between two moving averages (long and short-term) and the price. It is used to measure the strength of a move.
Combined with simple moving averages (SMA), it can be used as a trigger for buy and sell signals. Signals are triggered whenever the MACD line is above 0 and the price is above the 21 (red) and 50-period (green) SMAs.

On Mar 11, the price moved above the 21 and 50-period moving averages. Similarly, the MACD line crossed above 0. This would have triggered a buy signal, indicating that an uptrend may be starting.
This movement will be invalidated by a price close below the SMAs and a MACD line cross below 0.
These indicators appear to confirm forthcoming price increases as indicated by the ascending triangle.
Future Movements
In order to predict possible future reversal areas, the price of DASH on Binance is analyzed at two-hour intervals from Feb 18 to Mar 12. The price is currently trading at the first resistance area near $85. The next one is found between $90 and $91. If the price were to break out from the triangle, the $90-$91 area would be a likely reversal level.
Conversely, the closest support area is found near $79. If the price were to break down, this would present a likely reversal area. According to our analysis, this scenario is unlikely.
Summary of Analysis
Based on this analysis, a breakout above the resistance appears more likely than a breakdown below support. If the price of DASH moves toward past the first resistance point, such a prediction may be partially validated. If the price reaches or exceeds $91, this prediction will be fully validated
Do you think the price of DASH will break out of the triangle? Let us know in the comments below.
Disclaimer: This article is not trading advice and should not be construed as such. Always consult a trained financial professional before investing in cryptocurrencies, as the market is particularly volatile.


