


On Apr 1, 2019, the DASH price made a high of ₿0.029. Since then, it has been decreasing, reaching lows below ₿0.0135.
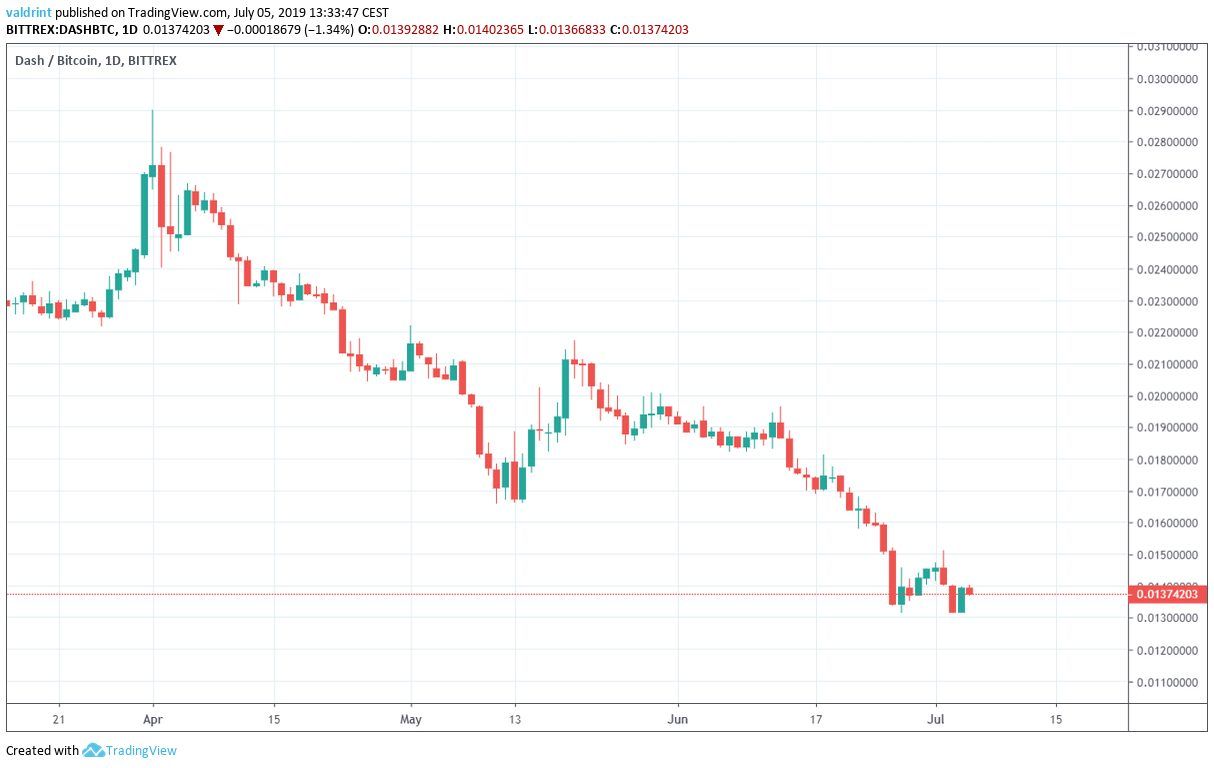
At the time of writing, it was trading near ₿0.0137.
How long will this decrease continue? Keep reading in order to find out.
If you would like to trade cryptocurrencies on our partner exchange, follow this link to get all set up on XCOEX.
DASH Price: Trends and Highlights for July 5
- DASH/BTC is trading close to a significant support area.
- It is trading inside a descending channel.
- There is bullish divergence developing in the MACD and the RSI.
- It is trading inside a short-term ascending triangle.
- There is resistance near ₿0.0146
DASH Price: Long-Term Support
Throughout 2016, the DASH price was trading between ₿0.01 and ₿0.02.
After trading around ₿0.01 from September 2016 to February 2017, it began a rapid upward movement.
The next month, it reached highs above ₿0.12.
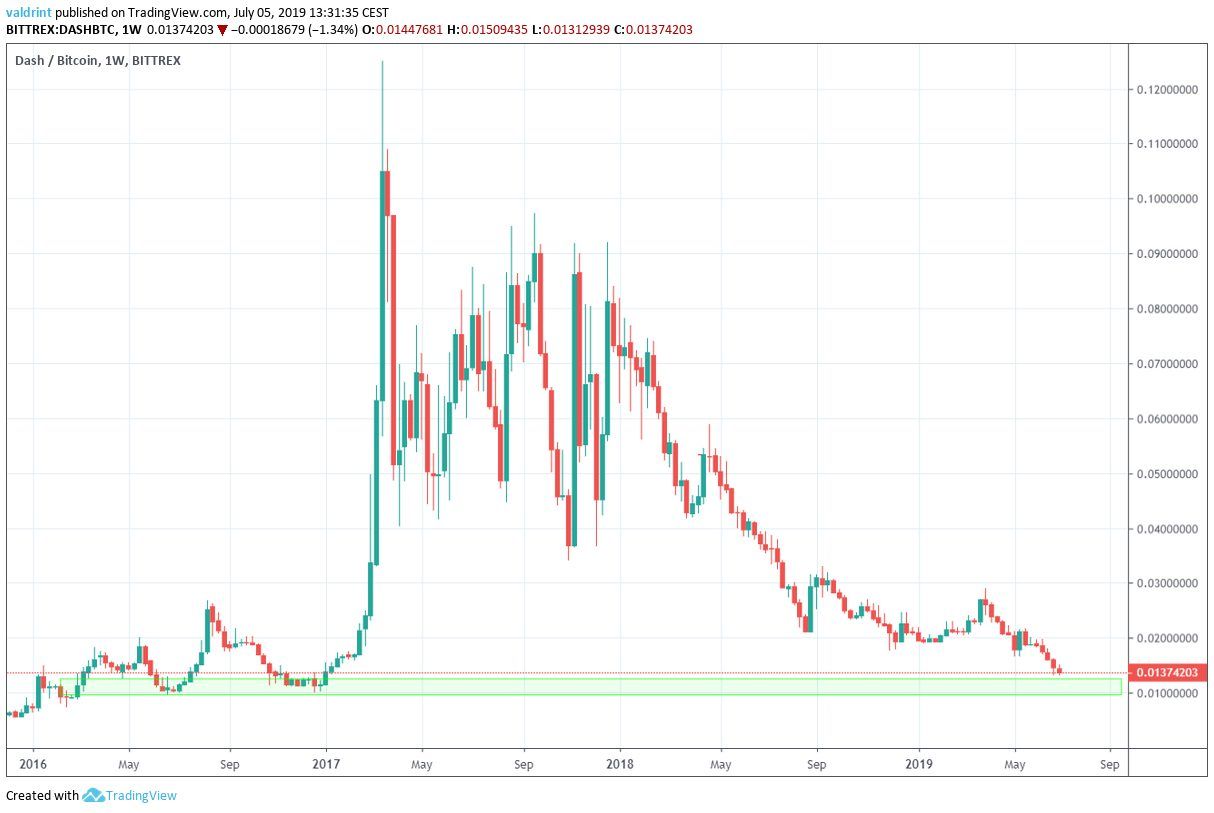
Since then, however, it has been decreasing.
At the time of writing, it was trading slightly above the original support area near ₿0.01.
DASH Price in a Descending Channel
On Aug 27, 2018, the DASH price reached a low of ₿0.021. A rapid upward move was succeeded by a gradual decrease.
Since then, DASH has been trading inside the descending channel outlined below:
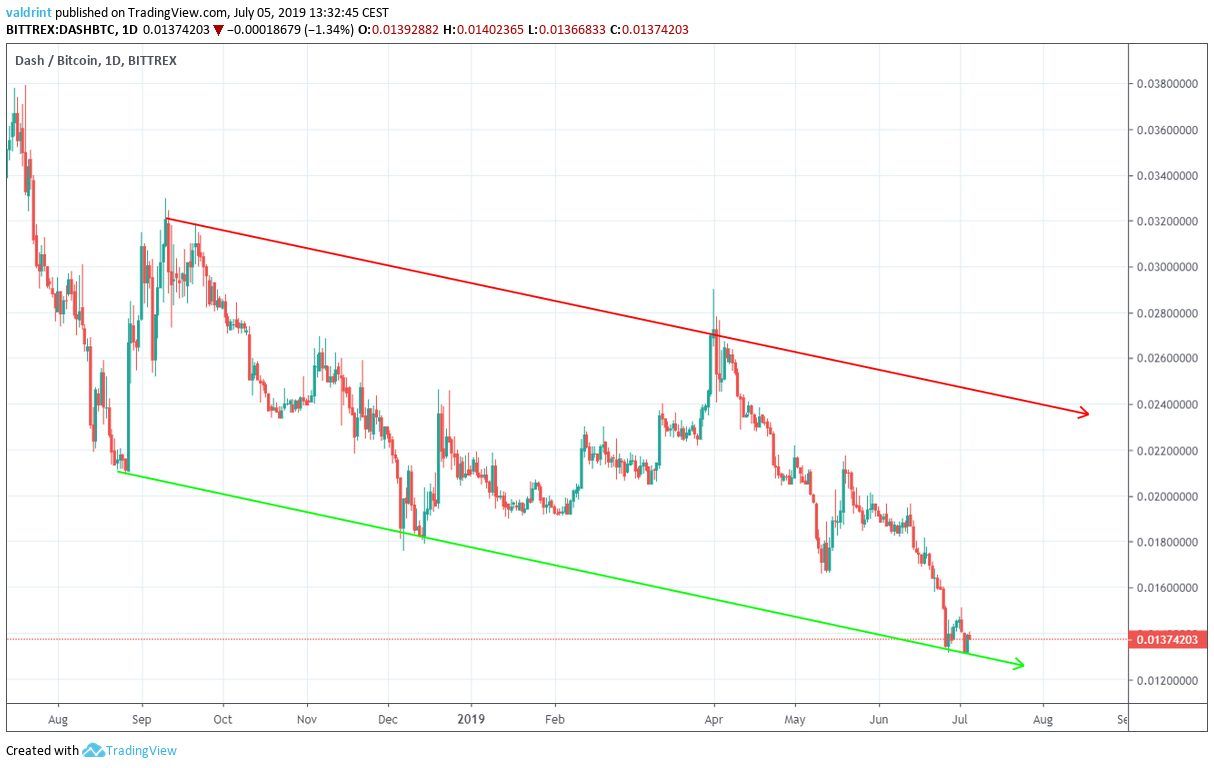
At the time of writing, it had touched the support line for the fifth time.
The previous time it did so, an upward move ensued and the DASH price reached the resistance line.
Will it do so again?
Possible Reversal
A closer look at the daily time-frame shows that there are two instances of bullish divergence currently developing.
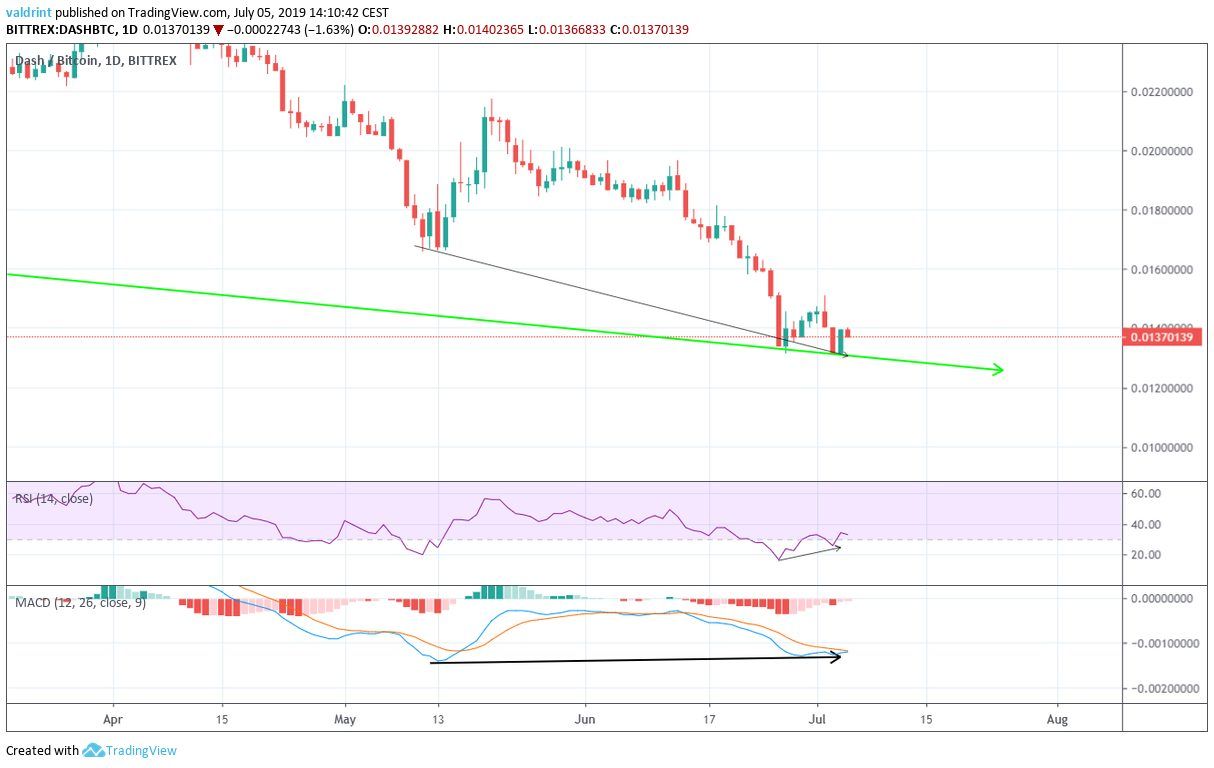
Firstly, the MACD has been generating higher values since May 13. This is in stark contrast to the price, which has been decreasing.
The divergence was especially evident during the lows of June 27 and July 3.
Secondly, the RSI has also been generating divergence, albeit at a shorter time-frame. It has only been doing so in the period from June 27 to July 3.
The combination of these two indicators makes it likely that the DASH price will soon begin an upward move.
Let’s take a look at the short-term to see when that will occur.
Short-Term
Since reaching a low of ₿0.0131 on July 4, the DASH price has been trading inside an ascending triangle.
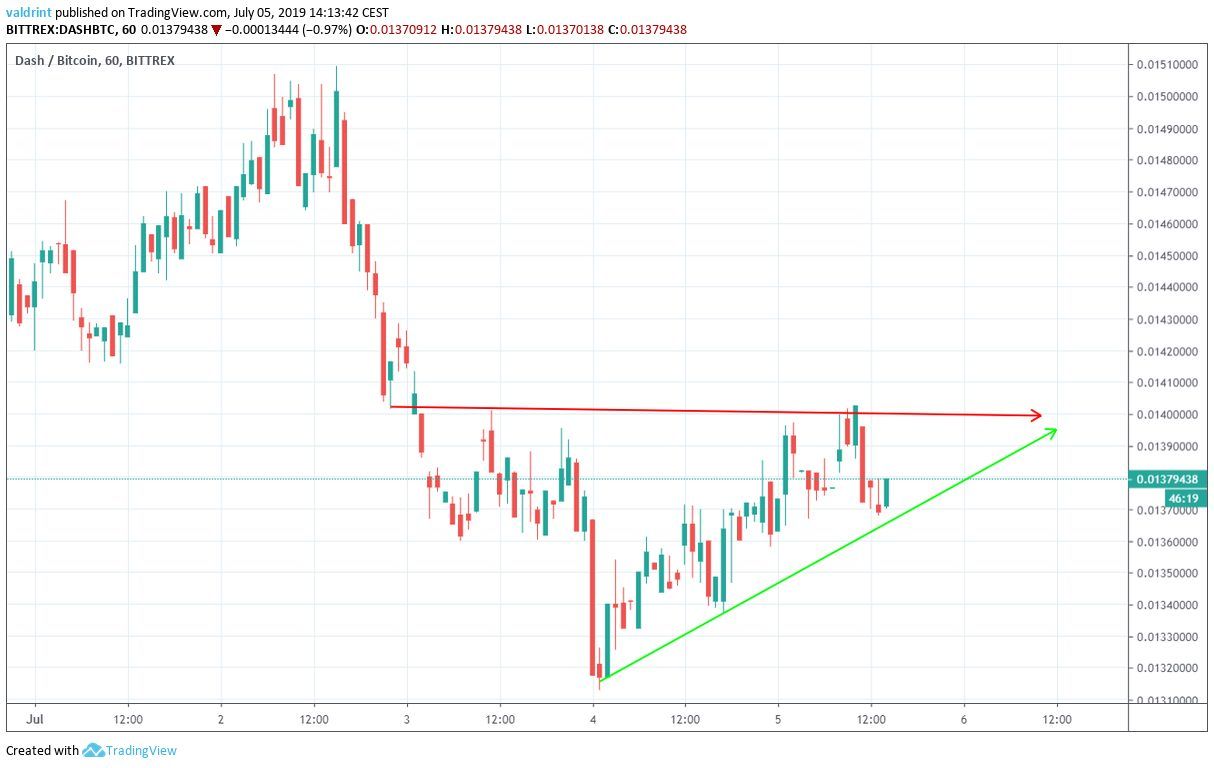
The resistance line of the triangle is at ₿0.0140.
The ascending triangle is considered to be a bullish pattern and is projected to end on July 6 at 12:00 the latest.
A look at the short-term moving averages (MA) also supports a breakout from this pattern.
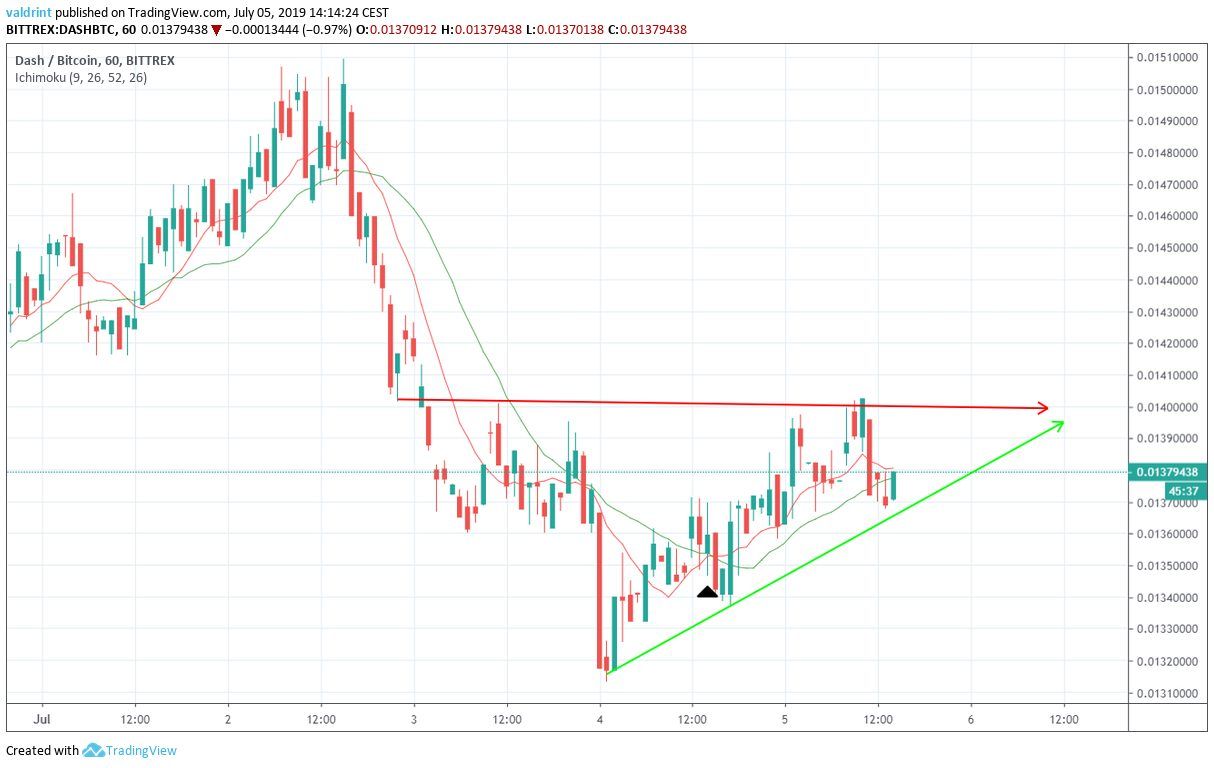
On July 4 the 10-hour MA crossed above the 20-hour one.
This is known as a bullish cross and often indicates that an uptrend has begun.
The combination of long-term momentum indicators and short-term MAs makes it likely that the DASH price will break out of the triangle soon.
If it does, where will it find resistance?
Resistance Areas
A resistance area is outlined for the DASH price below:
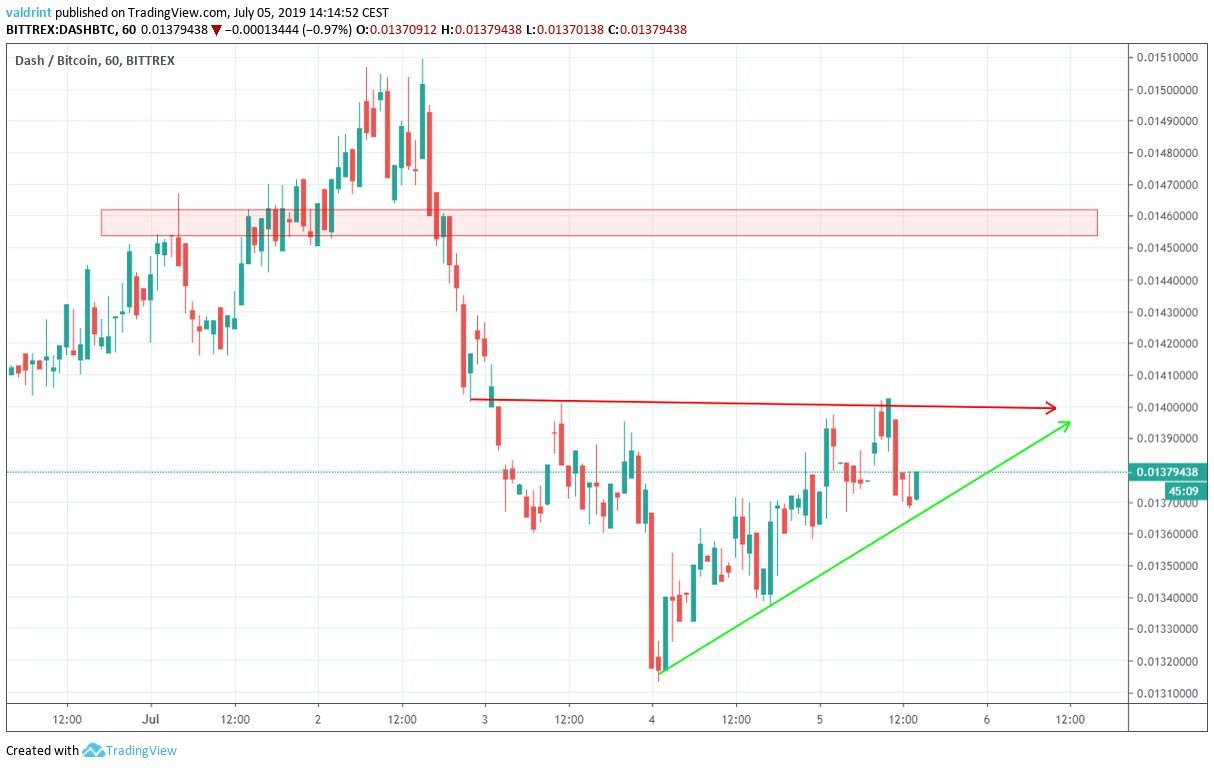
The closest resistance area was found near ₿0.0146.
If the DASH price breaks out of the triangle, it is likely to find short-term resistance.
Summary
The price of DASH is trading slightly above a very significant support area.
Both long and short-term indicators suggest that an upward move will occur soon.
Do you think the DASH price will break out from the triangle? Let us know in the comments below.
Disclaimer: This article is not trading advice and should not be construed as such. Always consult a trained financial professional before investing in cryptocurrencies, as the market is particularly volatile.
Images are courtesy of Shutterstock, TradingView.


