

Dash (DASH) looks to be approaching the apex of its current pattern, making a decisive move outside this pattern crucial in determining the future trend.
The DASH price has been decreasing alongside a descending resistance line since reaching $198.80 in May 2019. The slope of the line is not entirely clear due to the presence of many long upper wicks.
DASH Long-Term Levels
More recently, the price began an upward move in the period between March-Aug 2020. Currently, DASH is approaching the $61 support level, which is the 0.618 Fib level of the aforementioned upward move. If the area is successful in initiating a bounce and DASH begins to move upwards, the closest resistance level would be found at $86, coinciding with the descending resistance line.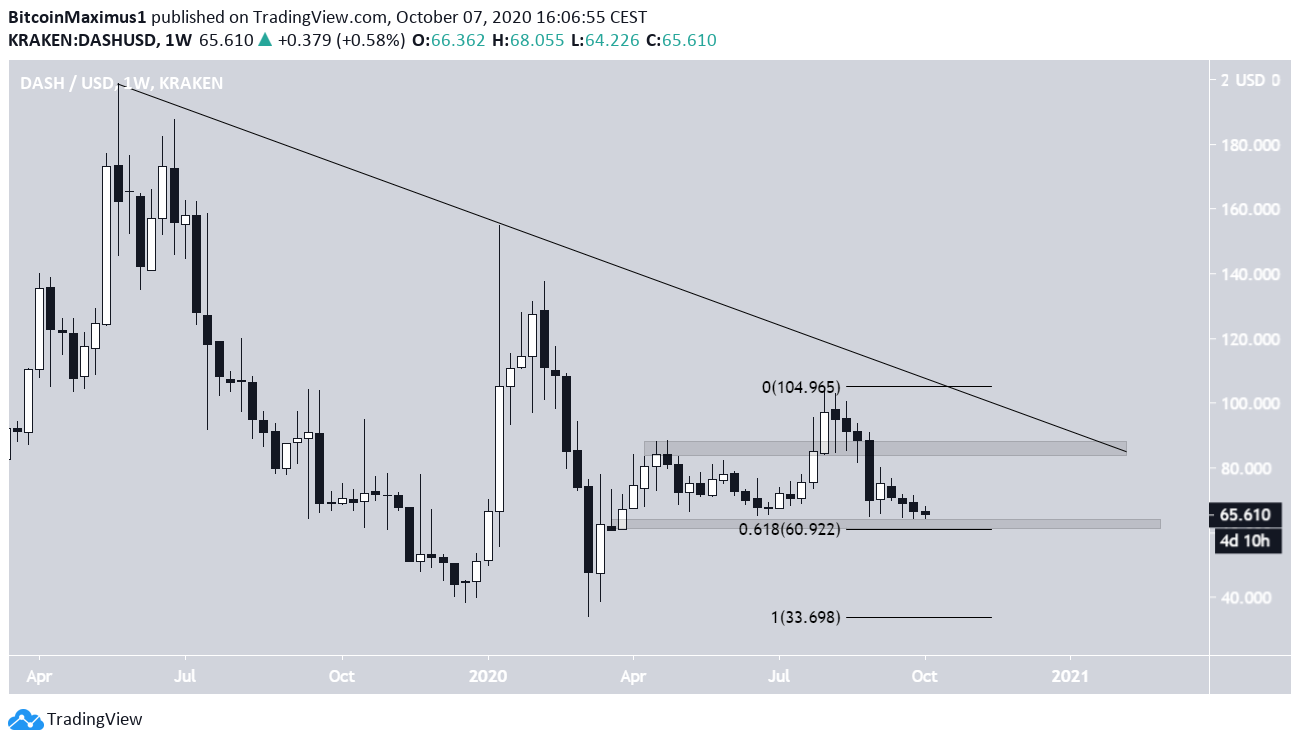
Lack Of Confirmation
The daily time-frame offers some signs of a possible bullish reversal, but do not confirm it. The strongest signal is given by the growing bullish divergence in the RSI. Furthermore, the MACD has also generated some bullish divergence and is increasing. However, the Stochastic Oscillator has made a bearish cross once again, casting some doubt on the bullish scenario.

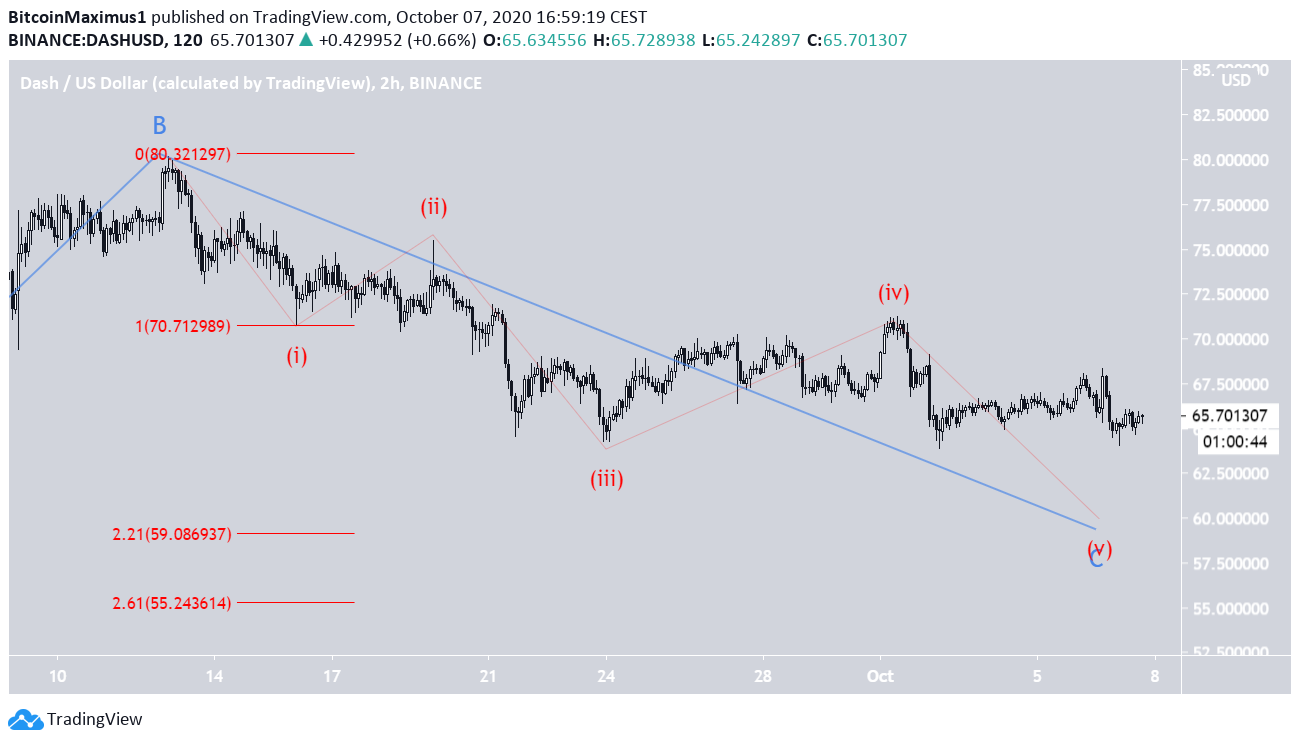
Wave Count
Cryptocurrency trader @Tradingsurfers outlined a DASH chart which shows a long-term wave count that shows two options, a bullish scenario towards new yearly highs and a bearish trend towards new yearly lows.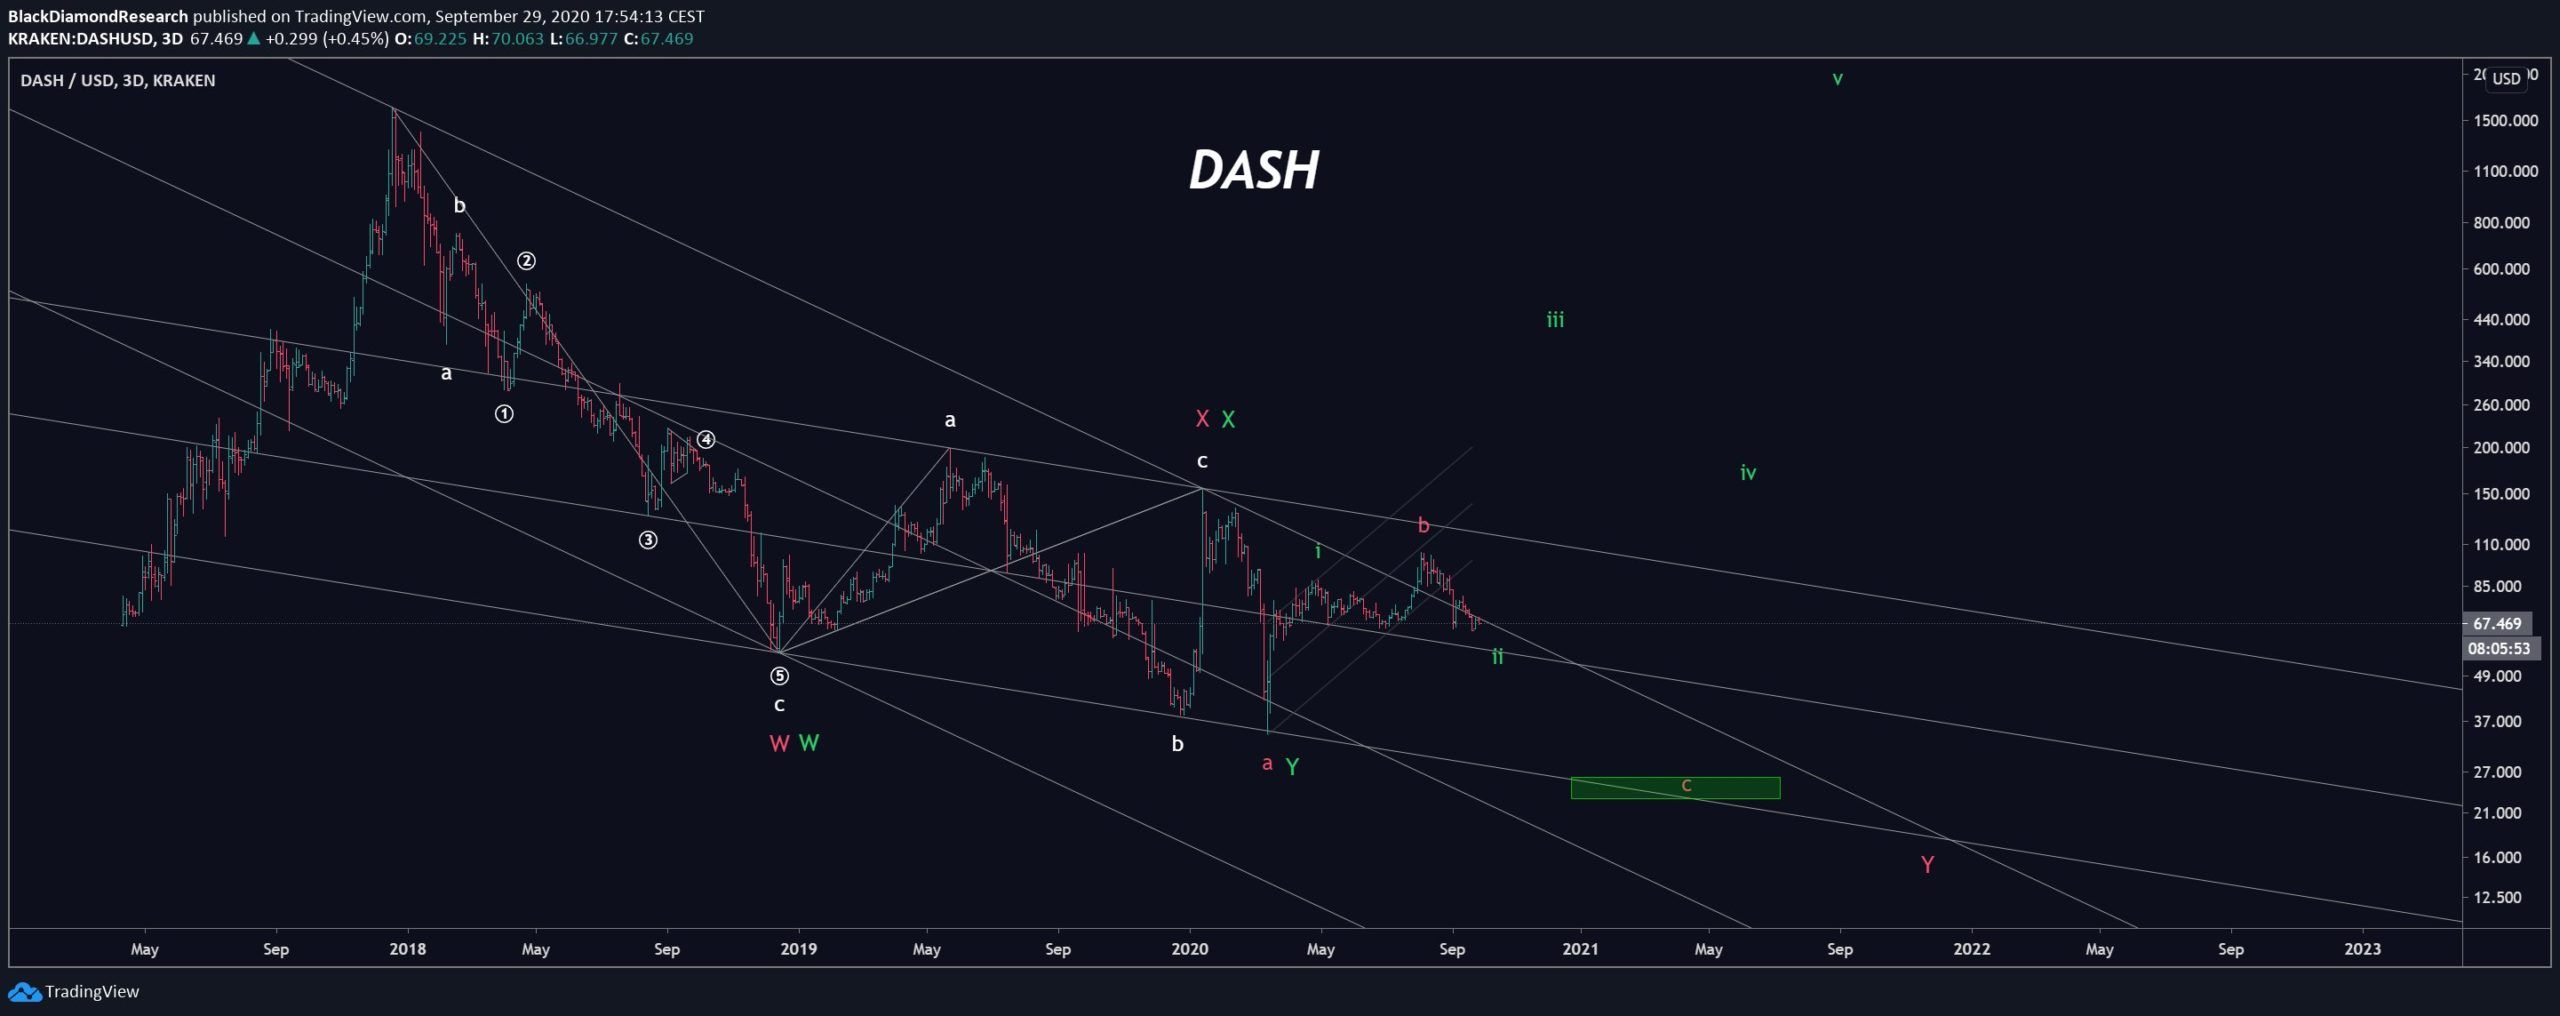
Disclaimer
In line with the Trust Project guidelines, this price analysis article is for informational purposes only and should not be considered financial or investment advice. BeInCrypto is committed to accurate, unbiased reporting, but market conditions are subject to change without notice. Always conduct your own research and consult with a professional before making any financial decisions. Please note that our Terms and Conditions, Privacy Policy, and Disclaimers have been updated.

Valdrin Tahiri
Valdrin discovered cryptocurrencies while he was getting his MSc in Financial Markets from the Barcelona School of Economics. Shortly after graduating, he began writing for several different cryptocurrency related websites as a freelancer before eventually taking on the role of BeInCrypto's Senior Analyst.
(I do not have a discord and will not contact you first there. Beware of scammers)
READ FULL BIO
Sponsored
Sponsored