

The DASH (DASH) price is attempting to break out from a descending resistance line that has been in place since the beginning of the year.
After a possible short-term drop, the price is expected to be successful in breaking out.
Long-Term DASH Support
In December 2019, the DASH price reached a low of ₿0.0053. This put the price well inside a significant support area that had previously not been touched since the end of 2015. After generating considerable bullish divergence in the weekly RSI, the price promptly initiated an upward move, increasing by 200% in order to reach a high of ₿0.016, but has been correcting since. At the time of writing, the price was trading only slightly above the ₿0.0072 support area.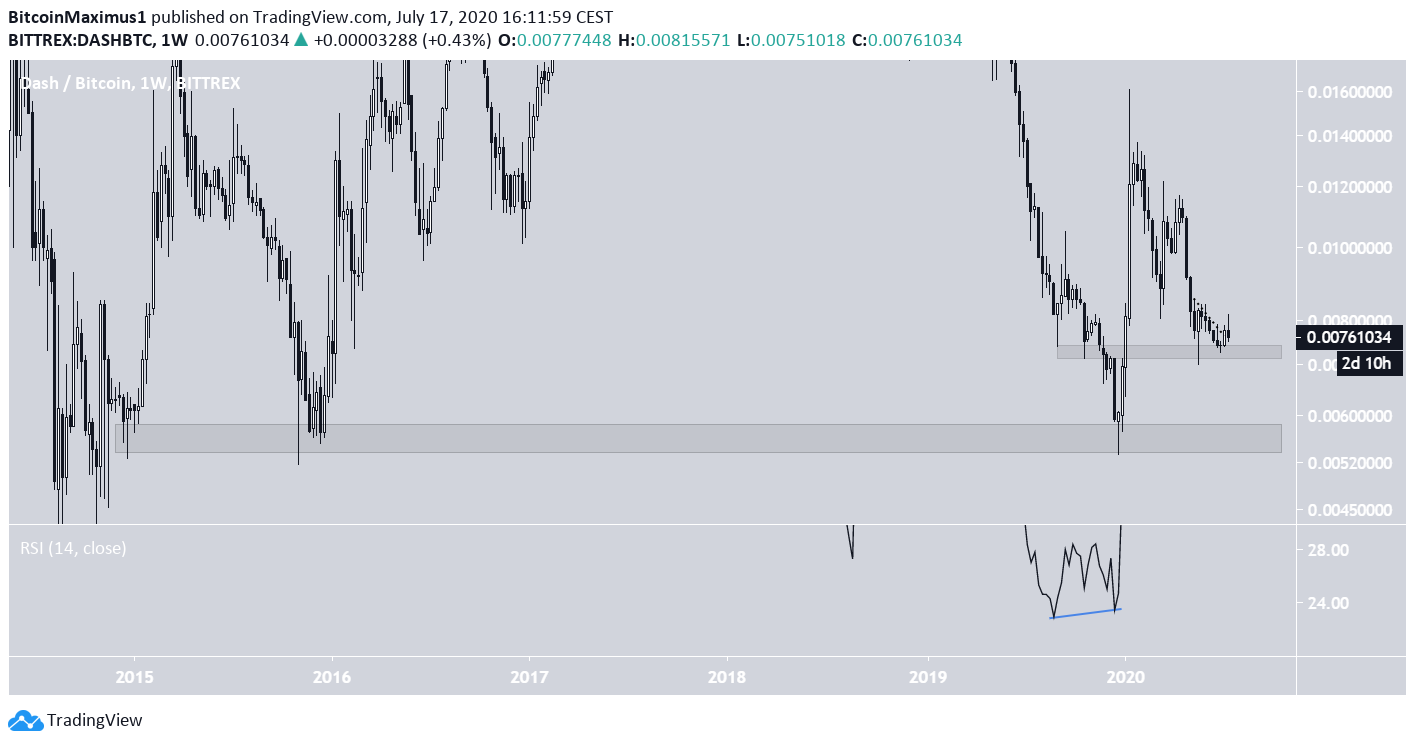
Descending Resistance
The daily chart shows that DASH has been following a descending resistance line since the beginning of 2020. At the time of writing, the price was trading directly under this resistance line, validating it for the third time. The line also coincides with the 50-day moving average (MA), which has made a bearish cross along with the 200-day MA and both are adding to resistance. However, there is a significant bullish divergence developing in the daily RSI, indicating that the price could soon break out. If so, it would first face resistance from the 200-day MA at ₿0.0095, before reaching a major horizontal resistance area at ₿0.0198.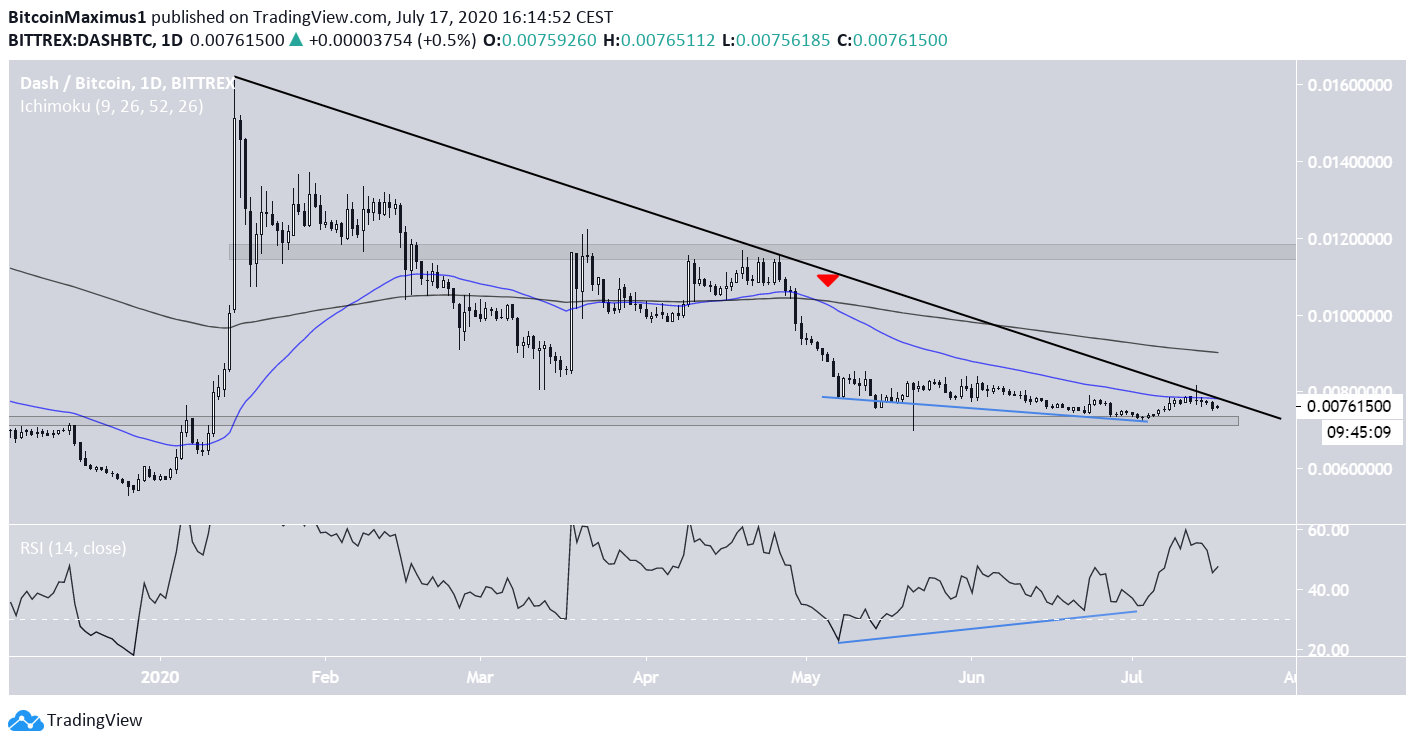
Short-Term Movement & Conclusion
In the short-term, the price has broken down from an ascending support line, suggesting that the short-term upward move has ended. The closest support area is found at ₿0.0074, the 0.786 Fib level of the entire move. A decrease towards this area, or the previously mentioned ₿0.0072 level, would cause a short-term double-bottom. After this, the DASH price is expected to move upwards.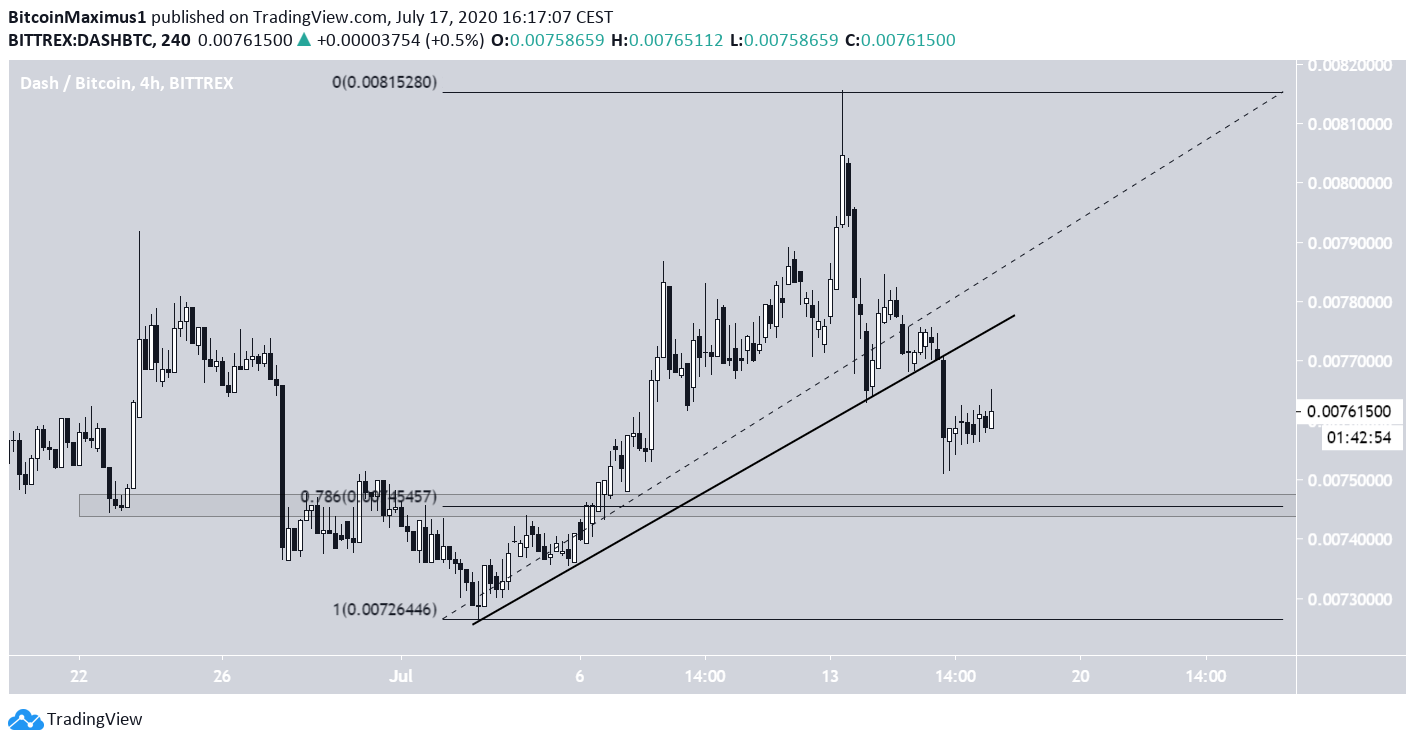
Top crypto platforms in the US
Disclaimer
In line with the Trust Project guidelines, this price analysis article is for informational purposes only and should not be considered financial or investment advice. BeInCrypto is committed to accurate, unbiased reporting, but market conditions are subject to change without notice. Always conduct your own research and consult with a professional before making any financial decisions. Please note that our Terms and Conditions, Privacy Policy, and Disclaimers have been updated.

Valdrin Tahiri
Valdrin discovered cryptocurrencies while he was getting his MSc in Financial Markets from the Barcelona School of Economics. Shortly after graduating, he began writing for several different cryptocurrency related websites as a freelancer before eventually taking on the role of BeInCrypto's Senior Analyst.
(I do not have a discord and will not contact you first there. Beware of scammers)
READ FULL BIO
Sponsored
Sponsored