


Curve DAO Token (CRV) has had fairly neutral price action since the beginning of Feb, but is trading above a crucial support level.
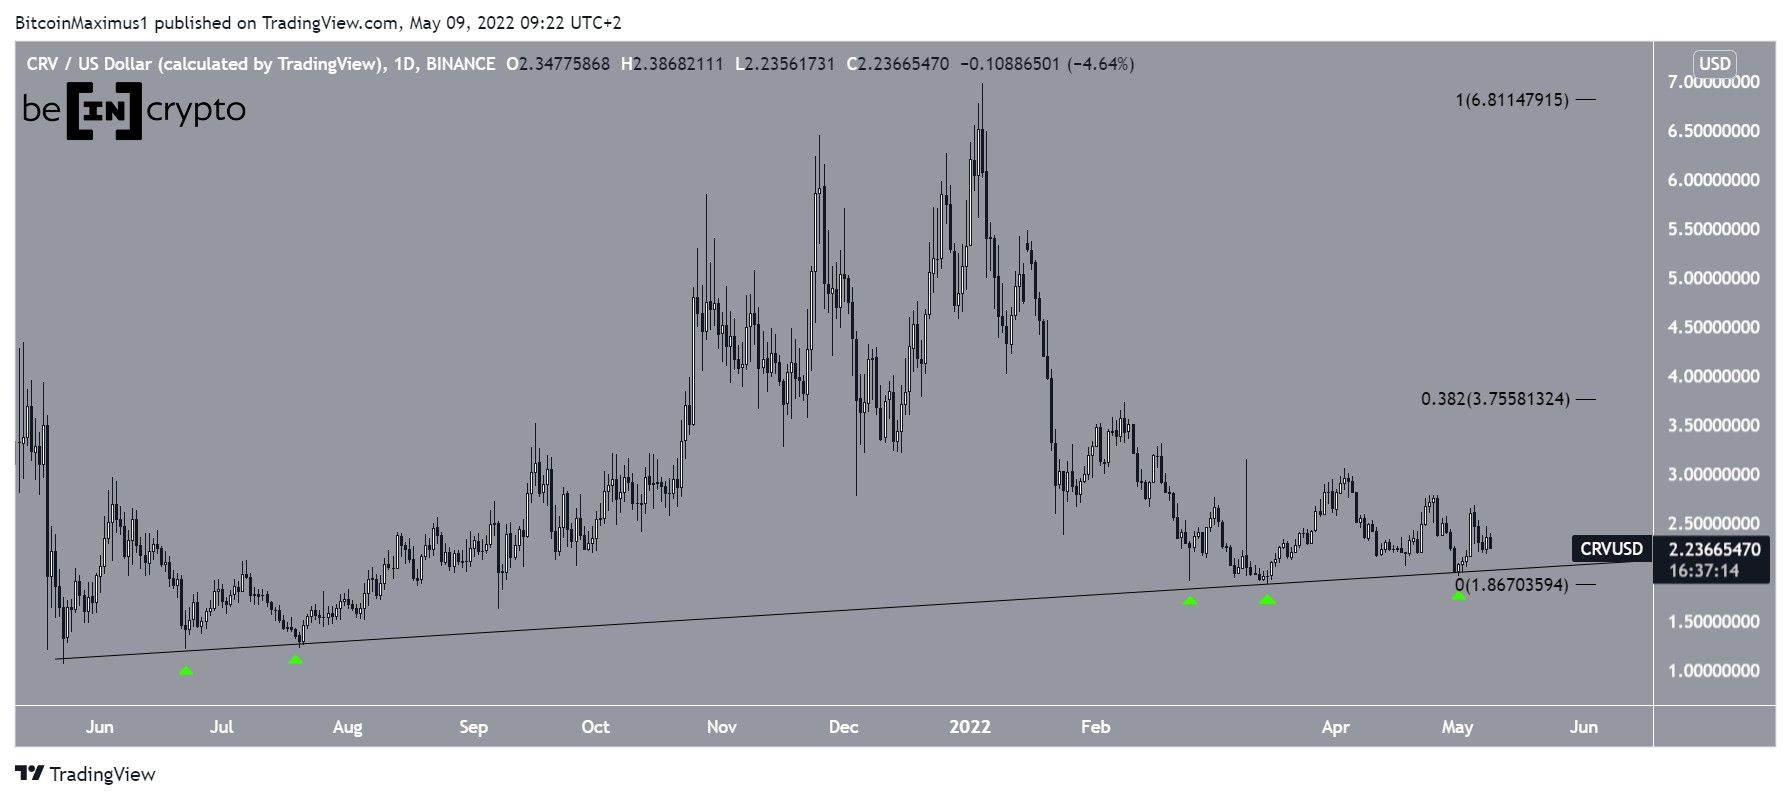
CRV has been increasing alongside an ascending support line since May 2021. The line has been validated five times (green icons) so far.
In July 2021, the price bounced above this line and initiated a sharp upward movement that eventually led to the $6.98 all-time high price in Jan 2022.
CRV has been falling since and has bounced at the long-term ascending support line thrice more since Feb 2022.
Despite the bounces, the price has failed to initiate any sort of upward movement. If one were to occur, the closest resistance area is at $3.75. This is the 0.382 Fib retracement resistance level when measuring the entire decrease.
Future CRV movement
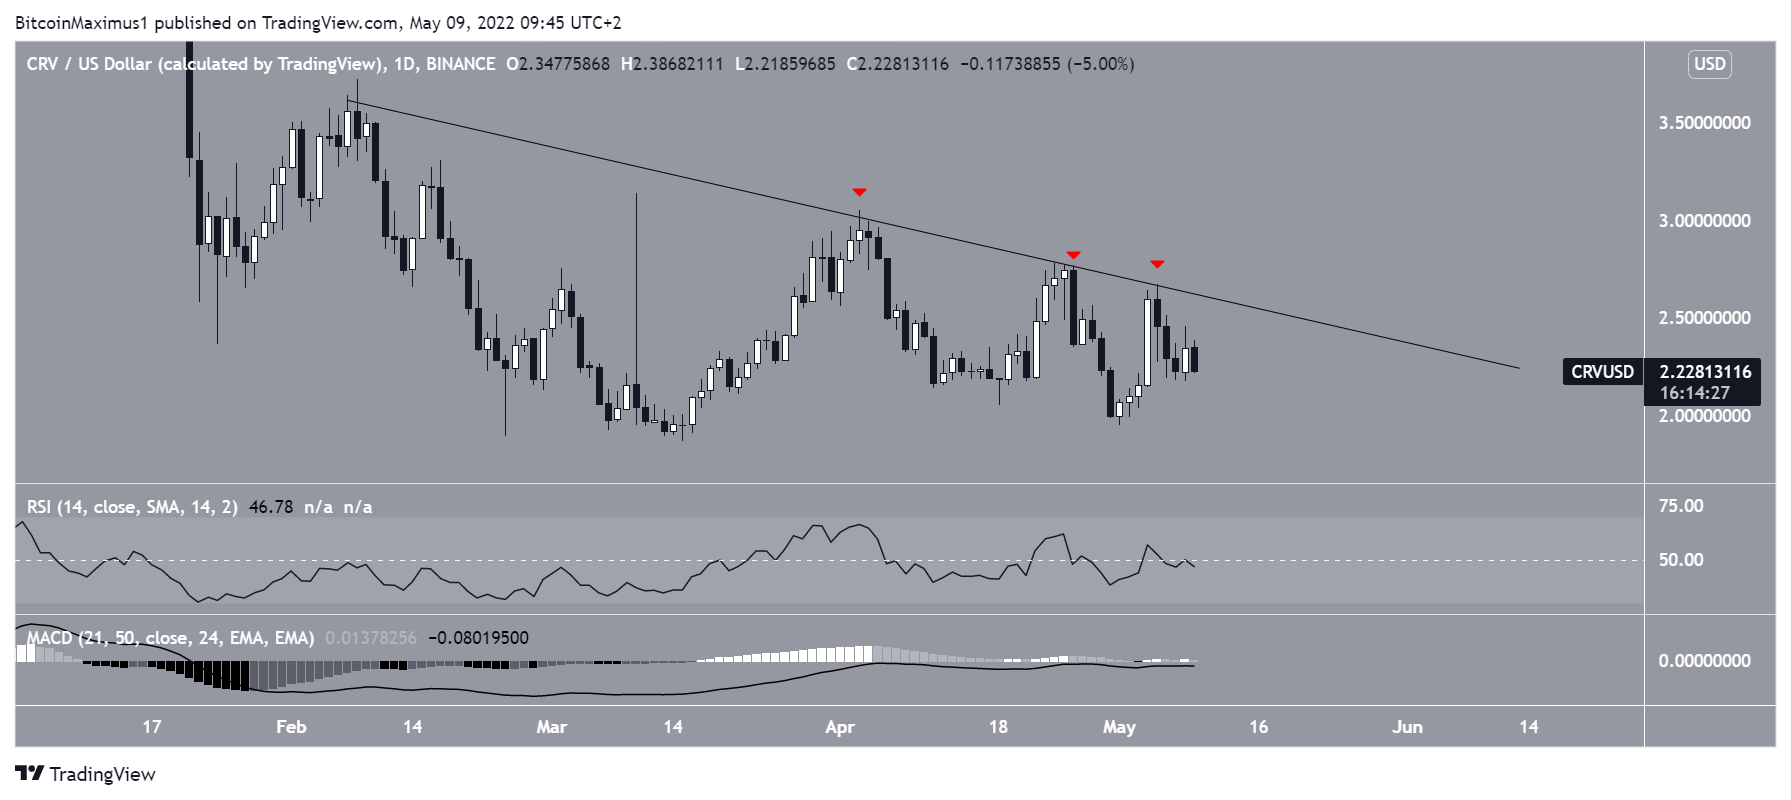
The daily chart shows that CRV has been falling underneath a descending resistance line since Feb 8. The line has caused three rejections so far, the most recent one being on May 5.
Neither the RSI nor MACD provide a hint as to the direction of the trend. The former is right at the 50 line while the latter is at 0, both of which are considered signs of a neutral trend.
Therefore, it fails to provide any insight as to whether CRV will break out.
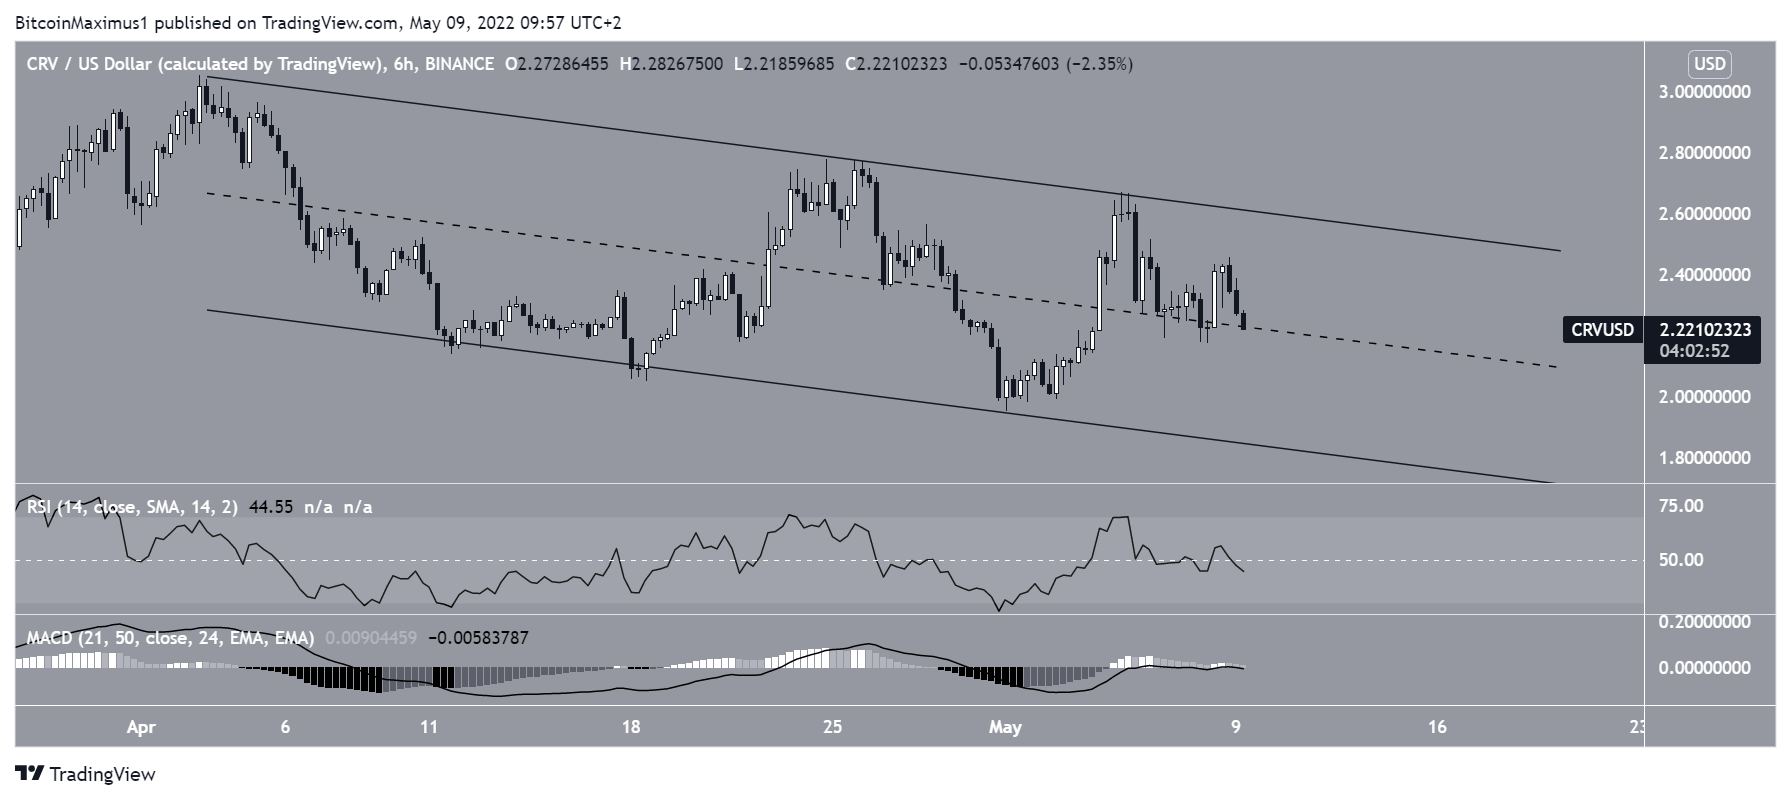
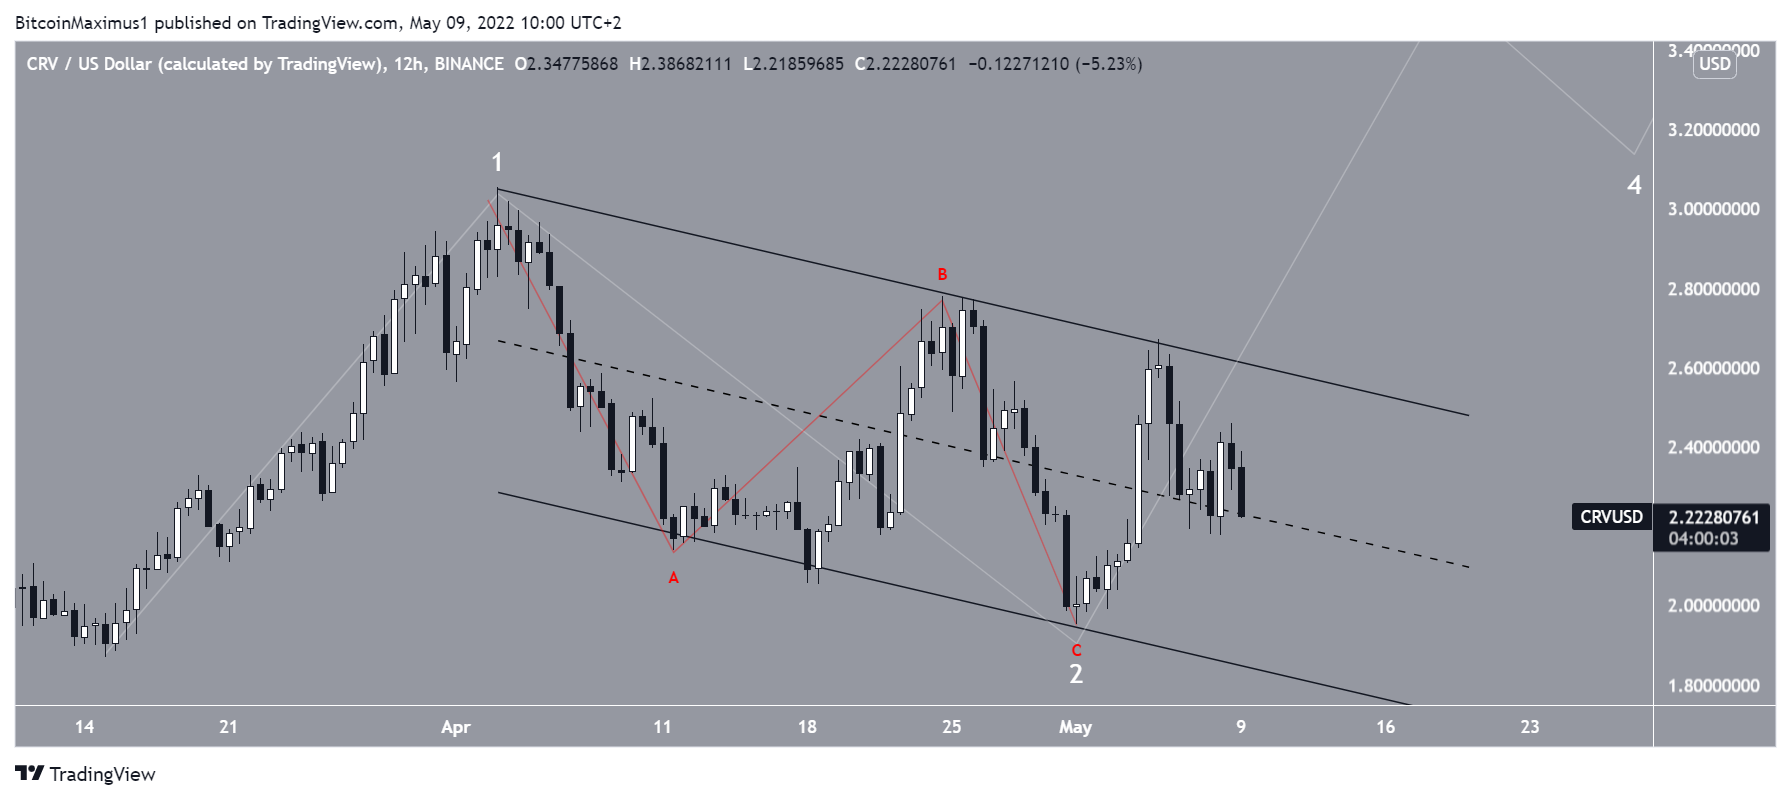
The six-hour chat shows that CRV has been decreasing inside a descending parallel channel since the beginning of April.
Such channels usually contain corrective movements, meaning that a breakout from them would be likely. However, the price is currently losing the middle of the channel, which was expected to provide support.
Additionally, similarly to the daily time frame, the RSI and MACD provide a neutral reading.
Wave count analysis
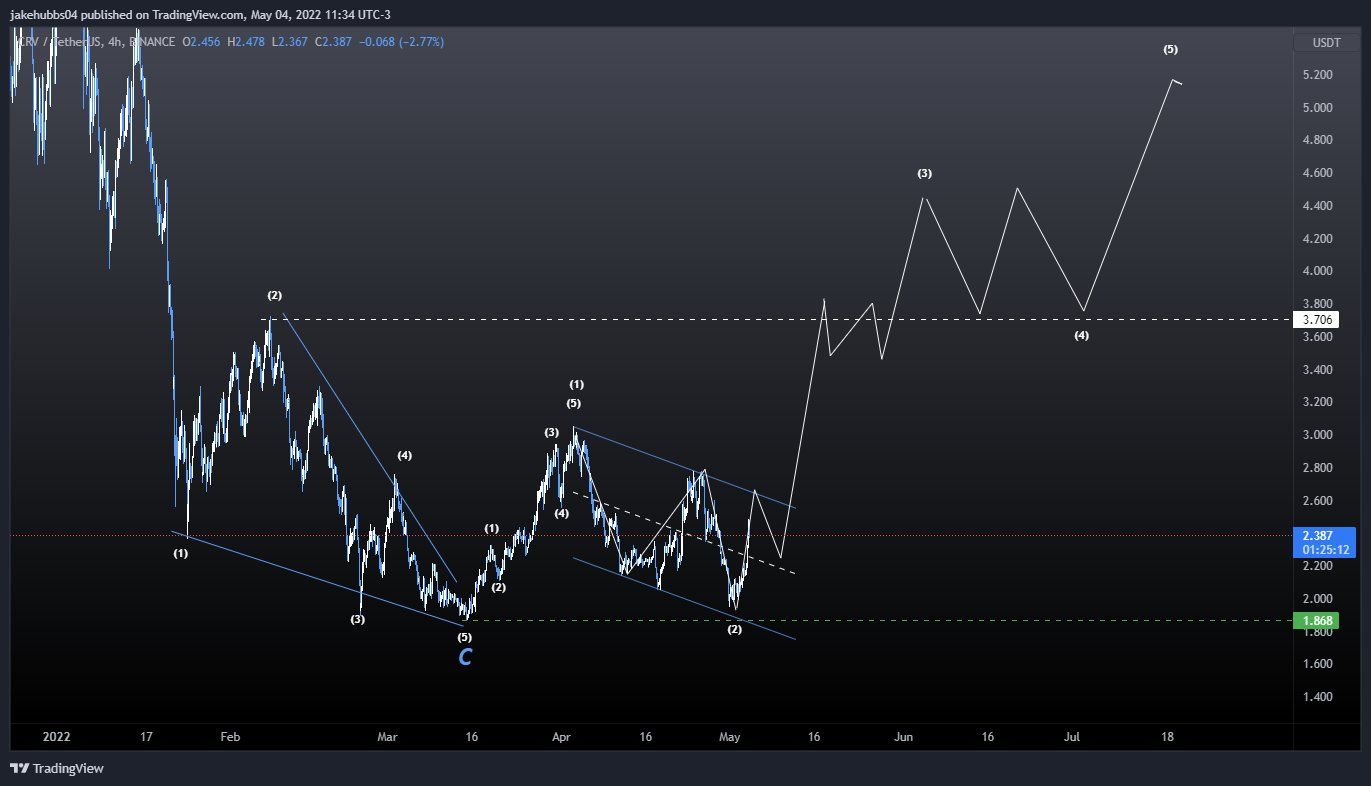
Cryptocurrency trader @TheTradingHubb tweeted a chart of CRV, stating that the price might have begun a new bullish impulse that could take it above $4.
As seen previously, neither the price action nor technical readings seem bullish. Despite this fact, the wave count provides some hope for a bullish scenario.
It is possible that CRV began a five-wave upward movement (white) on March 15. In this case, the ensuing decrease that has been contained inside the parallel channel is part of a corrective wave two.
A breakout from the channel would confirm the count while a decrease below the March 15 low of $1.86 would invalidate this particular wave count.
For Be[in]Crypto’s previous Bitcoin (BTC) analysis, click here


