
Curve DAO Token (CRV) is showing bullish price action despite the ambiguity in technical indicator readings.
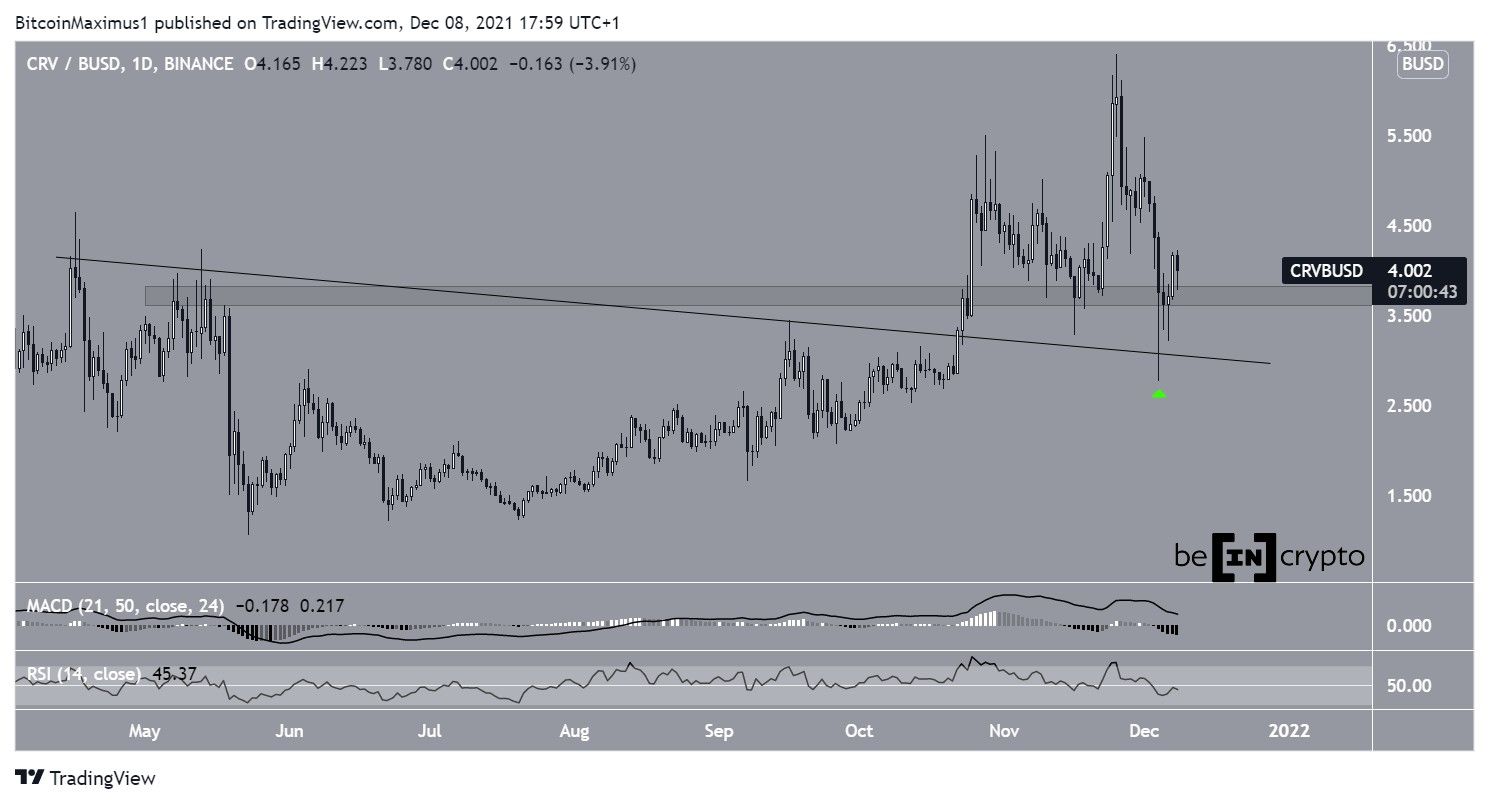
CRV has been falling since Nov 25 after reaching an all-time high price of $6.40. The decrease was sharp and led to a low of $2.77 on Dec 4.
Despite the drop, CRV bounced considerably the same day and created a long lower wick in the process (green icon). This is considered a sign of buying pressure.
The bounce validated the previous descending resistance line and the upward movement allowed CRV to reclaim the $3.75 horizontal area, which is expected to act as support once again.
Due to the lack of a daily close below this area, the wick breakdown can be discounted.
Despite the bullish price action, technical indicators are relatively neutral.
The MACD, which is created by short and long-term moving averages (MA), is decreasing, even though it’s still positive.
The RSI, which is a momentum indicator, is right at the 50-line. This is considered a sign of a neutral trend since movements above/below this line are indicative of a bullish/bearish signal.
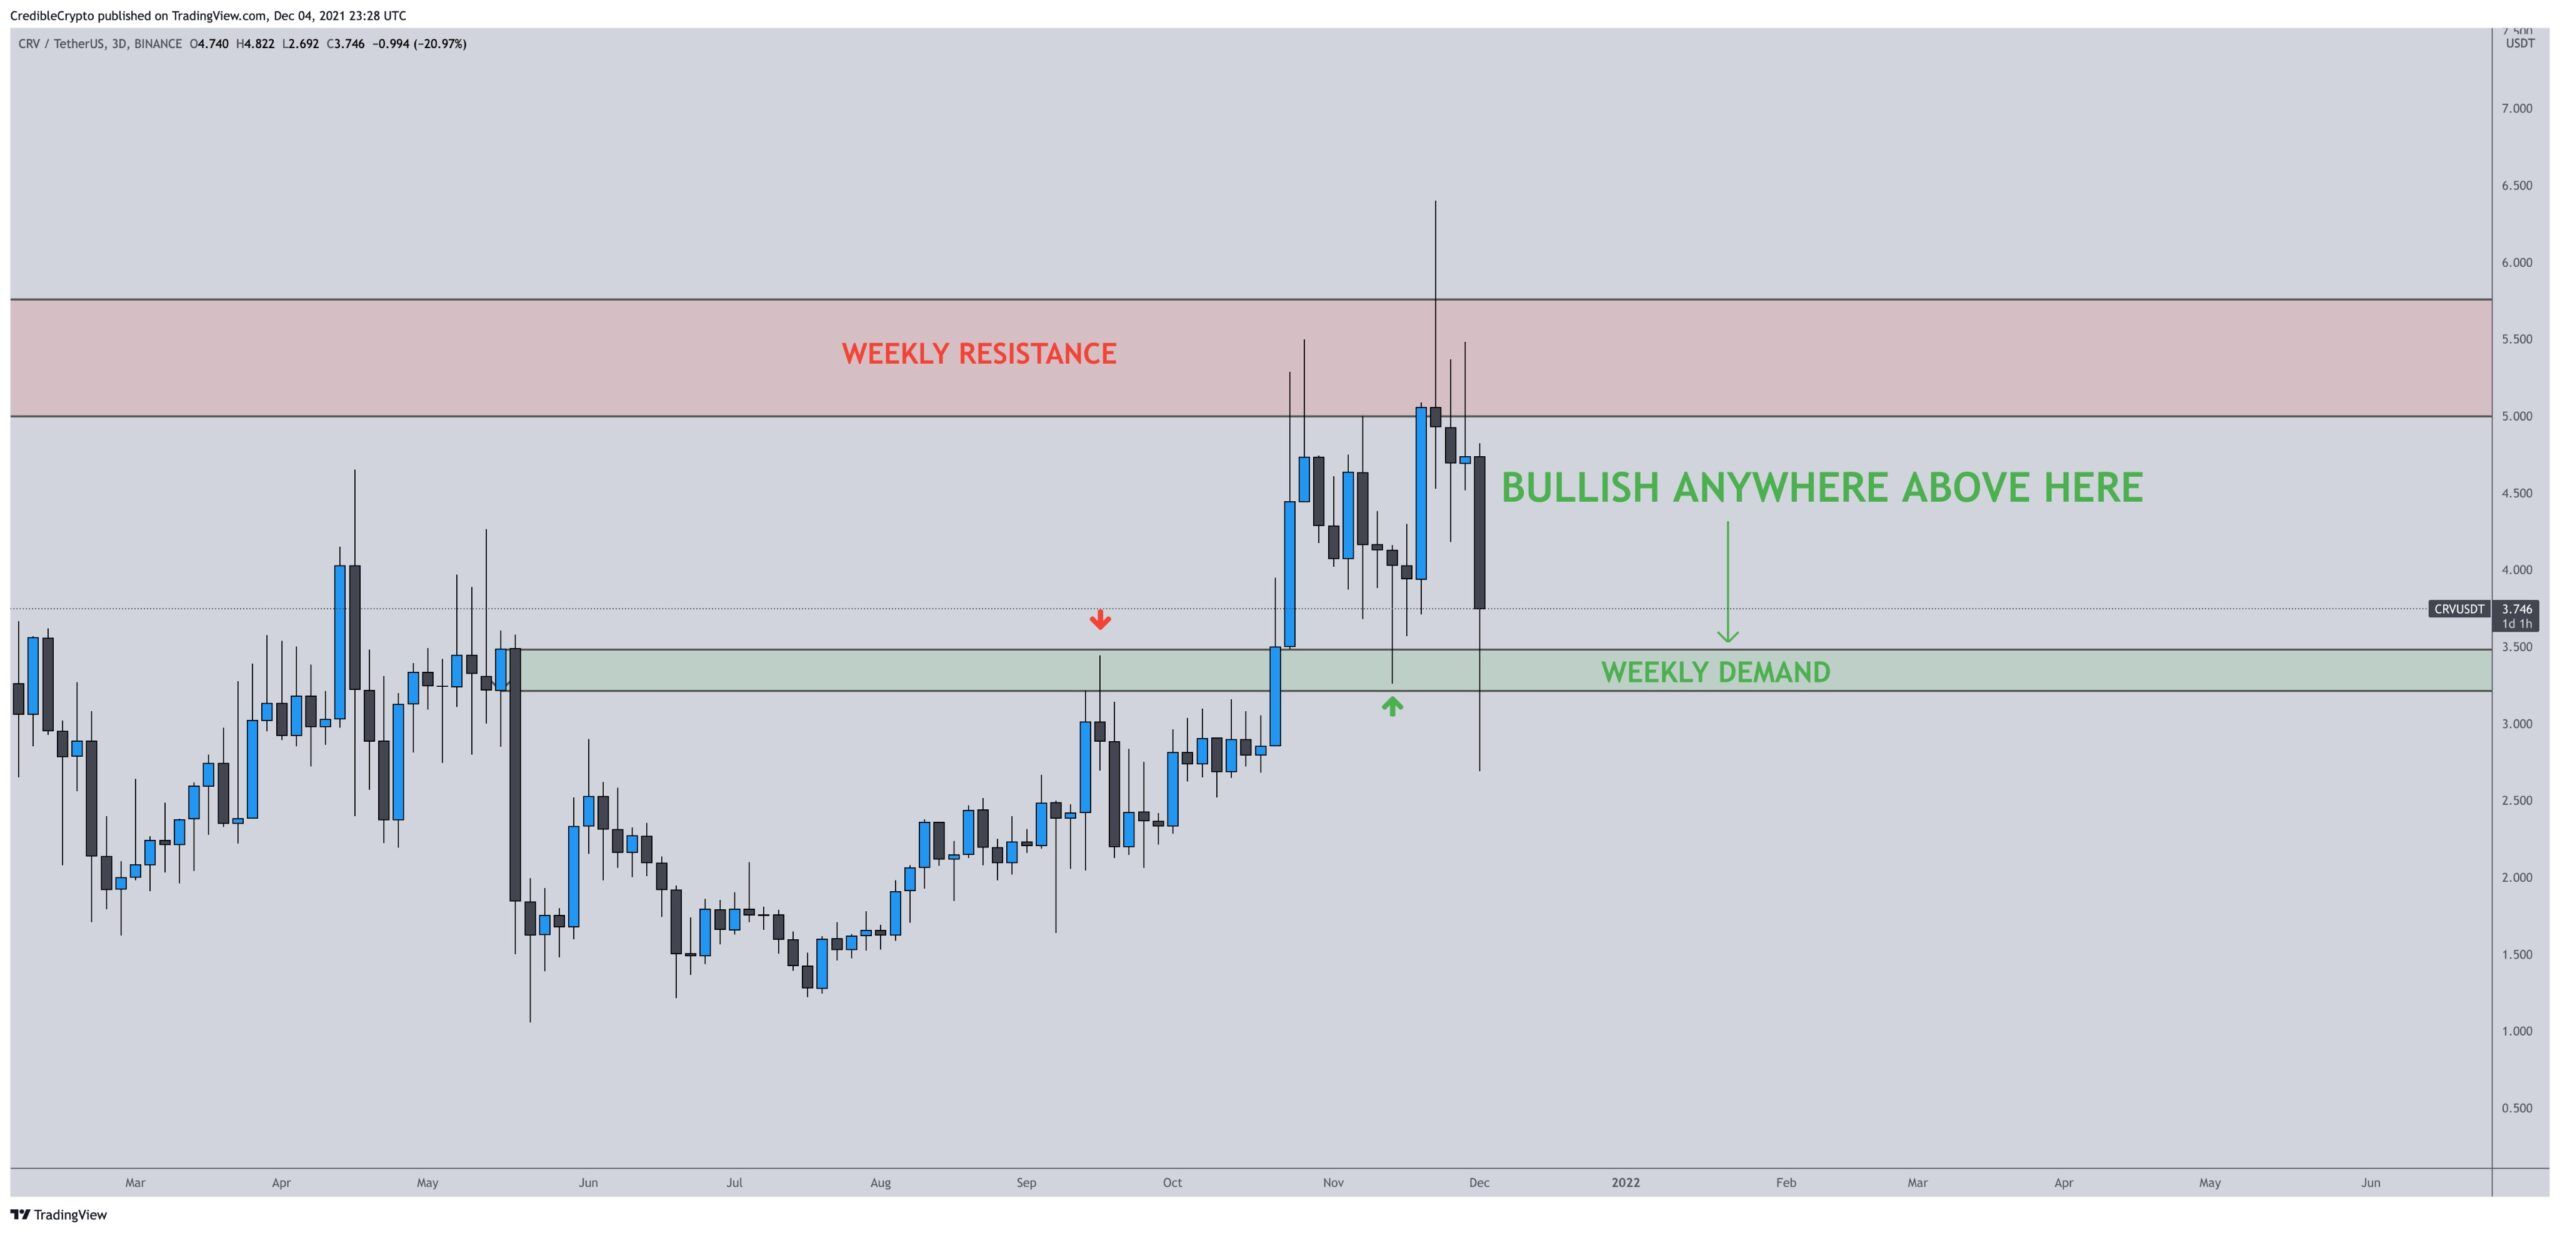
Cryptocurrency trader @Crediblecrypto outlined a CRV chart, stating that the price action is bullish as long as it’s trading above the $3.75 horizontal area. This aligns with the outlook from the daily time frame.
Short-term CRV bounce
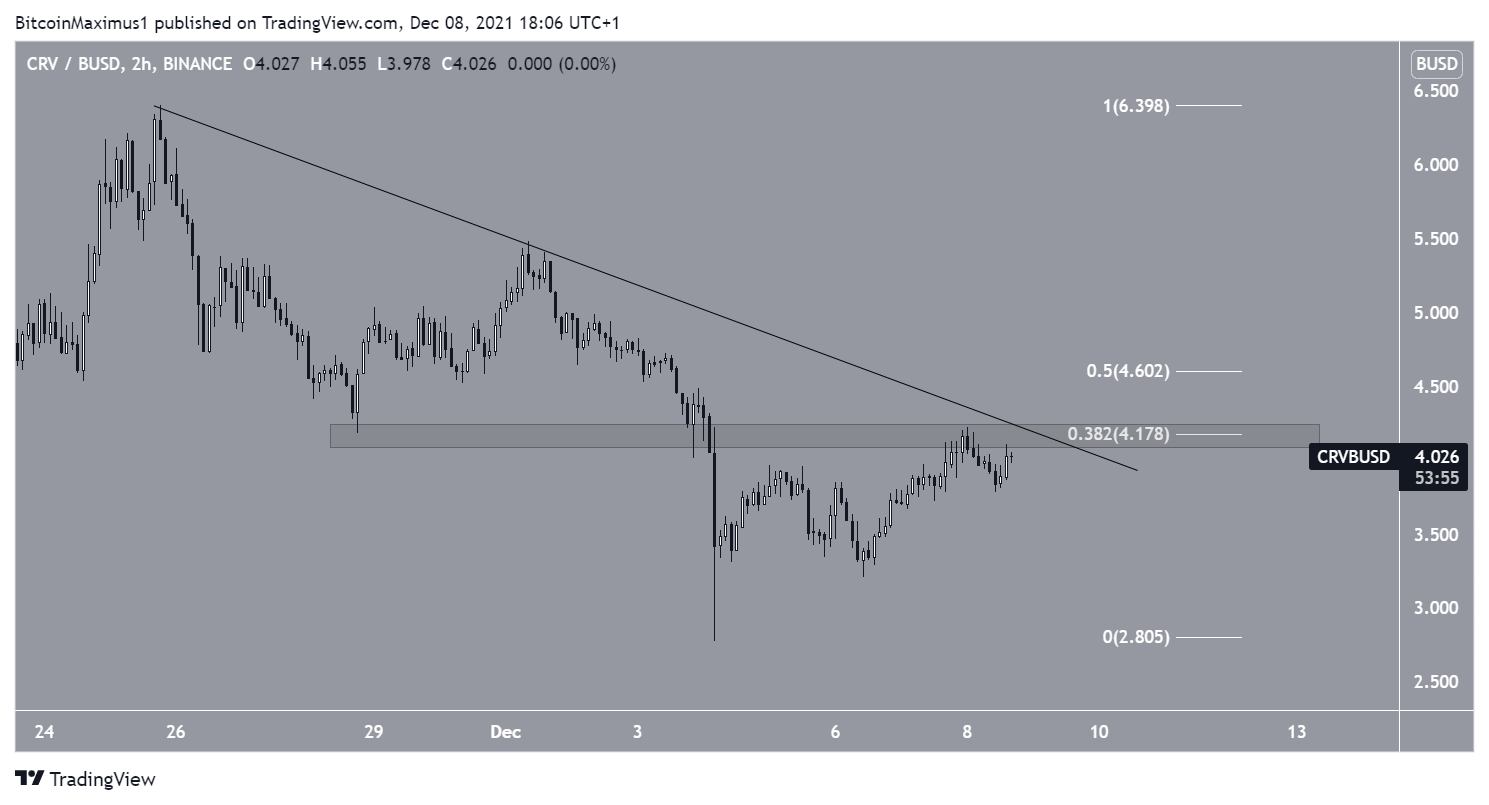
The two-hour chart shows that CRV has been decreasing underneath a descending resistance line since the aforementioned Nov 25 all-time high price.
The line also coincides with the $4.18 resistance, which is both a horizontal resistance area and the 0.382 Fib retracement resistance level.
Therefore, until CRV breaks out above this line, the short-term bullish trend reversal cannot be confirmed.
For BeInCrypto’s latest Bitcoin (BTC) analysis, click here.
