


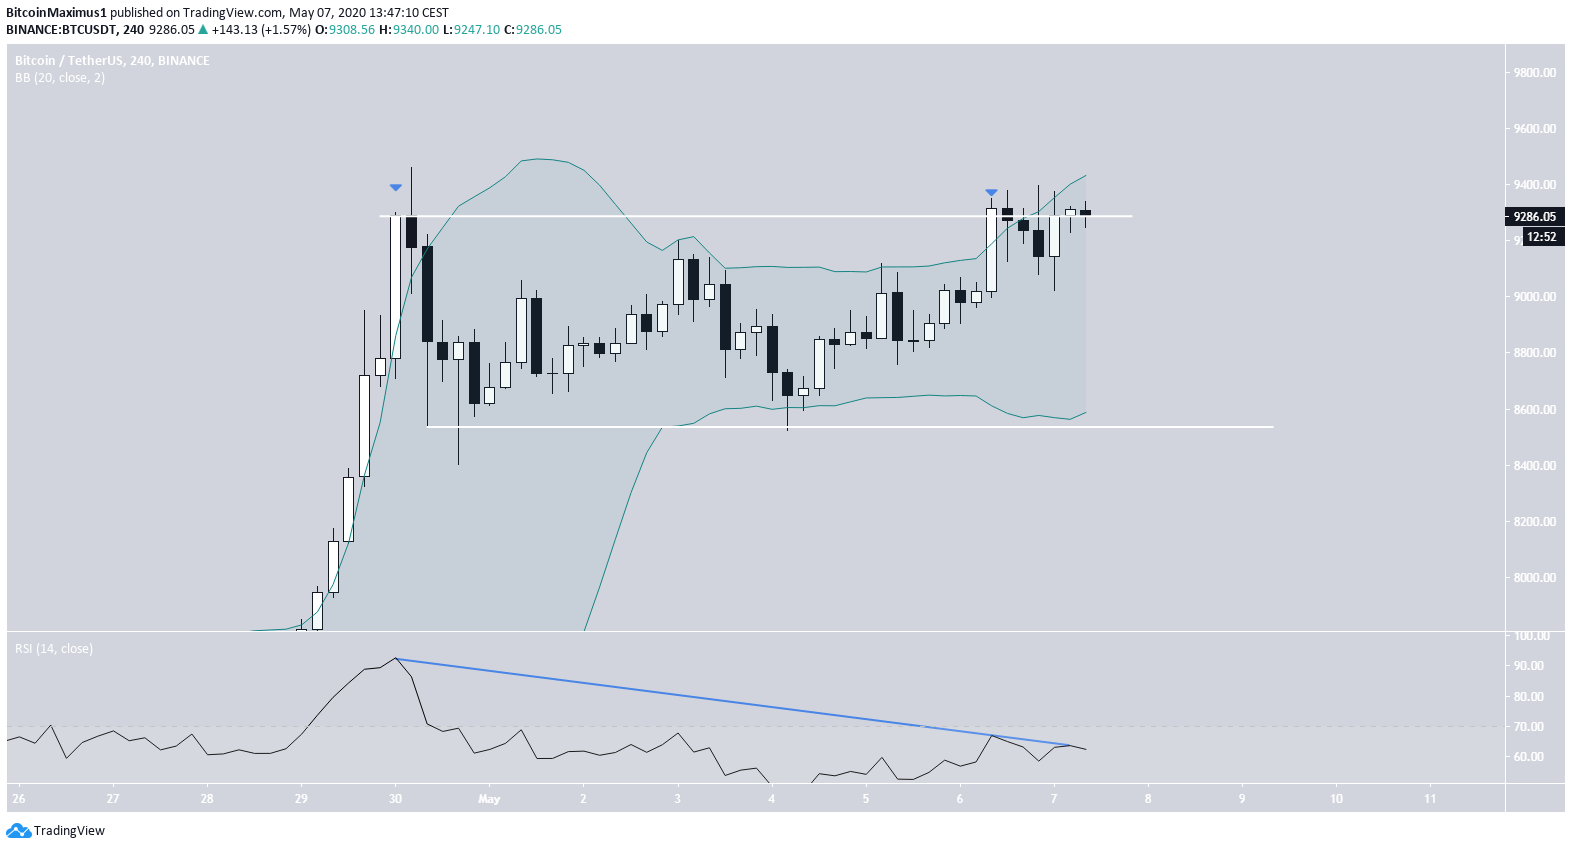
The Bitcoin price has possibly created a double top relative to its April 30 high.
Each time 210,000 blocks are mined, the block reward for mining is cut in half. The upcoming event, the third Bitcoin halving, is now quickly approaching since fewer than 1,000 blocks are left until the 630,000 block milestone is reached. If the current block creation rate is maintained, the next halving should be on May 11-12. This has sparked interest in Bitcoin, as evidenced by the all-time high open interest on the Bitcoin futures platform.
In this article, we will take a closer look at the Bitcoin price movement along with nine other cryptocurrencies and determine their future outlook.
Bitcoin (BTC)
The Bitcoin price is trading at a significant resistance area near the April 30 high at $9,400. This has possibly created a double top, which is known as a bearish reversal pattern. In addition, the pattern is combined with bearish divergence in the RSI.
The upward move has overextended, causing a price increase above the upper Bollinger band. While this is not uncommon in upward trends, when combined with the divergence it increases the possibility of a reversal, at least towards the middle of the range. This is also supported by the failure to sustain prices higher than $9,300, which has created long upper wicks.
Therefore, the price is expected to decrease towards the horizontal support line at $8,400.
Ethereum (ETH)
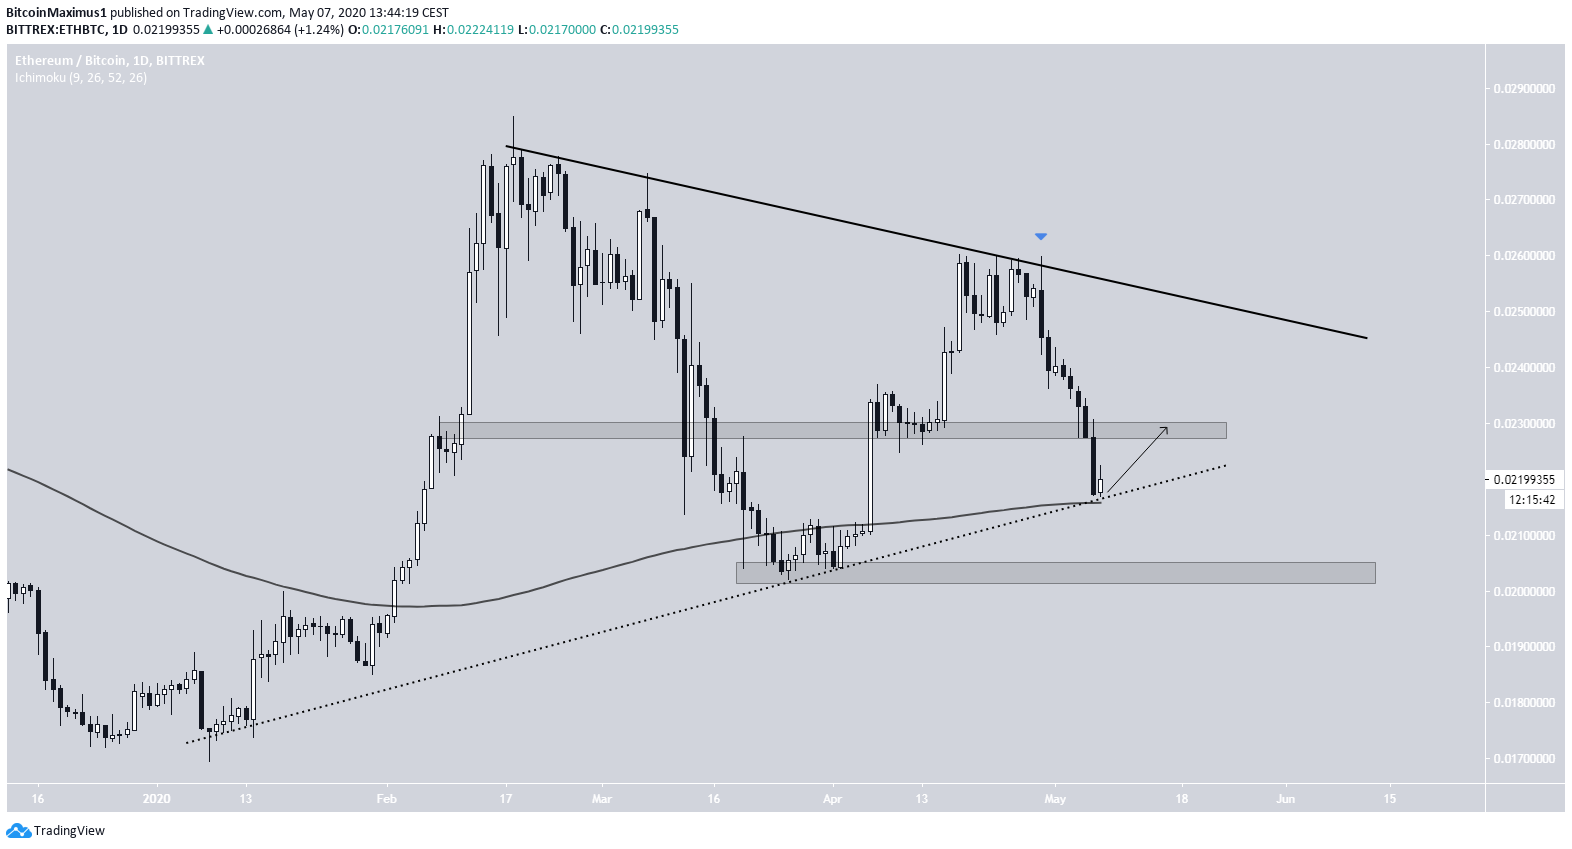
The Ethereum price has been decreasing since reaching a high of ₿0.0259 on April 29. This high was used to generate a descending resistance line, which is currently near ₿0.025. The decrease has been swift, and the price has fallen below the 0.0228 support area, which is now likely to act as resistance.
However, the 200-day moving average (MA) and the possible ascending support line (dotted) are still providing support to the price. This could cause an upward move towards the aforementioned resistance area.
On the other hand, a breakdown below both the MA and the support line would likely cause a very sharp drop towards ₿0.021. This would be a sign with many bearish implications, possibly initiating a drop towards the ₿0.0175 area, where the upward move was initiated.
XRP (XRP)
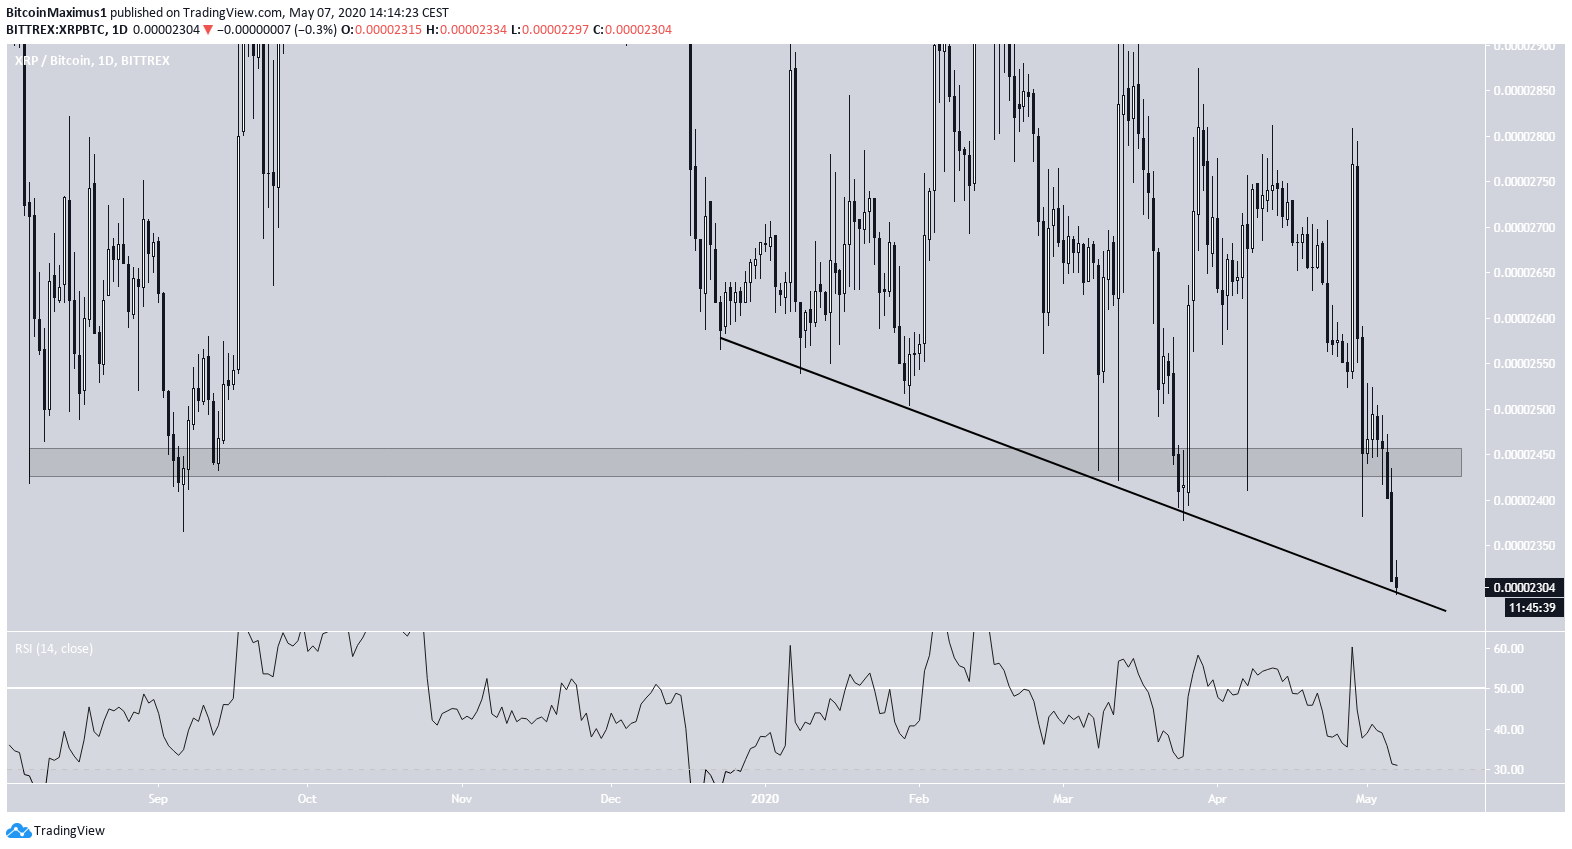
The XRP/BTC price has fallen to its lowest levels since December 2017. It has done this by decreasing below the 2,450 satoshi support area, which had been intact since August 2019. This area is likely to act as resistance in the future.
One a slightly bullish note, the price seems to be following a descending support line over the past six months. However, as there is no bullish divergence in the RSI nor a type of bullish reversal pattern, the support line could at most initiate an upward move to validate the aforementioned resistance area.
Nevertheless, as long as the XRP price does not flip the 2,450 area as support, its outlook will remain bearish.
Bitcoin Cash (BCH)
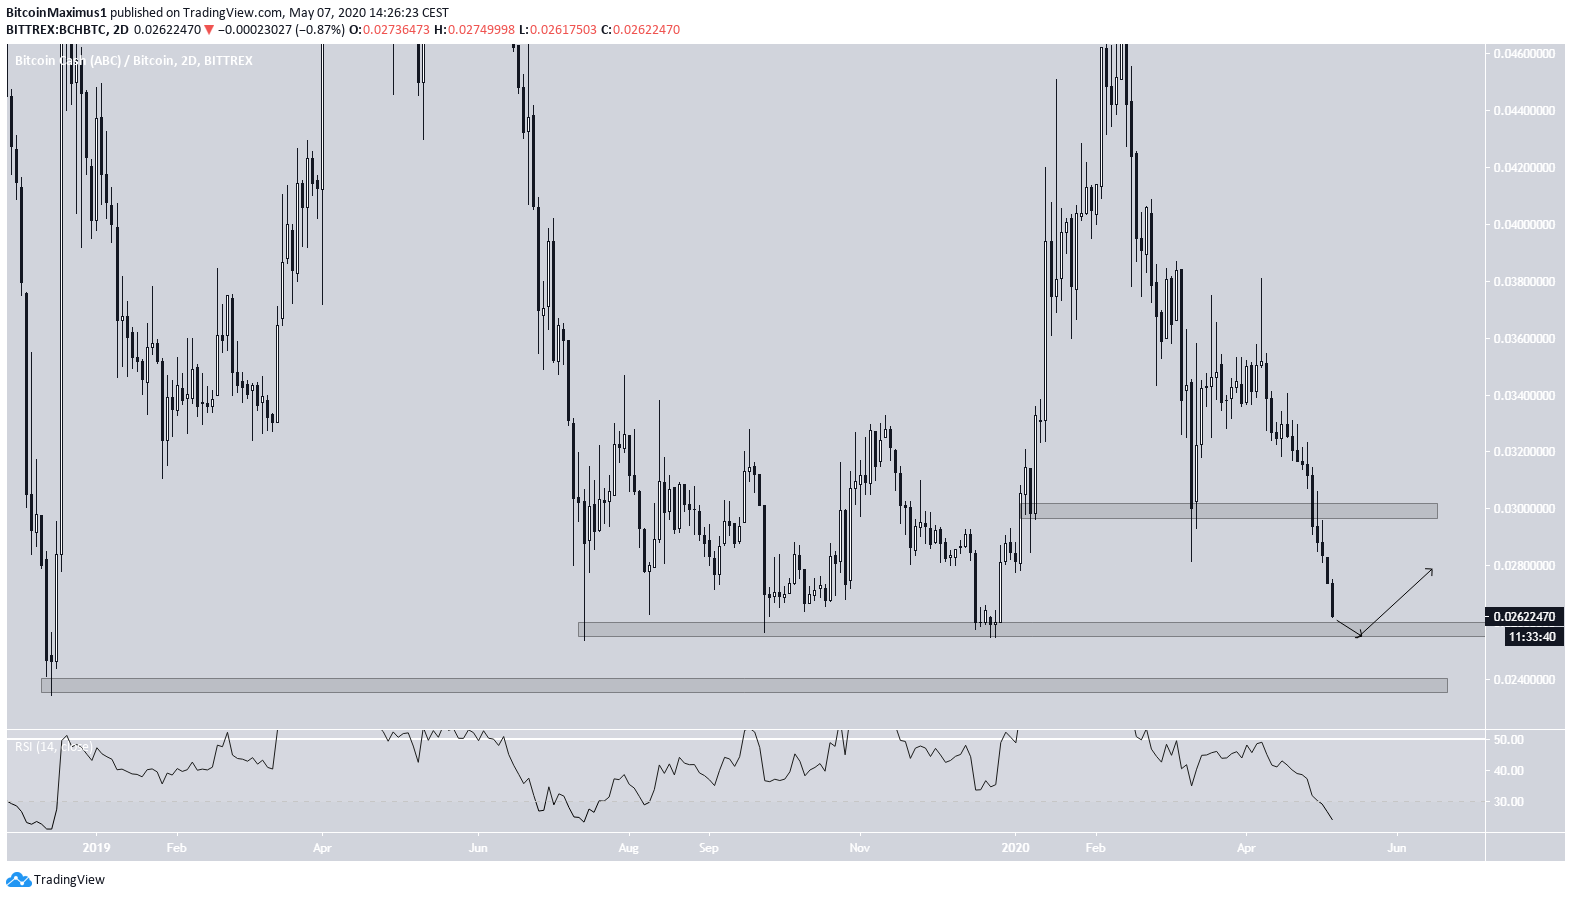
The BCH price has crashed below the ₿0.023 area and is rapidly approaching its 2019 lows, found at ₿0.0255.
While the RSI is oversold, it has not generated any type of bullish divergence. Therefore, while the ₿0.0255 support area could initiate a bounce, possibly towards the ₿0.023 area which is likely to act as resistance, BCH could possibly decrease towards its all-time low at ₿0.0234.
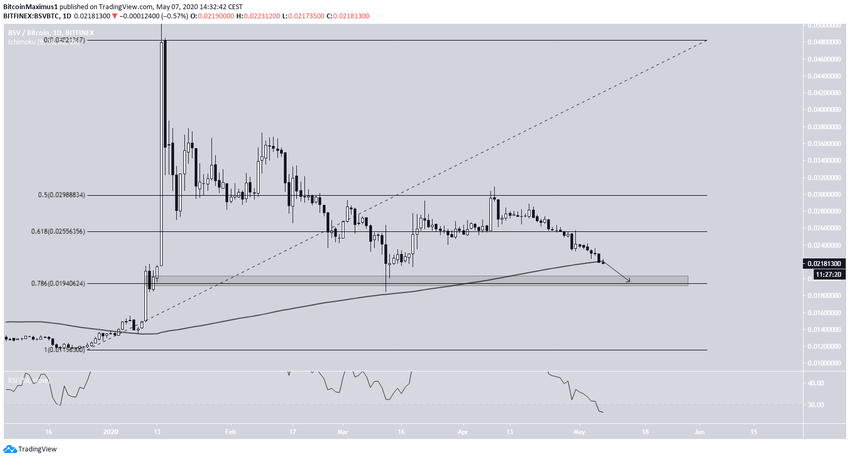
Bitcoin SV (BSV)
The BSV price has been gradually decreasing since reaching a high of ₿0.0208 on April 9, approaching the ₿0.0195-₿0.02 area, which is both a previous support level and the 0.786 Fib level of the entire upward move.
At the time of writing, the price was trading right above the 200-day MA, having done so since the upward move first became parabolic in January 2020. However, it looks as if it will decrease below it and reach the aforementioned support area.
At the current time, there are no signs of a reversal, such as a double bottom or bullish divergence in the RSI.
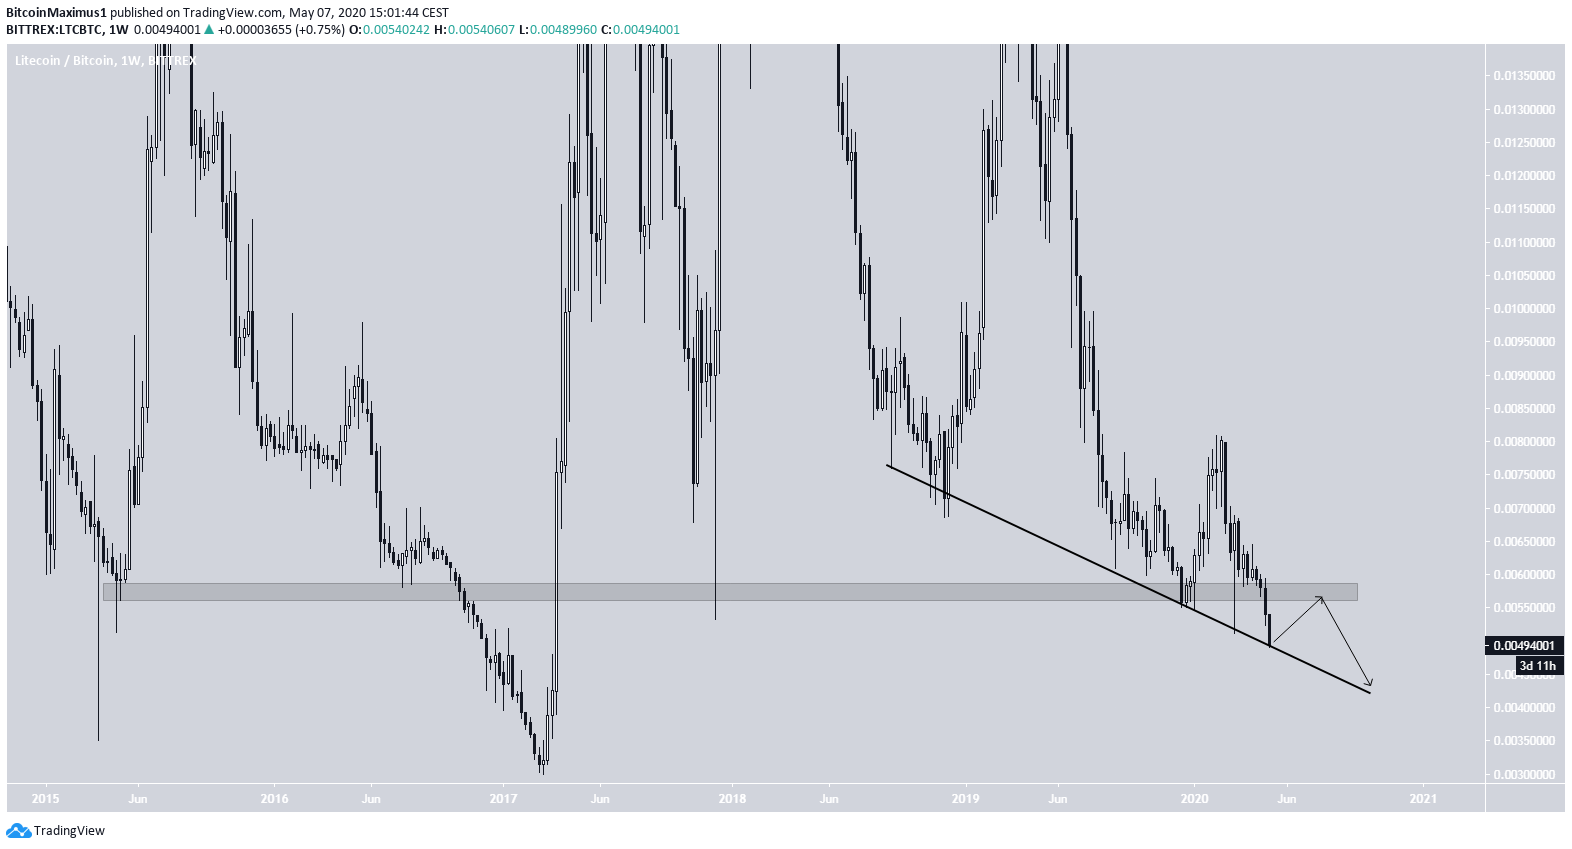
Litecoin (LTC)
The Litecoin price has decreased to its lowest levels since December 2017. In addition, it has fallen below the ₿0.057 area, which had previously initiated several upward moves.
On a slightly bullish note, the price has been following a descending support line since December 2018, one which has not yet been broken. This line could initiate an upward bounce, which would validate the aforementioned support area as resistance.
However, the future outlook for LTC looks bleak, unless the price is able to reclaim the ₿0.057 area as support.
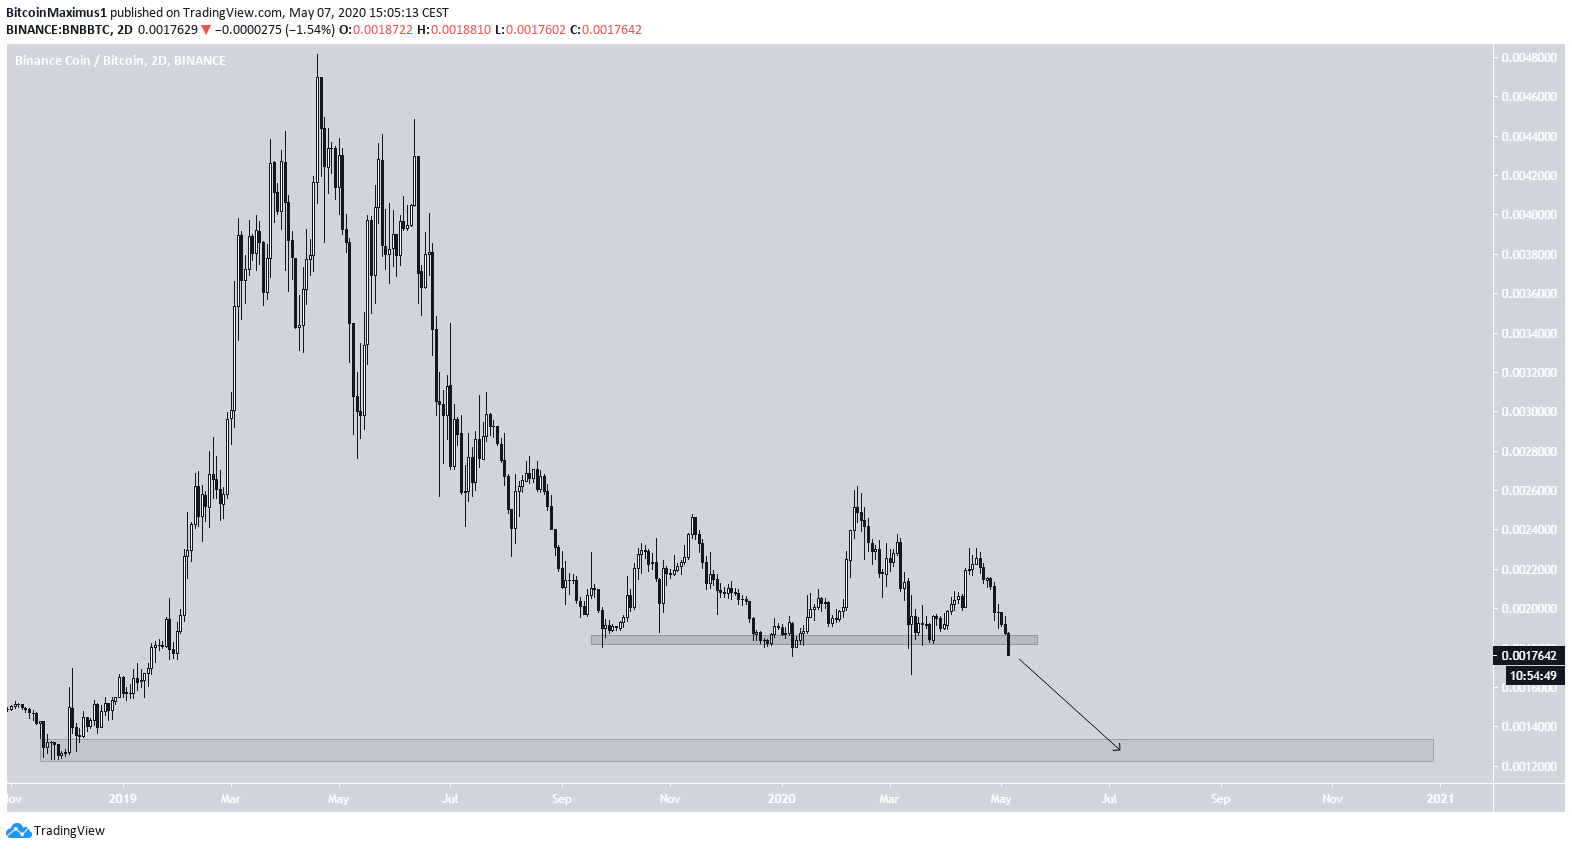
Binance Coin (BNB)
The Binance Coin (BNB) price is in the process of decreasing below its ₿0.00185 support area. The price has not traded below this level since September 2019.
A breakdown below such a significant support area could trigger a very rapid price decrease and act as resistance afterward.
If the decrease continues, since there are no signs to the contrary, BNB could reach the ₿0.00137 support area, inside which it has not traded since December 2018.
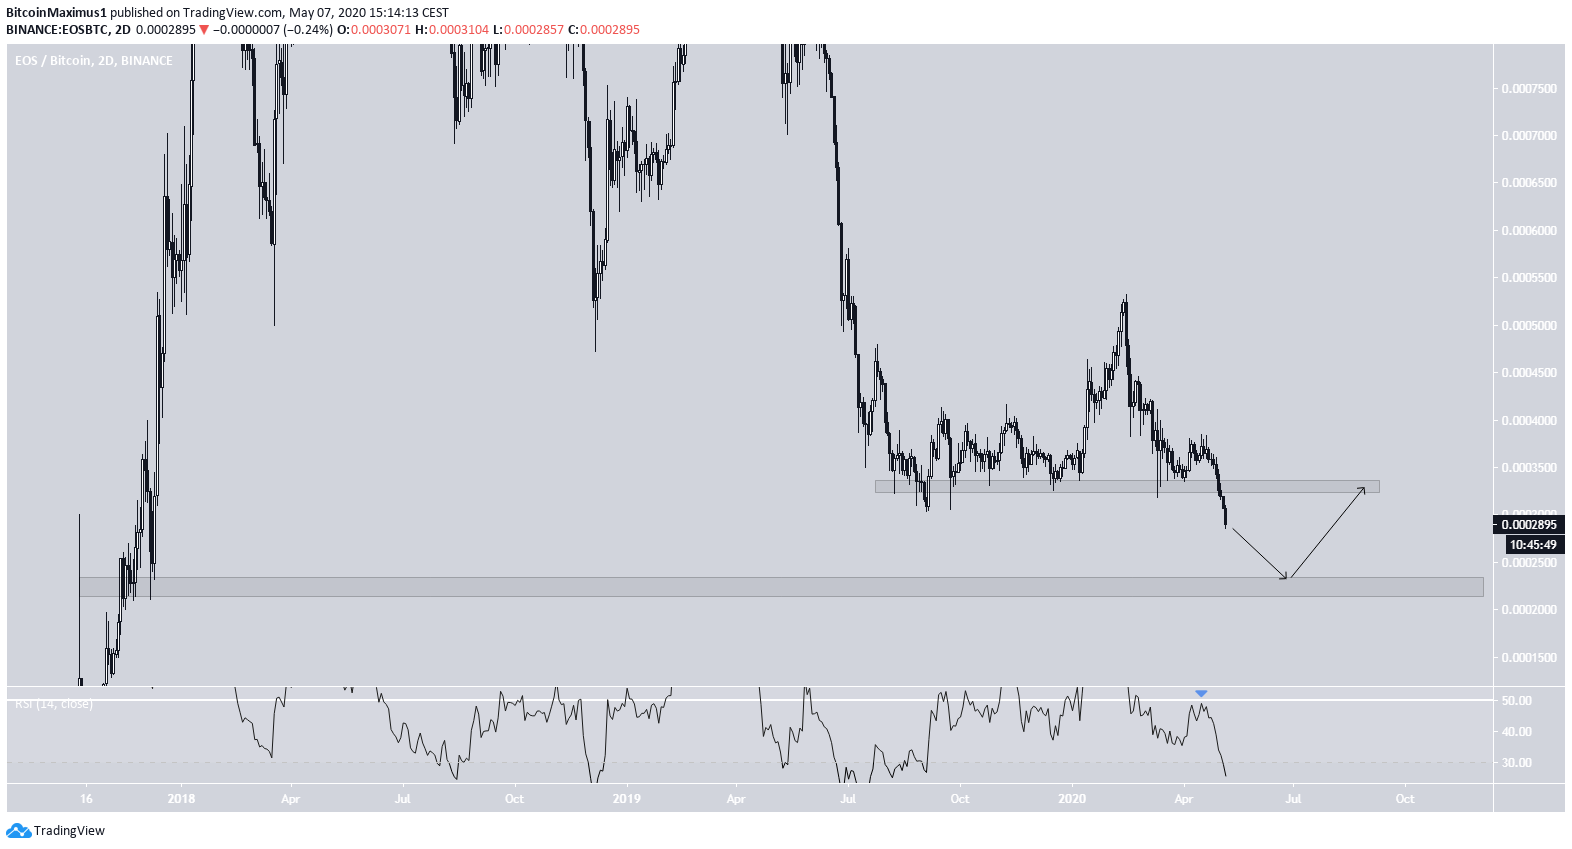
EOS (EOS)
The EOS price has been decreasing since April 16, when it reached a high of 38,500 satoshis. On May 4, it broke down below the 30,000 satoshi support area. At the time of writing, EOS was trading at its lowest levels since 2017.
While the daily RSI is extremely oversold, it has not generated any type of bearish divergence. Along with the recent breakdown and lack of any reversal signs, this suggests that EOS is likely to decrease towards the closest support area at 22,000 satoshis.
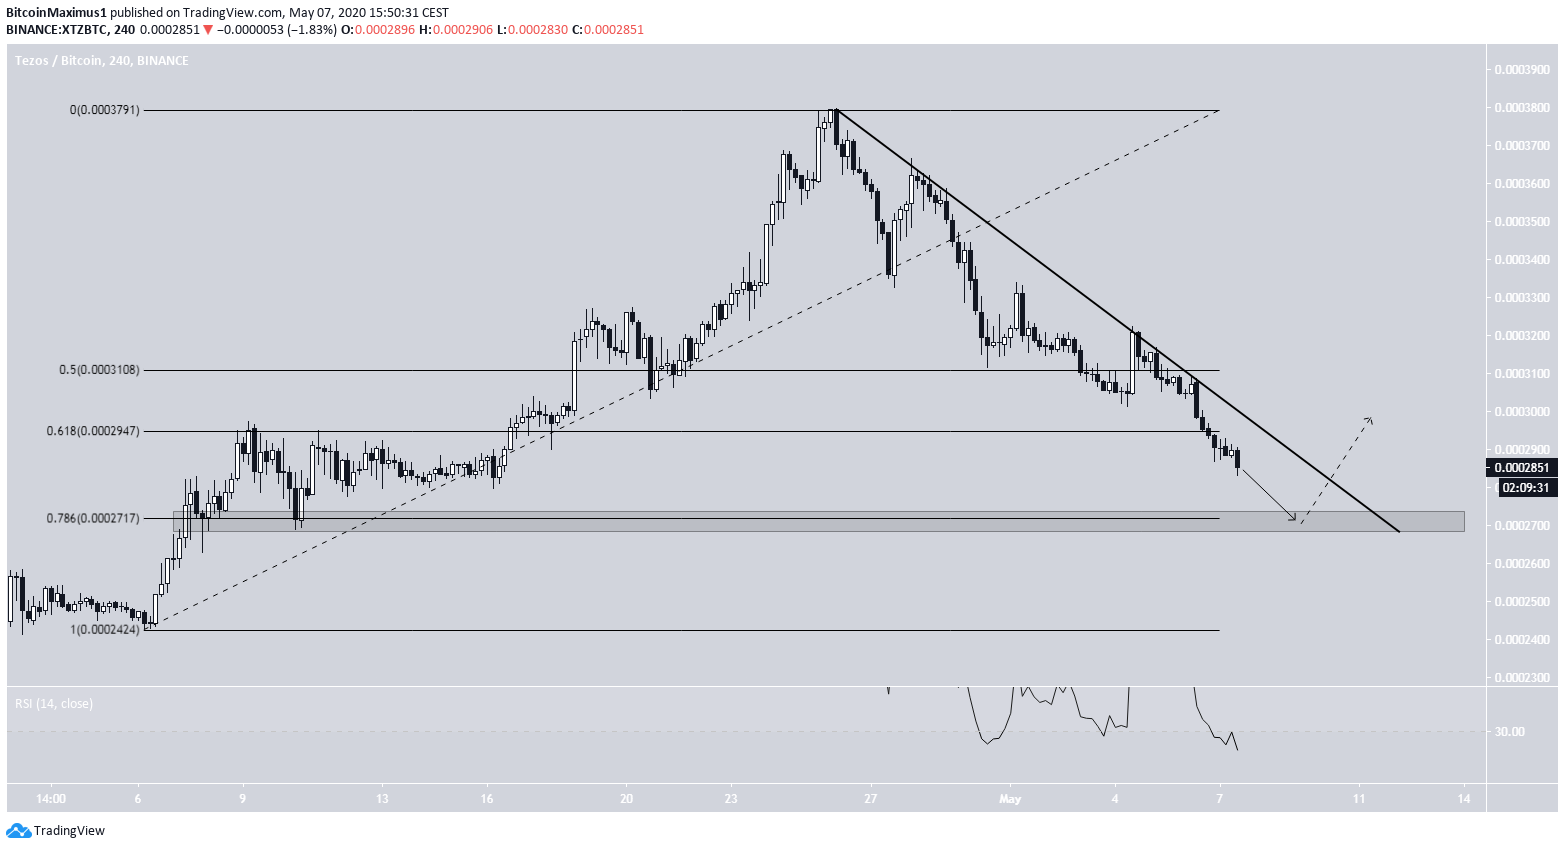
Tezos (XTZ)
The Tezos (XTZ) price has been rapidly decreasing since it reached a high of 37,960 satoshis on April 26. During the decrease, it has been following a very steep descending resistance line.
The price is approaching the 27,000 satoshi area, which is both a previous support area and the 0.786 Fib level of the entire upward move. Since the RSI is very oversold and might have generated some bullish divergence, this area is likely to initiate a bounce towards the aforementioned descending resistance line.
At the current time, we cannot state with certainty whether XTZ will break out above this line.
Chainlink (LINK)
On May 4, the LINK price broke down from a descending wedge. Since the descending wedge is considered a bearish reversal pattern, the breakdown is a major show of weakness.
However, the RSI has generated some bullish divergence, and the price has almost reached the 38,000 satoshi support area. Therefore, it is expected to eventually initiate a bounce towards the support line it just broke down from.
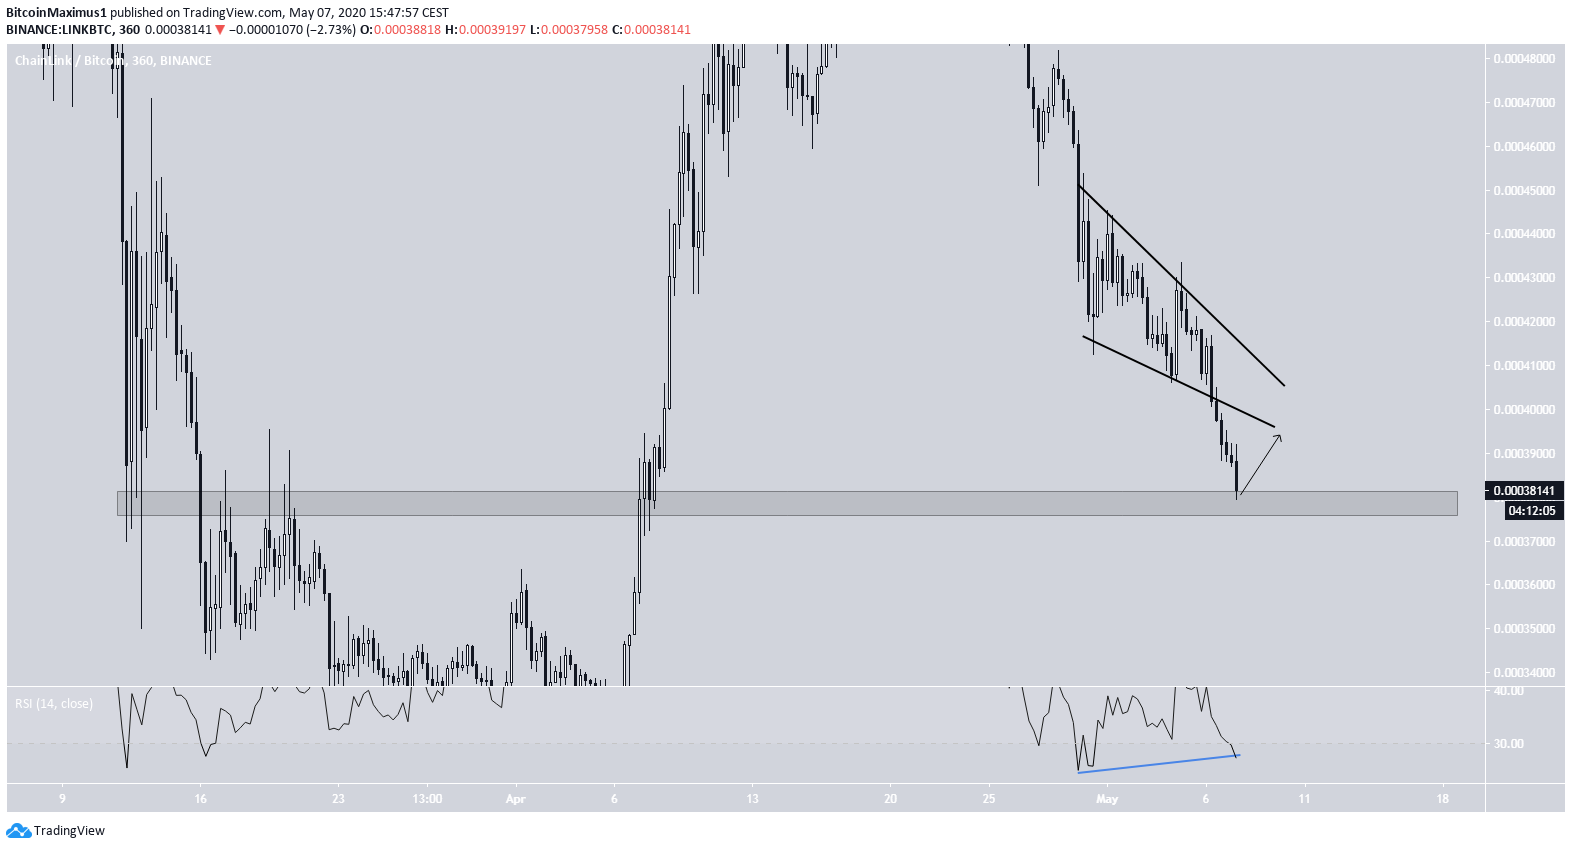
However, there are no clear signs of a long-term reversal yet, as has been the case in the majority of the altcoins we have covered.


