

BeInCrypto takes a look at the five projects that dumped the most last week in the crypto market, more specifically, from Oct. 14 to Oct. 21.
These are the worst-performing cryptocurrencies that have dominated the crypto market news in the past week:
- Chain (XCN) price is down 22.08%
- Maker (MKR) price is down 13.66%
- Casper (CSPR) price is down -4.99%
- BinaryX (BNX) price is down 3.51%
- Quant (QNT) is down 2.37%
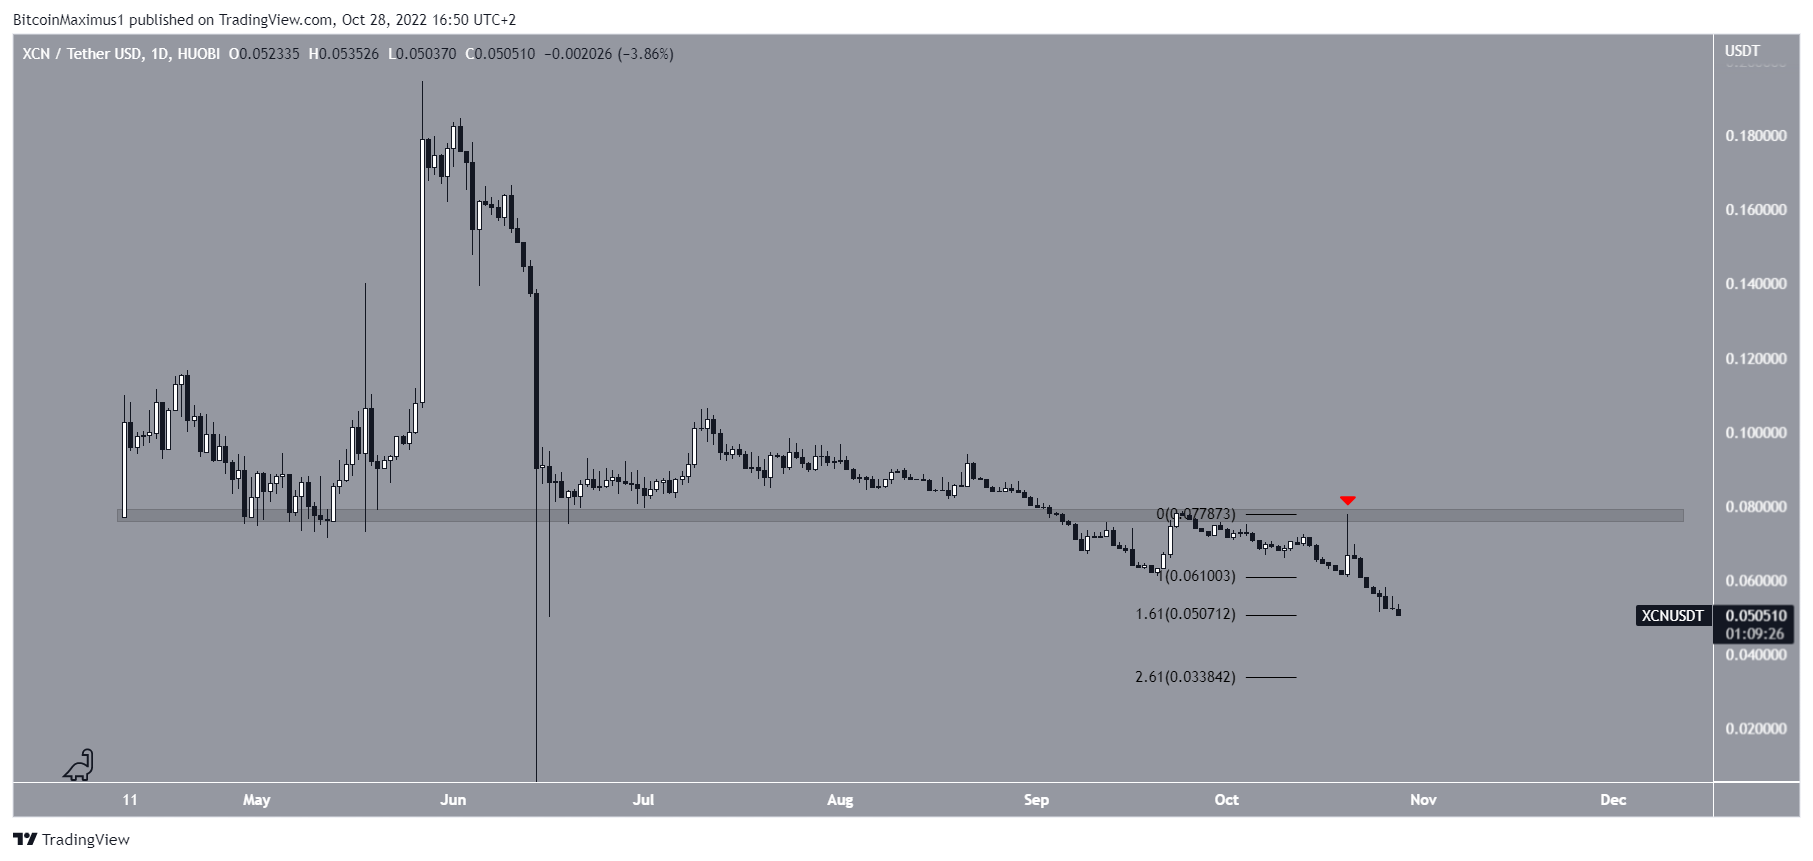
Chain Price Prediction: Falls Towards All-Time Low
On Sept. 6, XCN broke down below the $0.079 horizontal area, which had been acting as support since April. Afterward, it validated it as resistance (red icon) on Oct. 20.
The XCN price has been falling since, continuing its decrease over the past 24 hours. It reached a low of $0.050 on Oct. 28. When measuring by the daily closing price, this is a new all-time low.
Currently, XCN is trading at the 1.61 external Fib support level at $0.050. A breakdown below it would likely take the price down to $0.033 on the crypto market.
Conversely, a daily close above $0.079 would invalidate the bearish hypothesis. At the current time, this seems unlikely.
Maker Price Prediction: Break Down From Ascending Support Line
MKR had been increasing alongside an ascending support line since Sept. 21. The upward movement led to a high of $1,170 on Oct. 9 and a slightly lower high of $1,150 on Oct. 19. The MKR price has been decreasing below a descending resistance line (dashed) since.
On Oct. 22, MKR broke down from the ascending support line, indicating that the upward movement had come to an end. Currently, the price is trading above the $877 support area.
If the downward movement continues, the next closest support area would be at $808.
A breakout from the resistance line and reclaim of the $965 resistance area would indicate that the correction is complete and new highs are in store.

Casper Price Prediction: Correction After Five-Wave Increase
CSPR has been correcting since Oct. 14, when it completed a five-wave upward movement at $0.055. The downward movement resembles an A-B-C structure. If so, CSPR is currently in wave C.
The most likely level for the correction to end is at $0.036. This is both a horizontal support area and the 0.618 Fib retracement support level.
Contrarily, an increase above the wave B high of $0.050 (red line) would indicate that the correction is complete and new highs will follow.

BinaryX Price Prediction: Could Fall From Ascending Channel
The BNX price has been increasing inside an ascending parallel channel since May 11. Such channels usually contain corrective patterns. This means that an eventual breakdown from it would be the most likely scenario.
Furthermore, the daily RSI has broken down below 50 (red icon), in what is considered a sign of a bearish trend in a crypto market.
As a result, a breakdown from the channel seems to be the most likely scenario. If one occurs, the BNX price could fall to the closest support at $95.
On the other hand, a movement above the middle of the channel at $155 (red circle) would likely trigger a BNX upward movement towards the resistance line of the channel at $175.

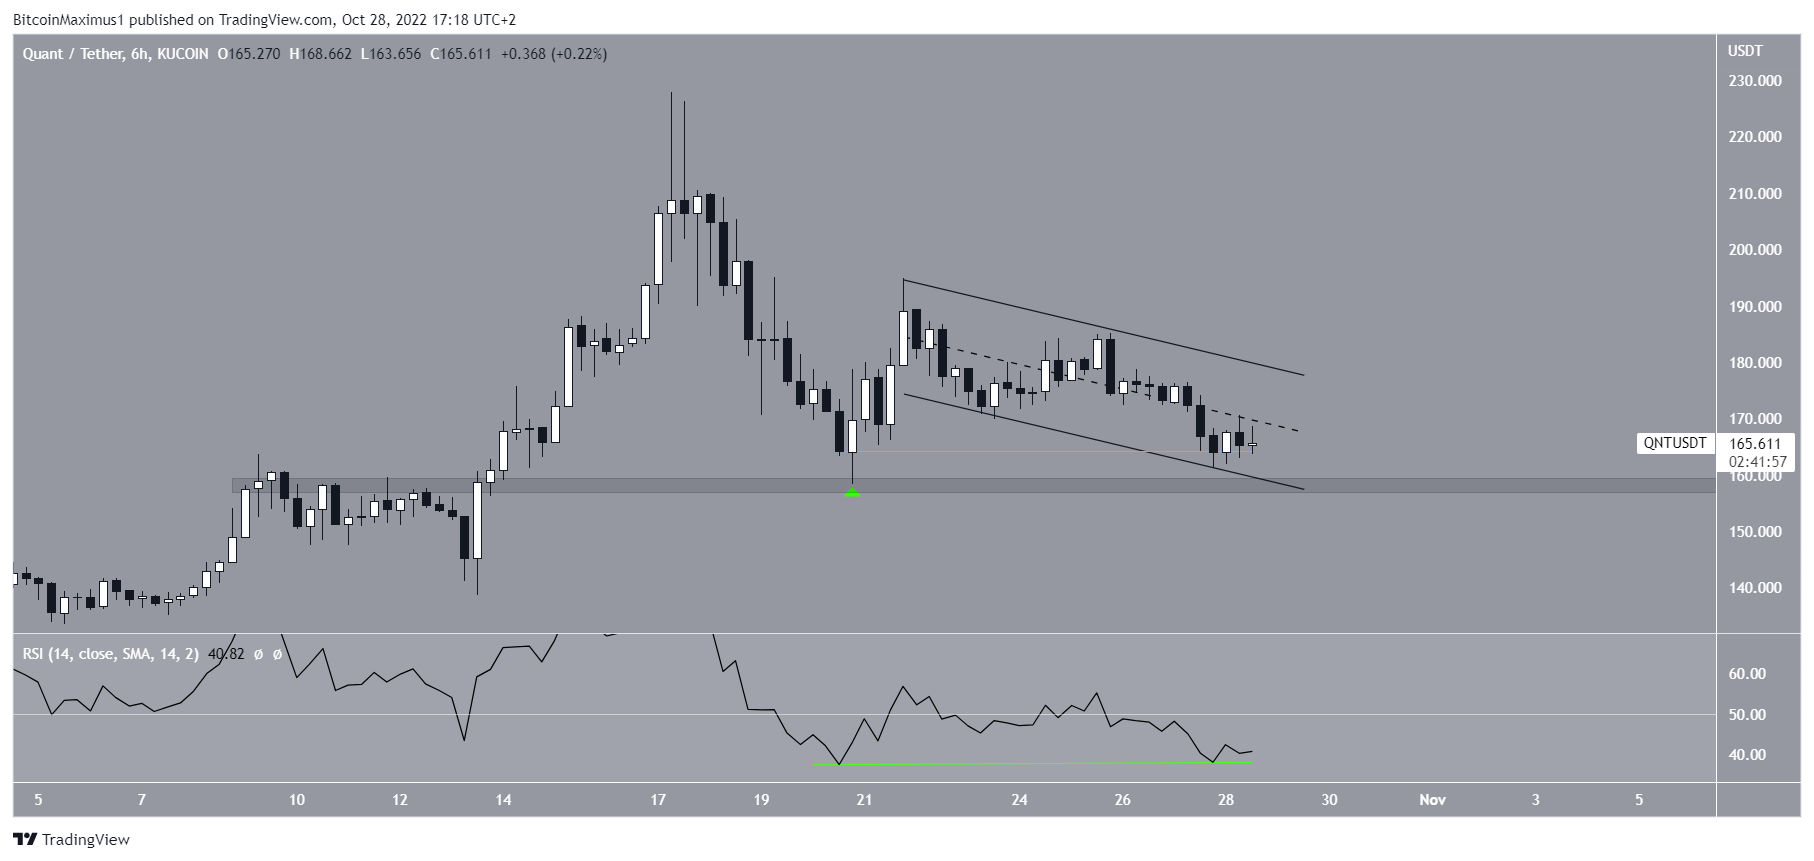
Quant Price Prediction: Gradually Decreasing Towards Support
On Oct. 20, QNT bounced at the $158 horizontal support area and proceeded to reach a high of $194.880 the next day. The price has been falling inside a descending parallel channel since.
Besides the fact that the descending parallel channel is considered a bullish pattern, the six-hour RSI has generated bullish divergence (green line).
As a result, a decrease towards the $158 horizontal support area prior to an eventual breakout seems to be the most likely scenario. A daily close below the $158 level would invalidate this bullish hypothesis.
For the latest BeInCrypto Bitcoin (BTC) and crypto market analysis, click here
Disclaimer: BeInCrypto strives to provide accurate and up-to-date information, but it will not be responsible for any missing facts or inaccurate information. You comply and understand that you should use any of this information at your own risk. Cryptocurrencies are highly volatile financial assets, so research and make your own financial decisions.
Disclaimer
In line with the Trust Project guidelines, this price analysis article is for informational purposes only and should not be considered financial or investment advice. BeInCrypto is committed to accurate, unbiased reporting, but market conditions are subject to change without notice. Always conduct your own research and consult with a professional before making any financial decisions. Please note that our Terms and Conditions, Privacy Policy, and Disclaimers have been updated.
