
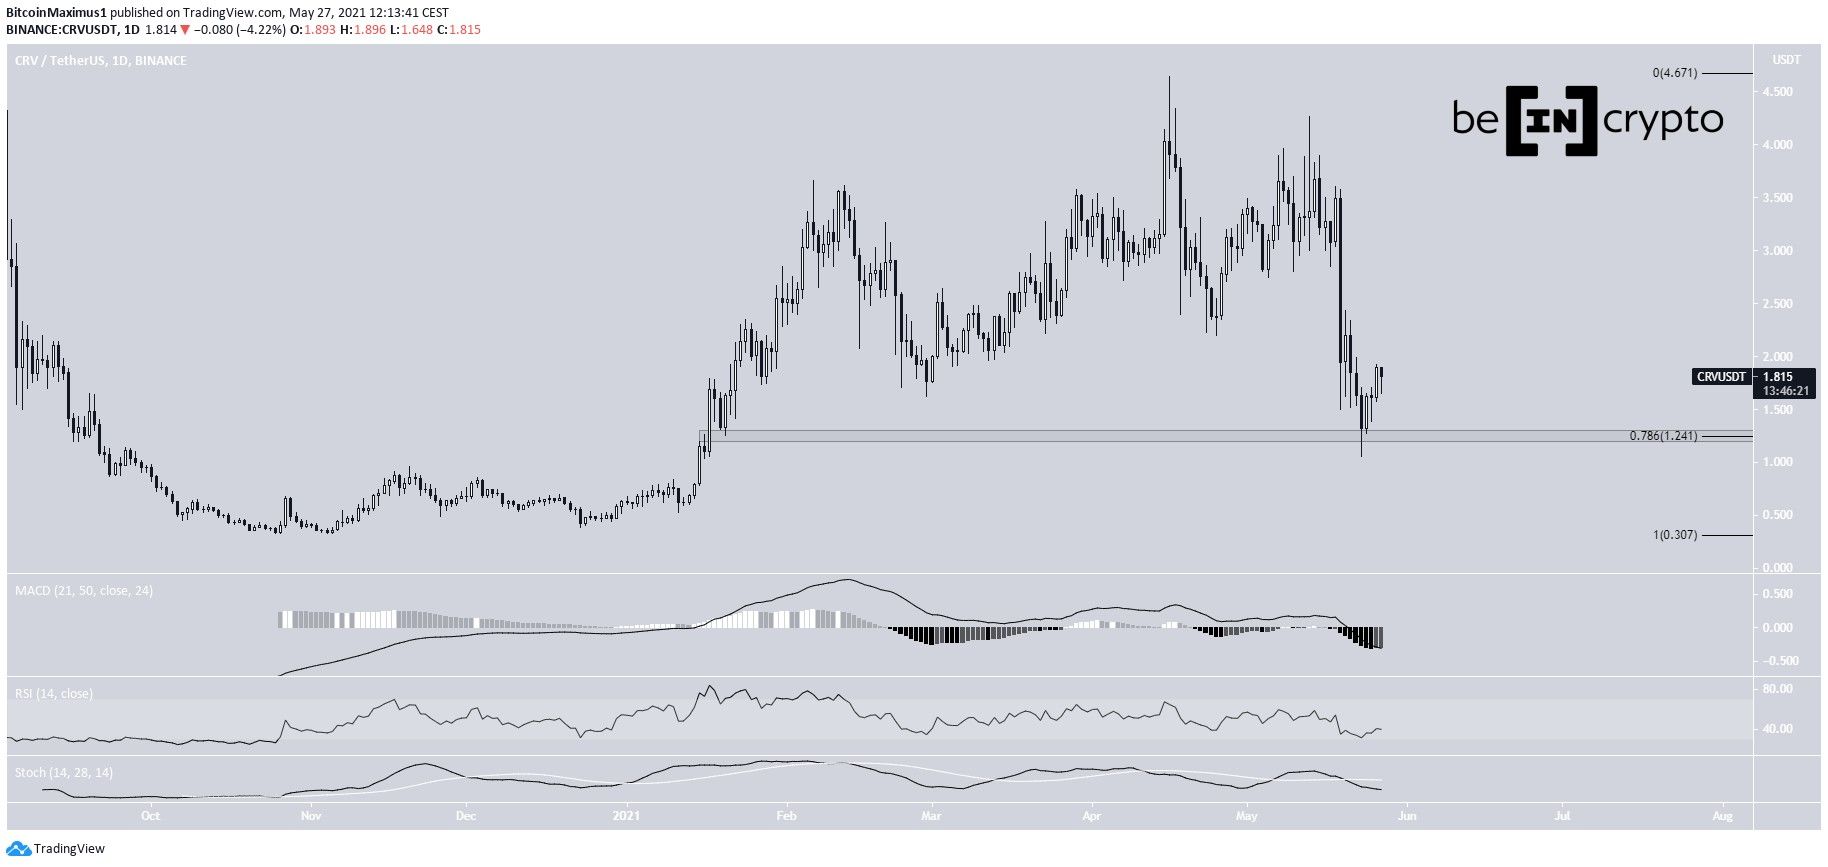
Curve Dao Token (CRV) has been moving downwards since April 16, but has bounced at the long-term $1.24 support area.
There are no bullish reversal signs present, but the wave count shows a potential completed correction.
CRV returns to January levels
CRV has been moving downwards since April 16. It created a lower high on May 13 and continued the decrease at an accelerated rate.
A low of $1.05 was reached on May 23, temporarily stopping the decrease. This validated the 0.786 Fib retracement level at $1.24 as support. The level had not been reached since January 2021.
Despite the bounce, technical indicators are still leaning on bearish. While the MACD is showing some bullish reversal signs, both the RSI & Stochastic oscillator are still bearish.
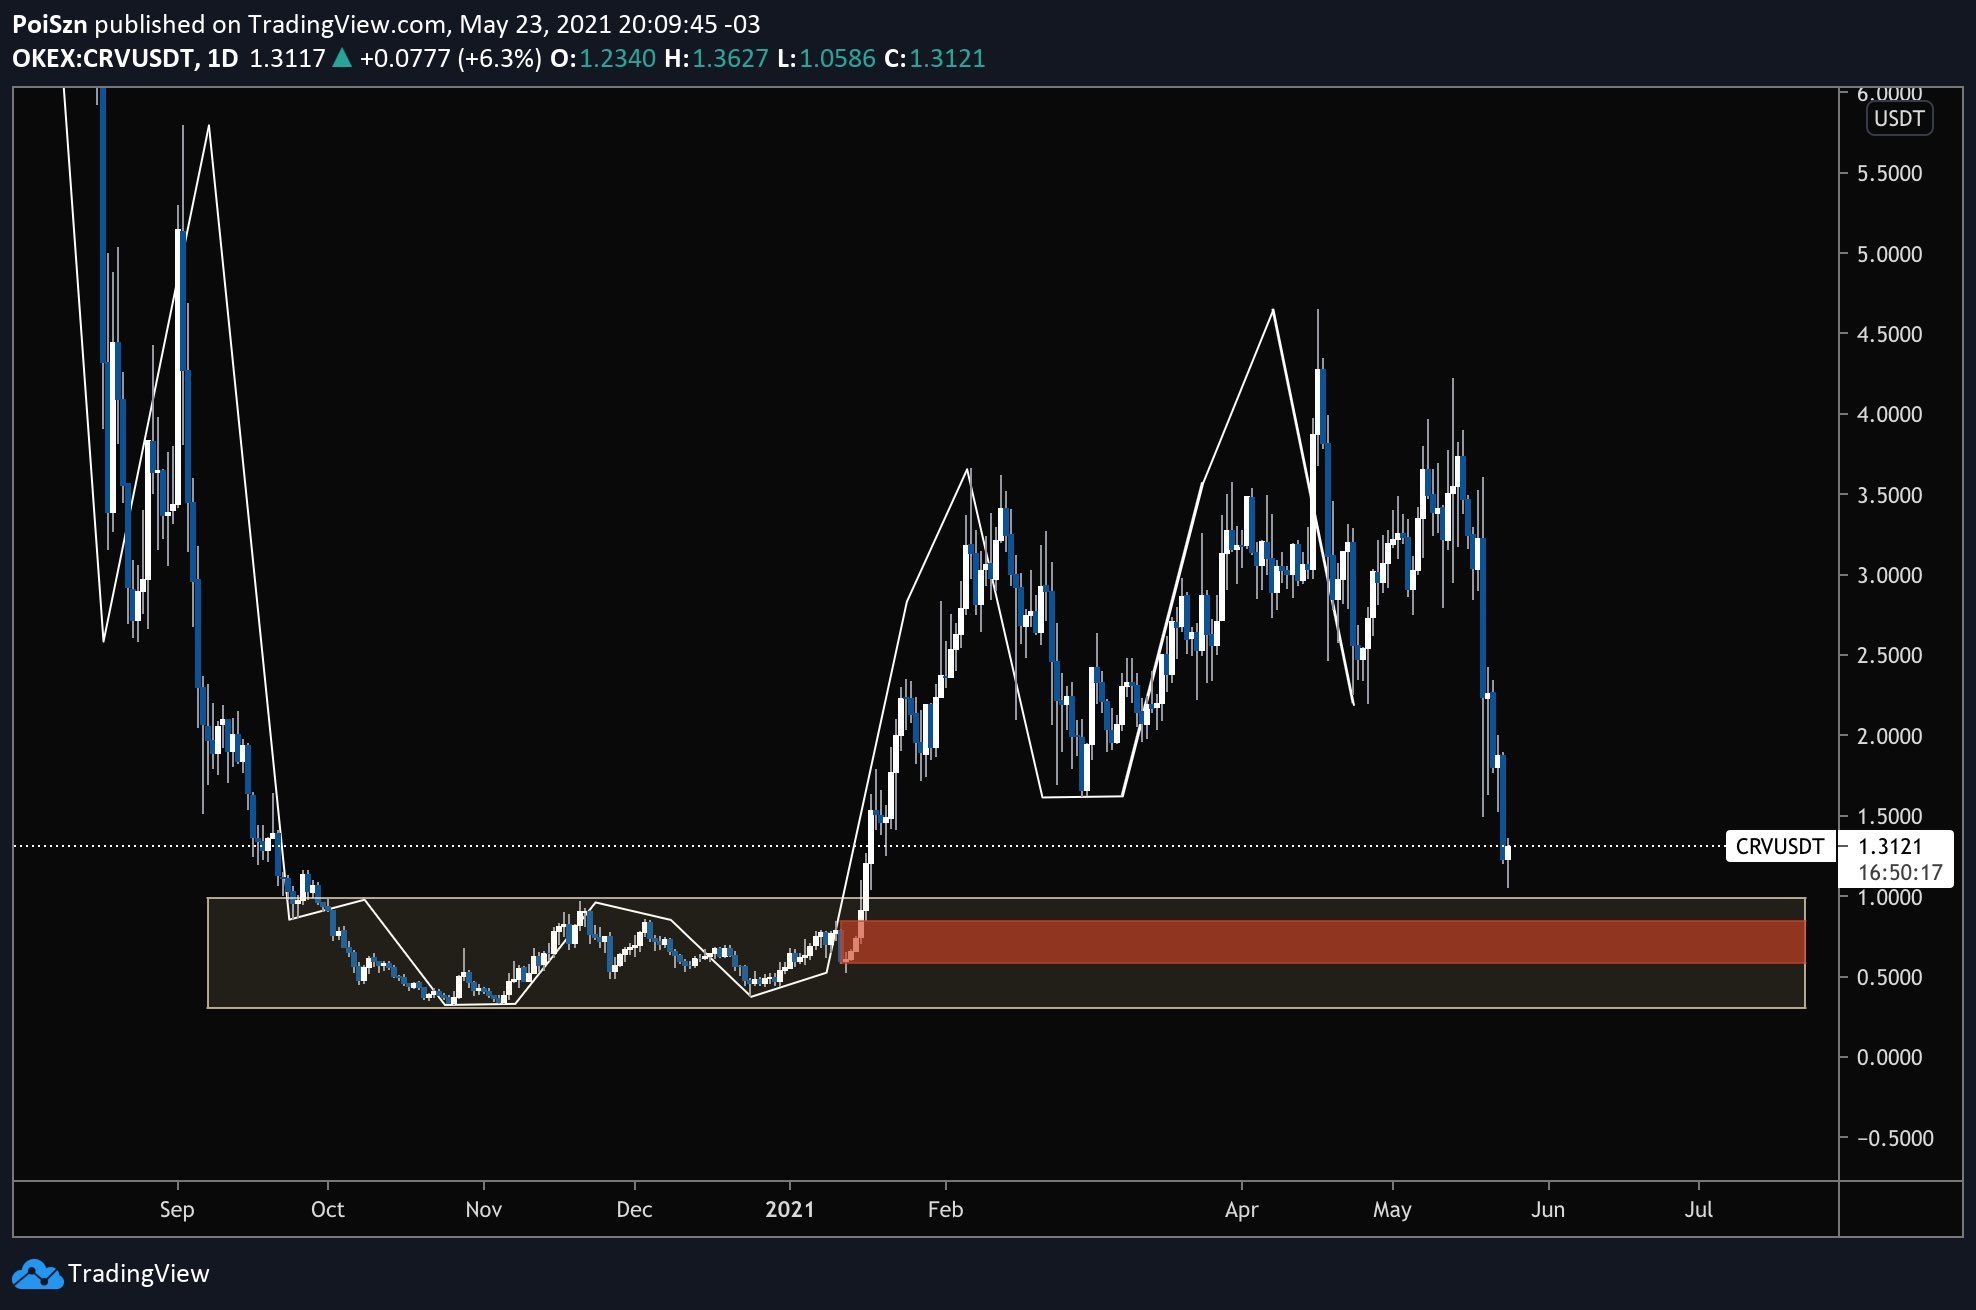
Cryptocurrency trader @Po1szn outlined a CRV chart, which shows the token approaching the main support area. As evidenced above, the token has bounced at the 0.786 Fib retracement support level at $1.24.
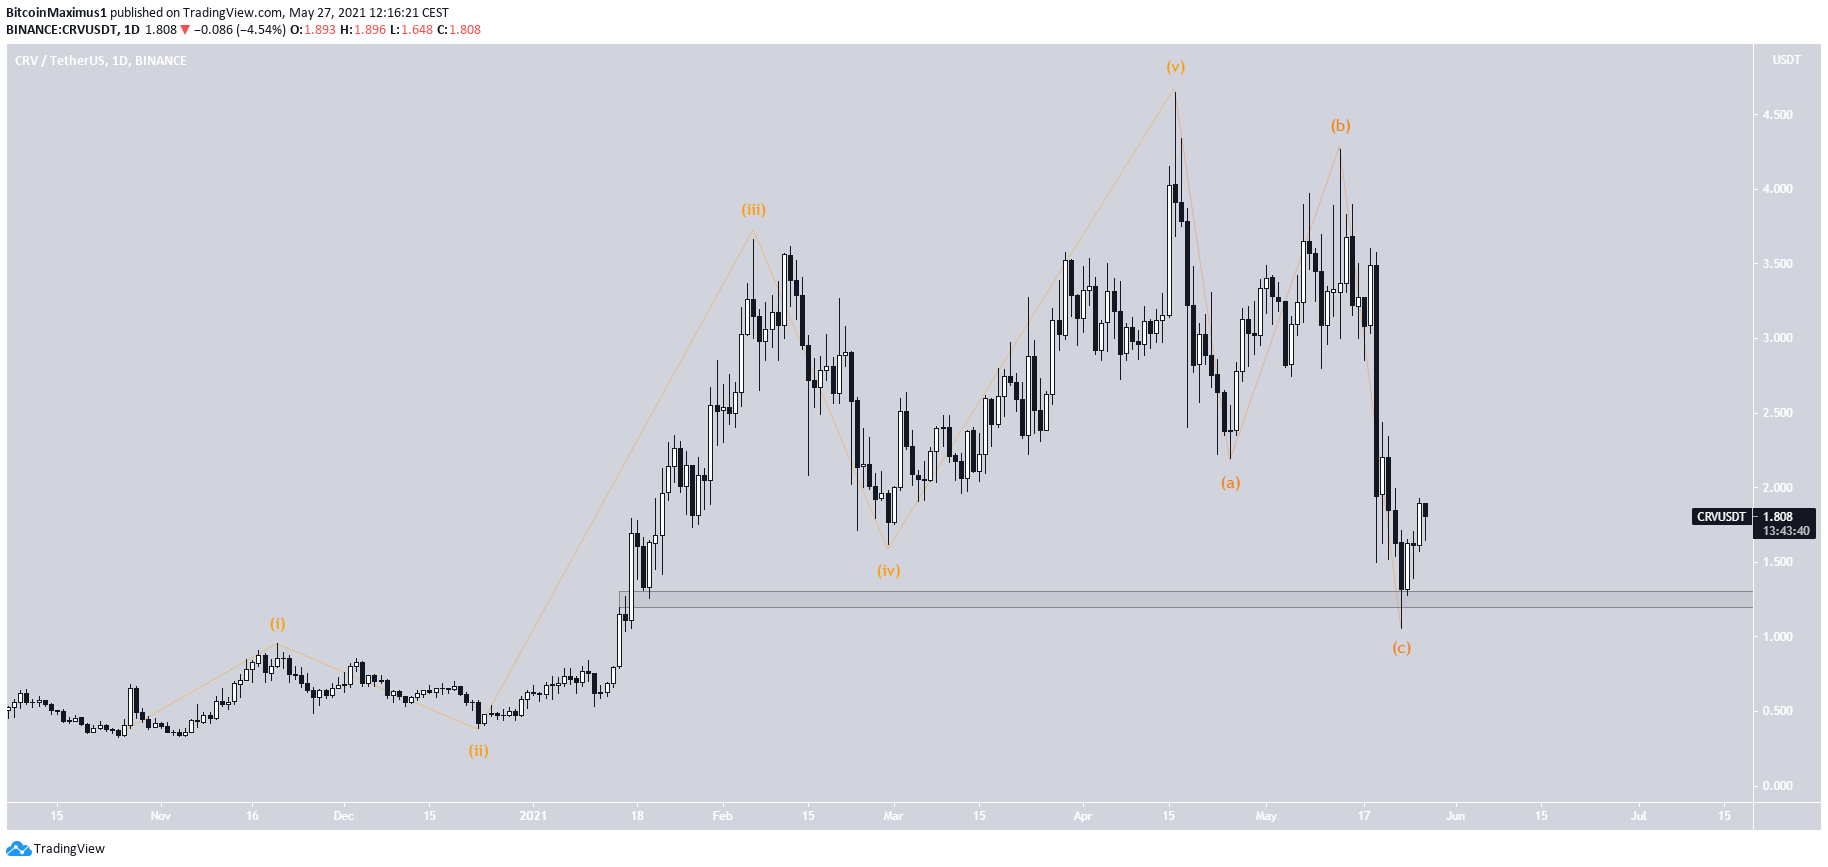
Despite the lack of bullish reversal signs, the wave count indicates a complete bullish impulse and A-B-C corrective structure.
If it holds, it would mean that the token has begun a new bullish impulse.
Short-term movement
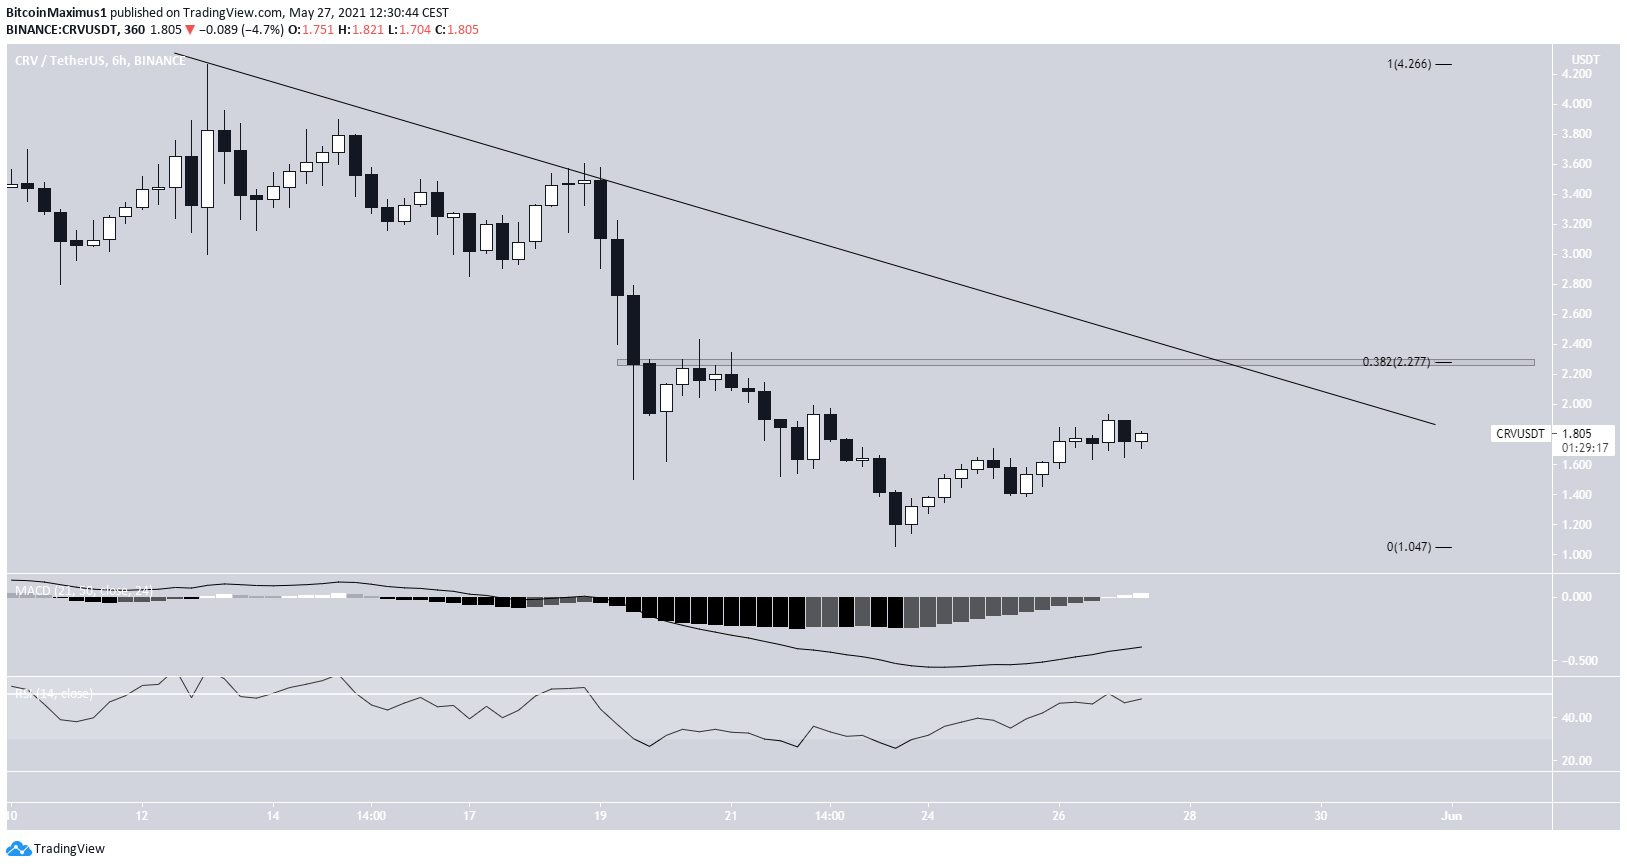
The shorter-term six-hour chart shows a descending resistance line that has been in place since the May 13 lower high.
The line coincides with the 0.382 Fib retracement level, which creates the $2.27 resistance area.
Both the MACD and RSI are increasing. However, in order for the short-term trend to be considered bullish, a breakout and reclaim are necessary.
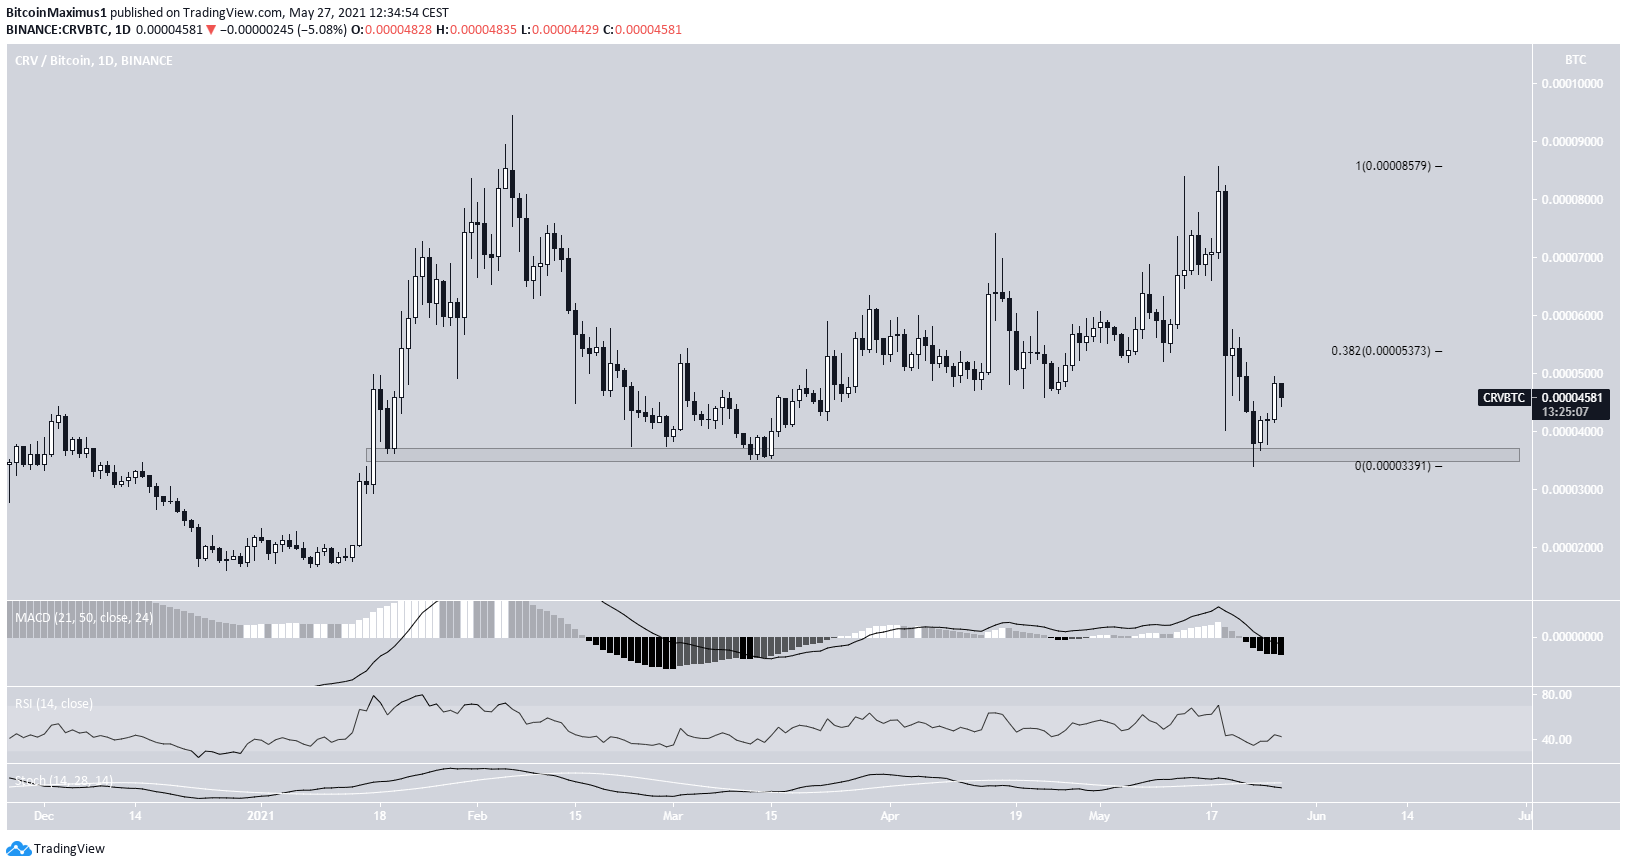
CRV/BTC
The CRV/BTC chart is similar to its USD counterpart. The token bounced at the 3,600 satoshi support area, initiating the ongoing bounce.
However, no bullish reversal signs present. The 0.382 Fib retracement level creates the first resistance area at 5,375 satoshis.
For BeInCrypto’s latest bitcoin (BTC) analysis, click here.
