
COTI Network (COTI) broke out from a long-term descending parallel channel on Aug 25 but failed to sustain its upward movement. Afterwards, it returned to validate it as support.
While a short-term bounce has already been initiated, the bullish reversal is not yet confirmed.
Long-term movement
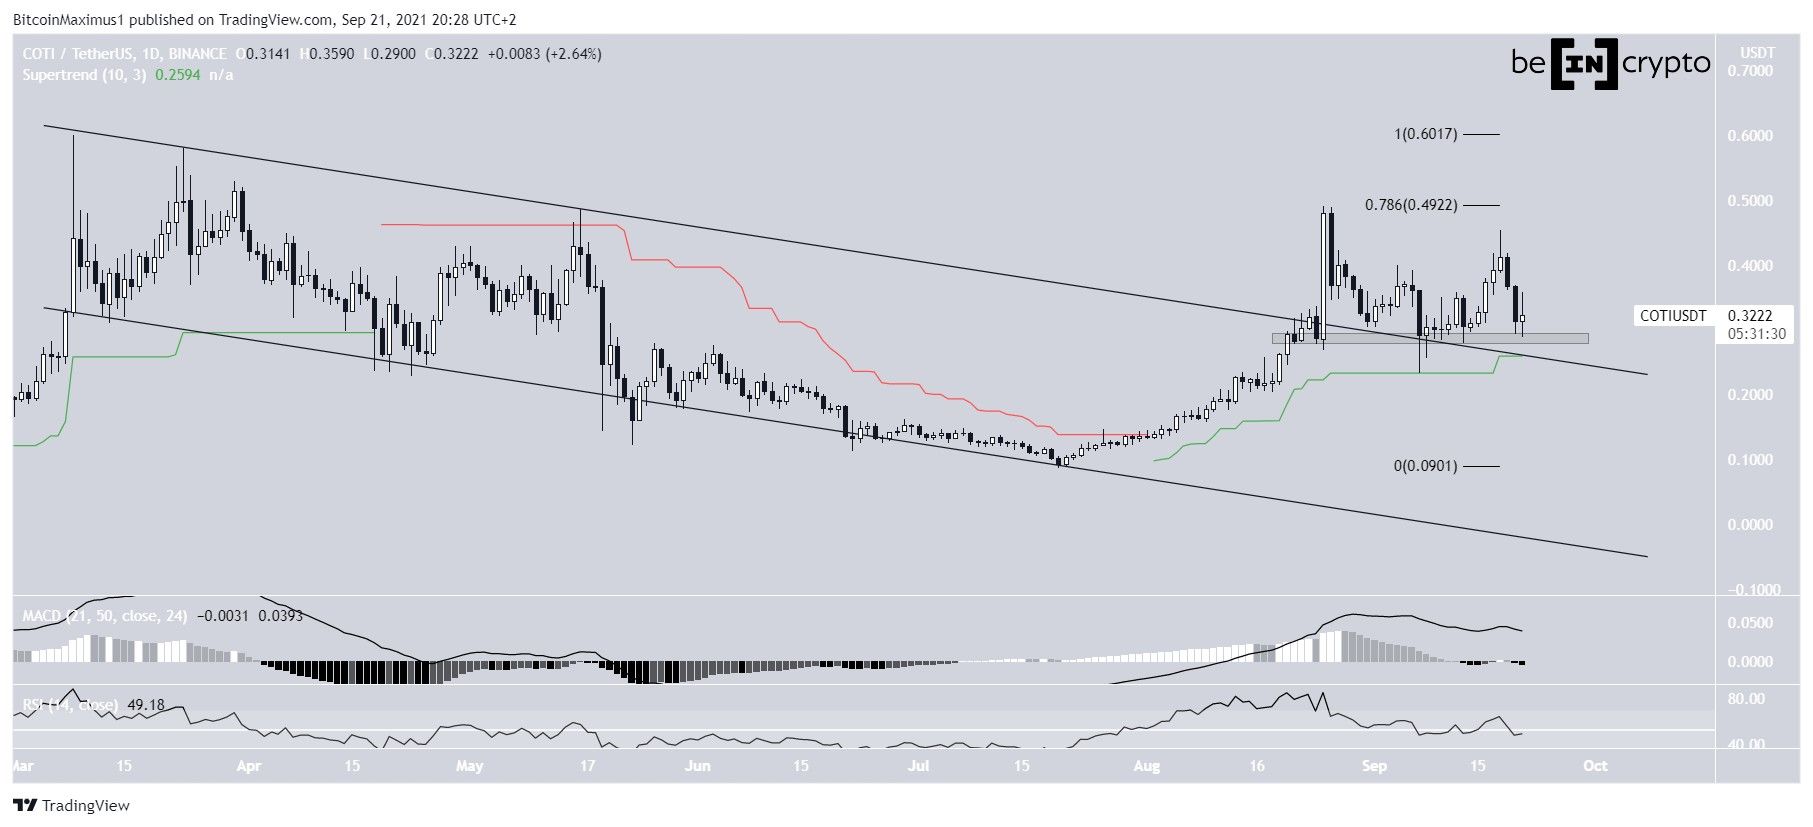
COTI had been trading inside a long-term descending parallel channel since reaching a high on March 8. The downward movement culminated with a low of $0.088 on July 20. Afterwards, COTI initiated an upward movement.
On Aug 25, COTI managed to break out from the channel and proceeded to reach a high of $0.49 the same day. The high was made right at the 0.786 Fib retracement resistance level when measuring the entire downward movement.
While the token has been decreasing since, it has found support at $0.29, where it has bounced twice. This area also coincides with the resistance line of the channel and the Supertrend line (green line).
However, the MACD and RSI are both neutral, leaning on bearish. The former is just above the 0 line while the latter is at the 50 line.
Therefore, while the price action still seems bullish, technical indicators are undecided.
Wave count
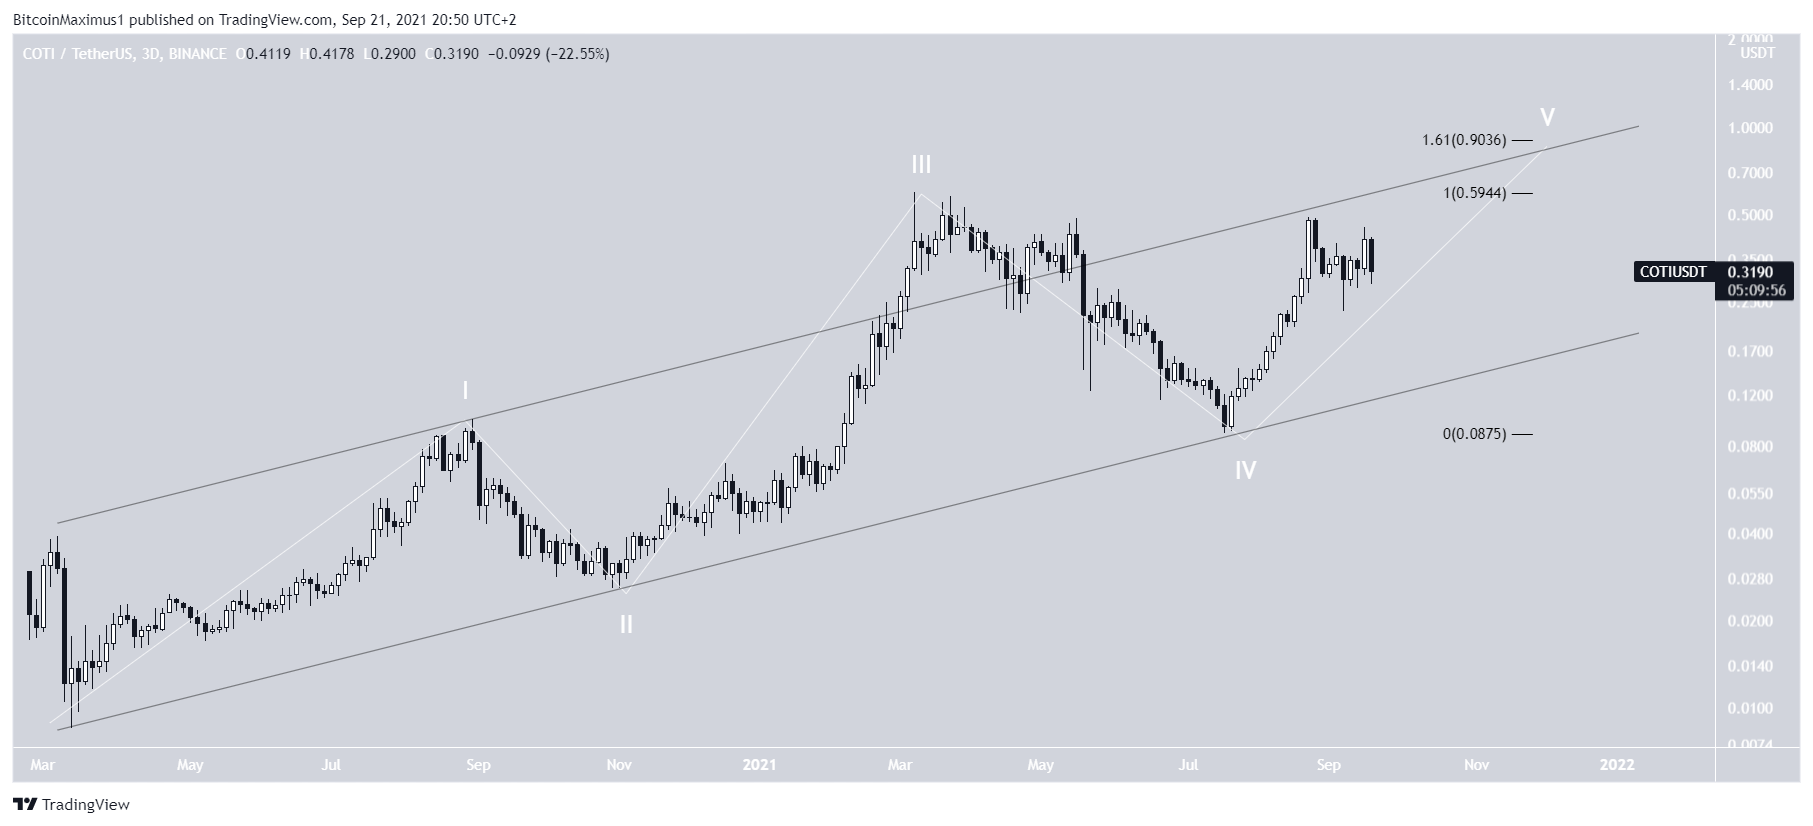
The long-term movement does resemble a potential five wave bullish impulse (white), in which the aforementioned July 20 low marked the bottom of wave four. The low did not break the trendline connecting the bottom of waves one and two, thus the formation is still valid.
A potential target for the top of this impulse is at $0.90. This is the 1.61 external Fib retracement of wave four (black) and coincides with the channel connecting the highs and lows of waves one and two.
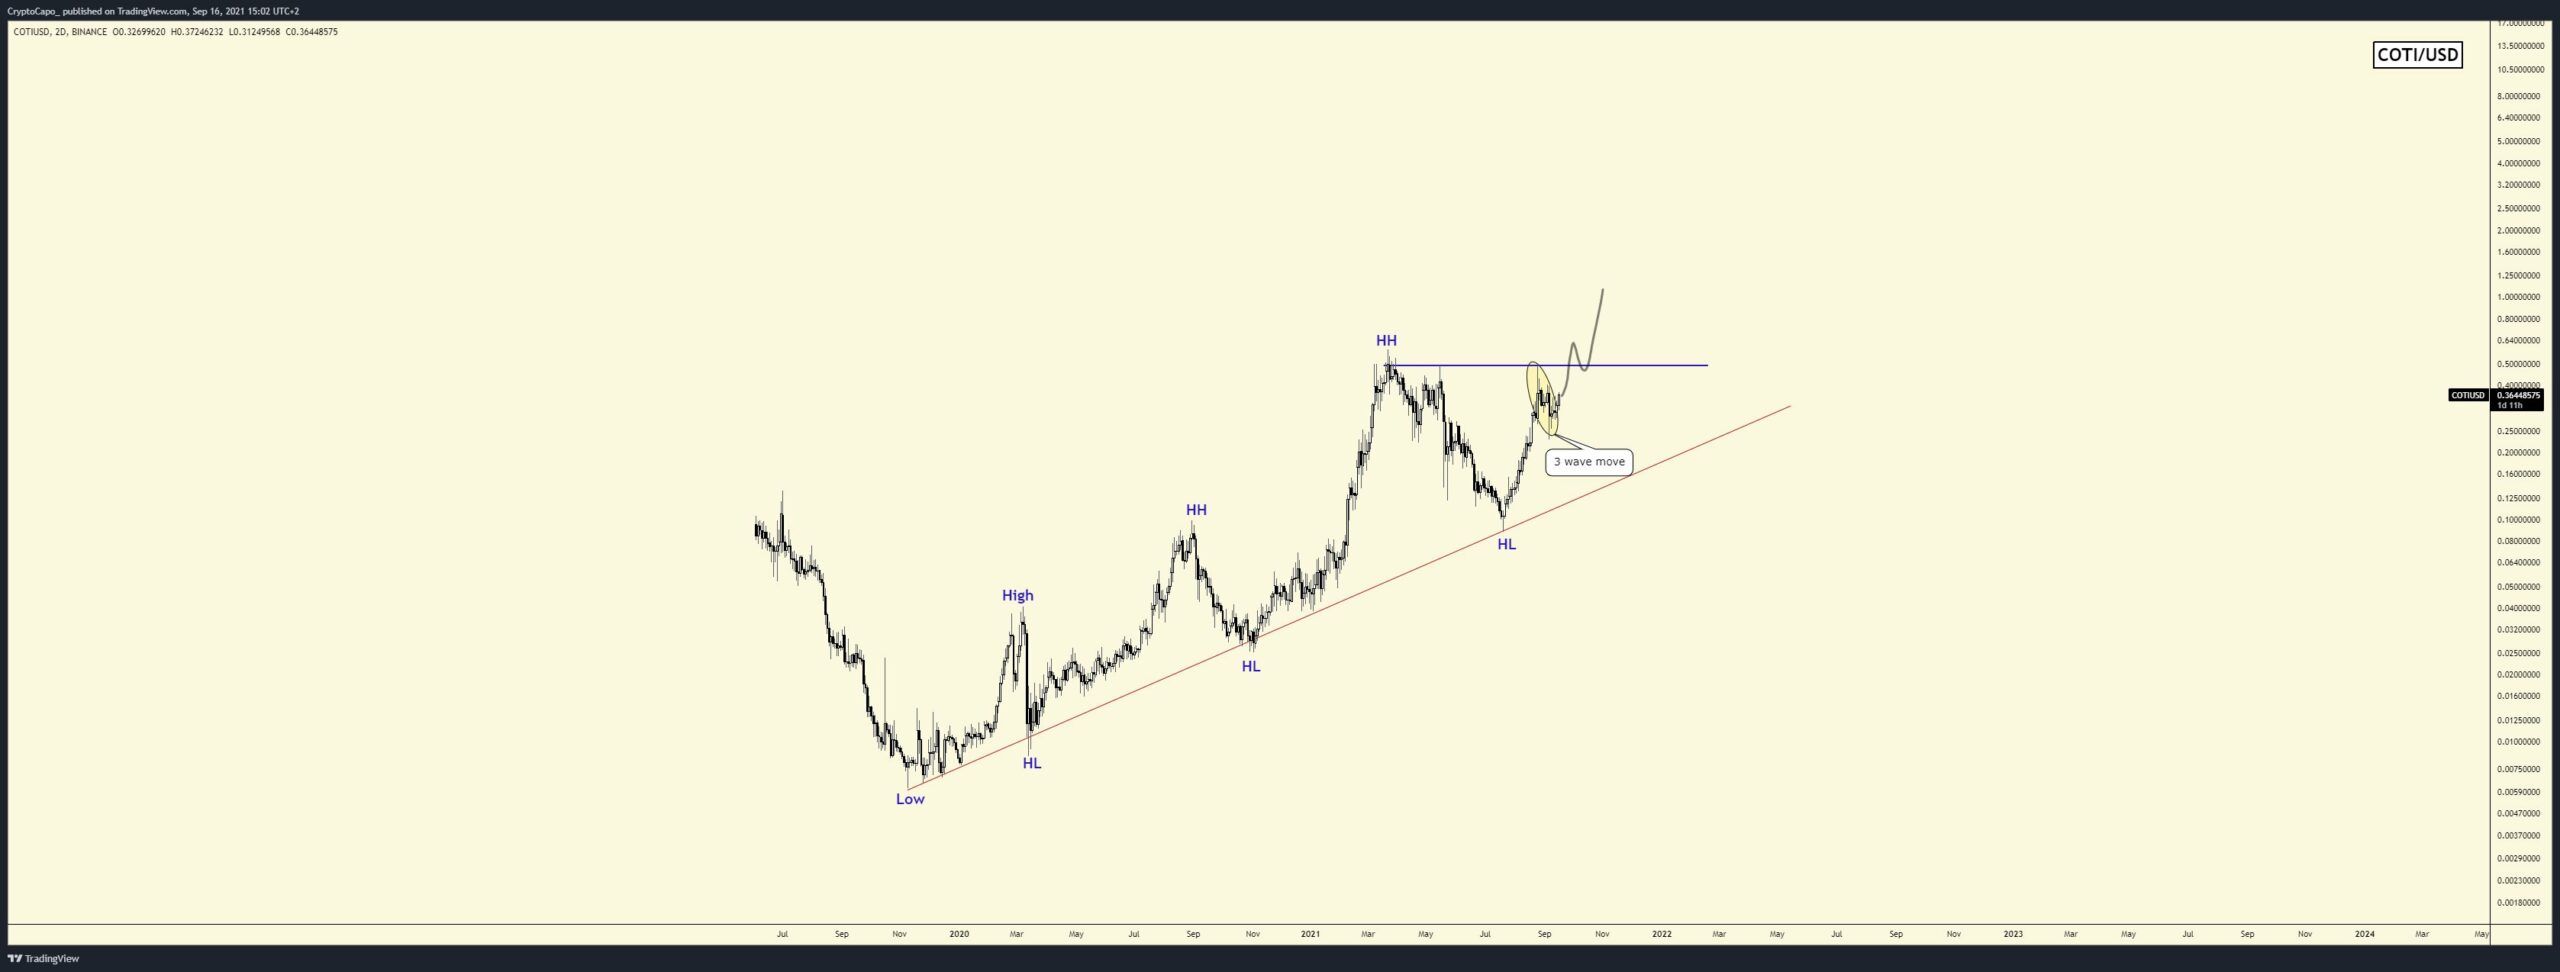
Cryptocurrency trader @CryptoCapo_ outlined a COTI chart, stating that there is a perfect setup for the coin to continue increasing, since the current drop is a three wave structure.
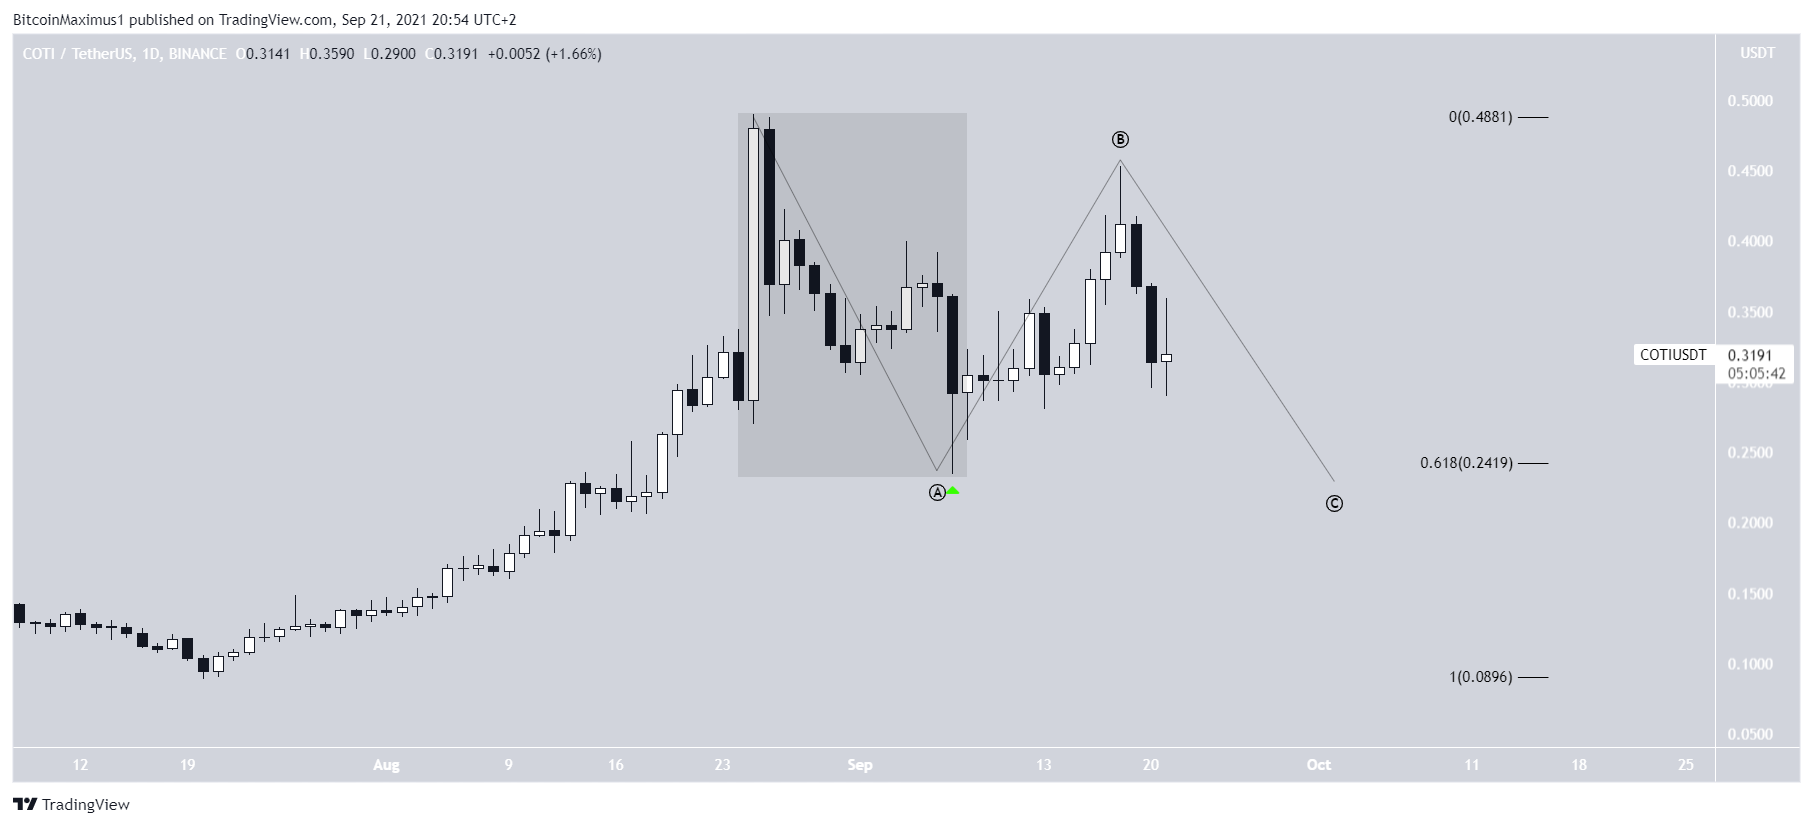
While the decrease (highlighted) is a three wave structure, so is the ensuing upward movement.
Therefore, it is likely that they were waves A and B of an A-B-C corrective structure (black), and COTI is now in the C wave.
A potential area for the completion of this movement would be just below the 0.618 Fib retracement support level at $0.242. This would sweep the Sept 7 lows (green icon) and complete the A-B-C structure.
For BeInCrypto’s latest Bitcoin (BTC) analysis, click here.
What do you think about this subject? Write to us and tell us!
