
After a nearly six-month upward trend, the COTI (COTI) price reached a high on Aug 31 and has been decreasing since.
It is likely that the current decrease will end near the long-term support area outlined below, and the price will resume its upward movement afterward.
COTI Highs and Lows
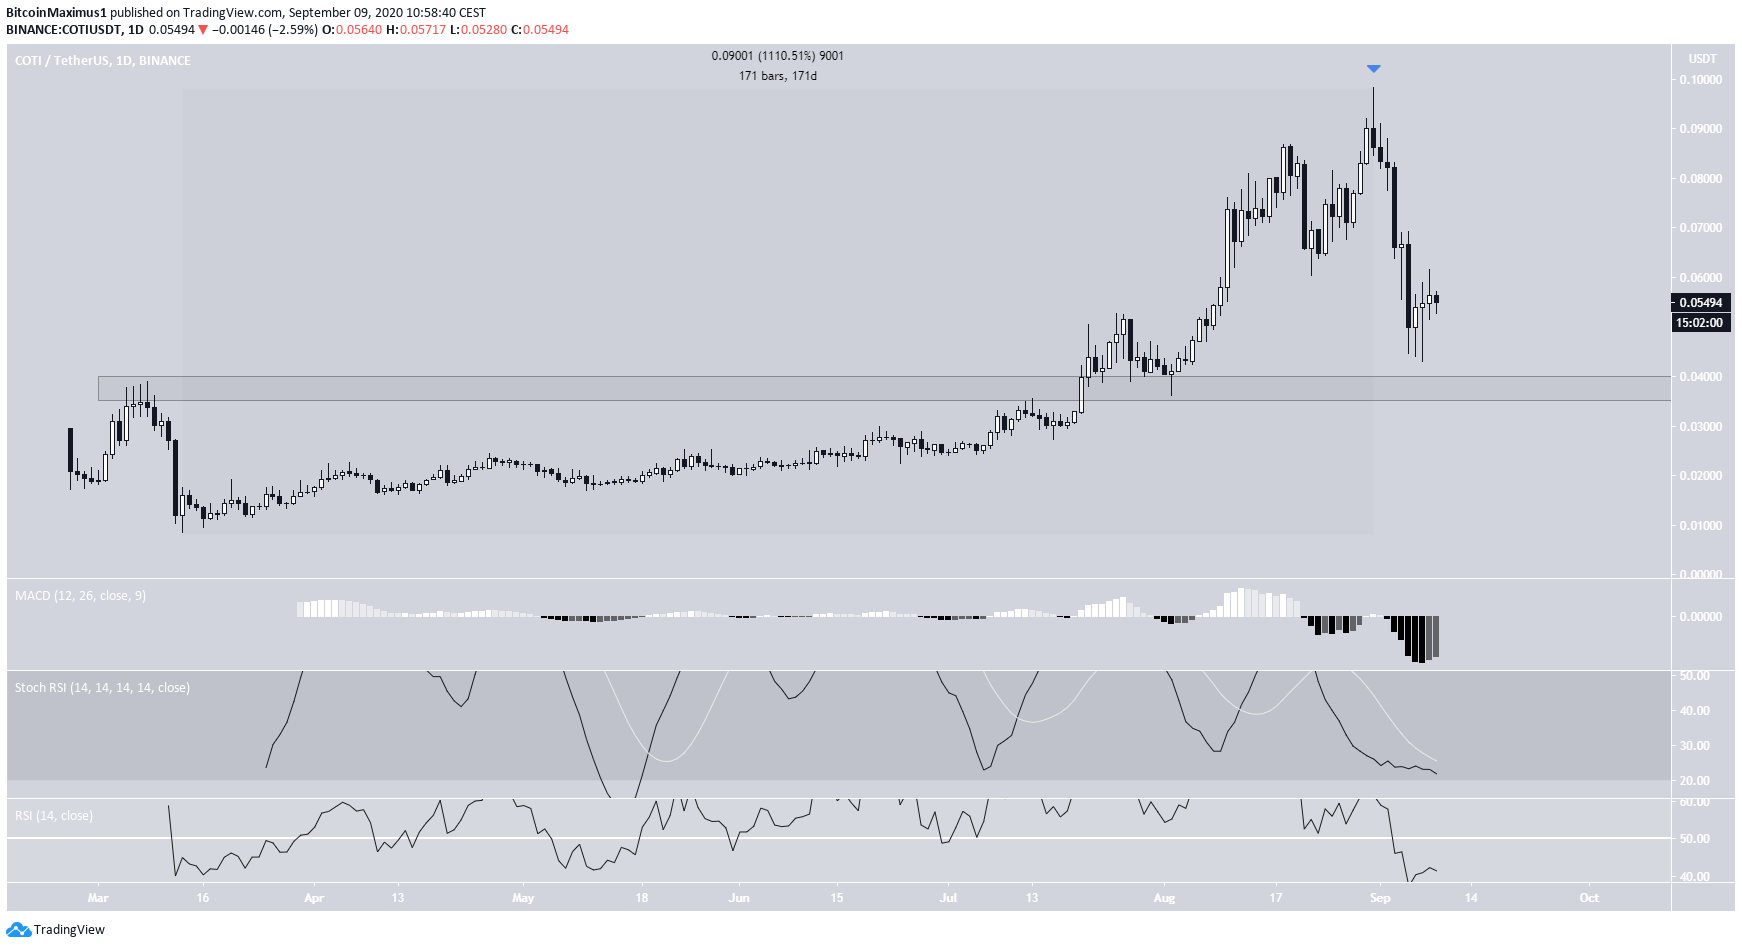
On Aug 31, the COTI price reached a high of $0.098. This was an increase of 1,100% measuring from the $0.0085 bottom on March 13. The bullish trend transpired over a period of 173 days.
However, a huge sell-off has brought COTI back down to $0.055. The price is approaching a critical level at $0.035, a zone that has previously acted as both resistance and support.
Technical indicators do not warn of an impending reversal. While the MACD has begun to increase, the reversal is not confirmed. Both the RSI and stochastic RSI are falling but have not yet reached oversold levels.
Trading Range
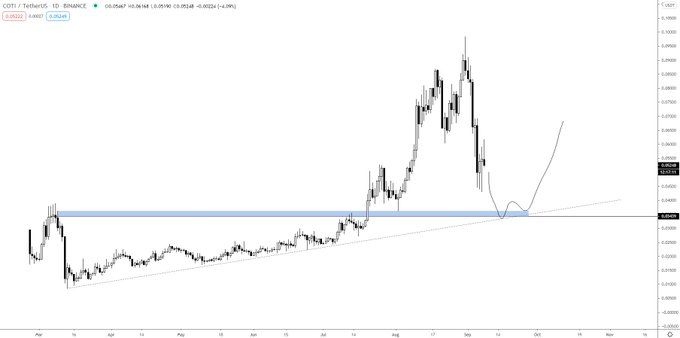
Cryptocurrency trader @TheEurosniper outlined a COTI chart, stating that the price is likely to fall towards the long-term support area of $0.035 before bouncing and moving upwards.
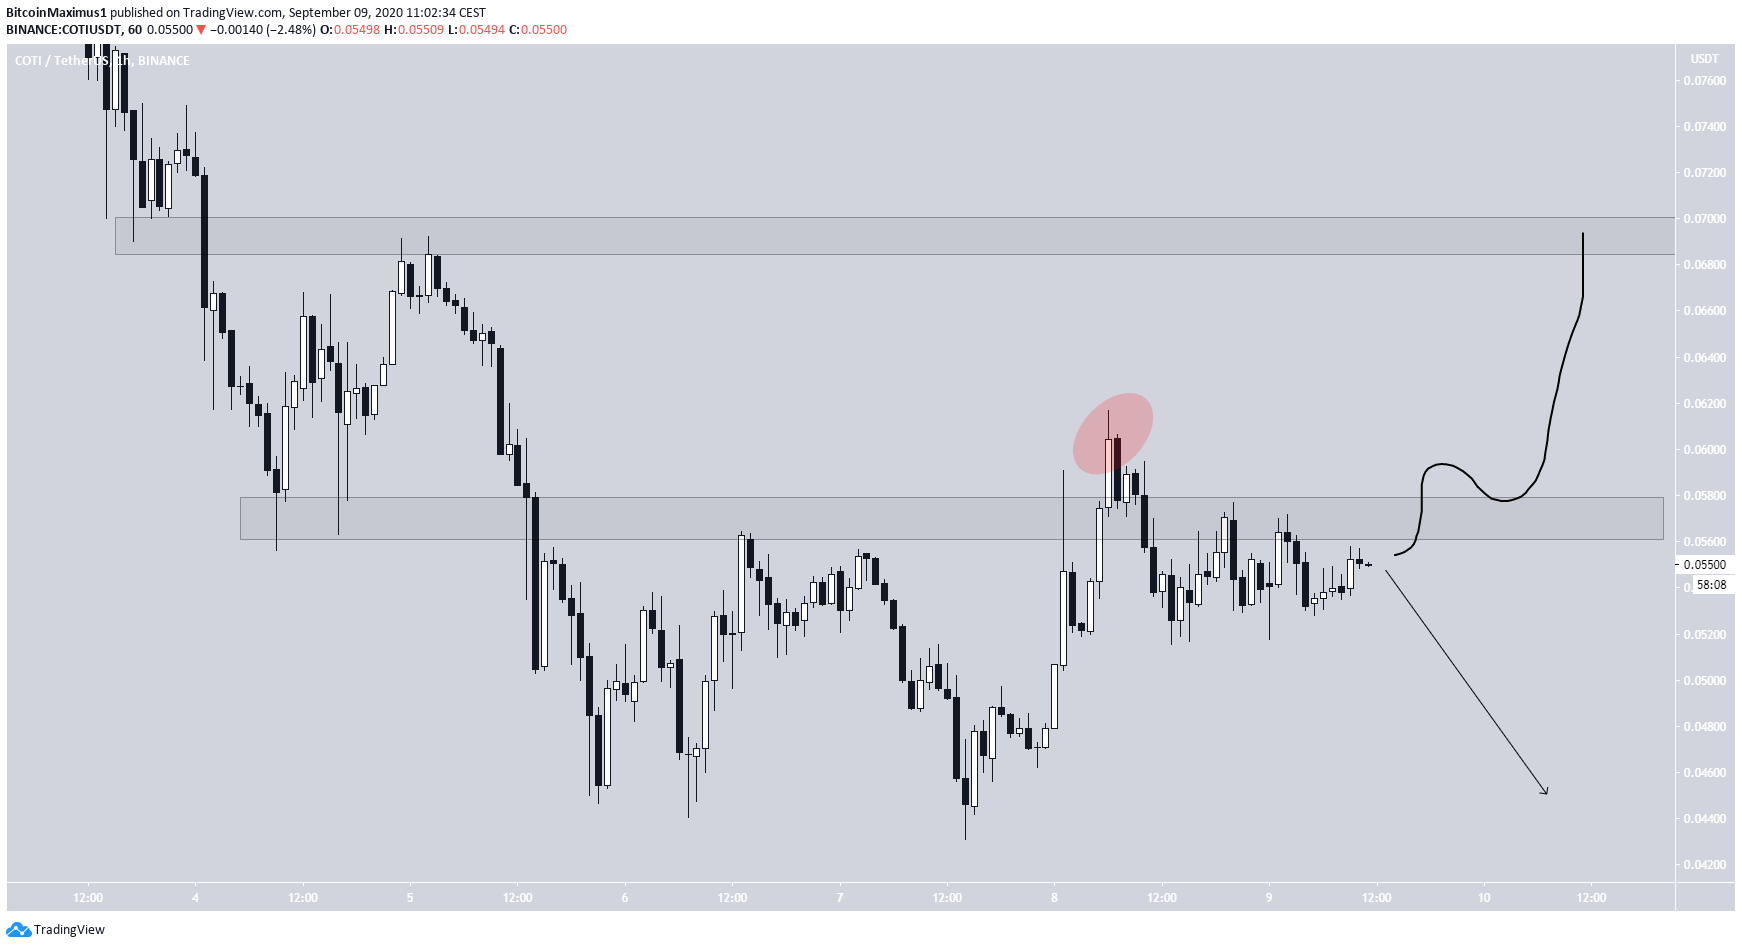
The short-term chart shows that while the price broke out from the range-high at $0.057, it fell right back below it, making the previous movement only a deviation. The $0.057 area is now expected to act as resistance.
Unless the price manages to break out above this level and validate it as support afterward, it seems that it will first fall back towards its long-term support area.
Wave Count
Beginning on March 13, we can outline a five-wave formation for COTI (shown in black below), in which the third wave has extended (blue). If the count is correct, the price is currently in wave 4, which would be expected to end near the long-term support at $0.035.
The area is also strengthened by the ascending support line drawn through the lows of waves 1-2, a line that is should remain intact for the bullish formation to remain valid.
If correct, wave 5 could take the price all the way to $0.11.
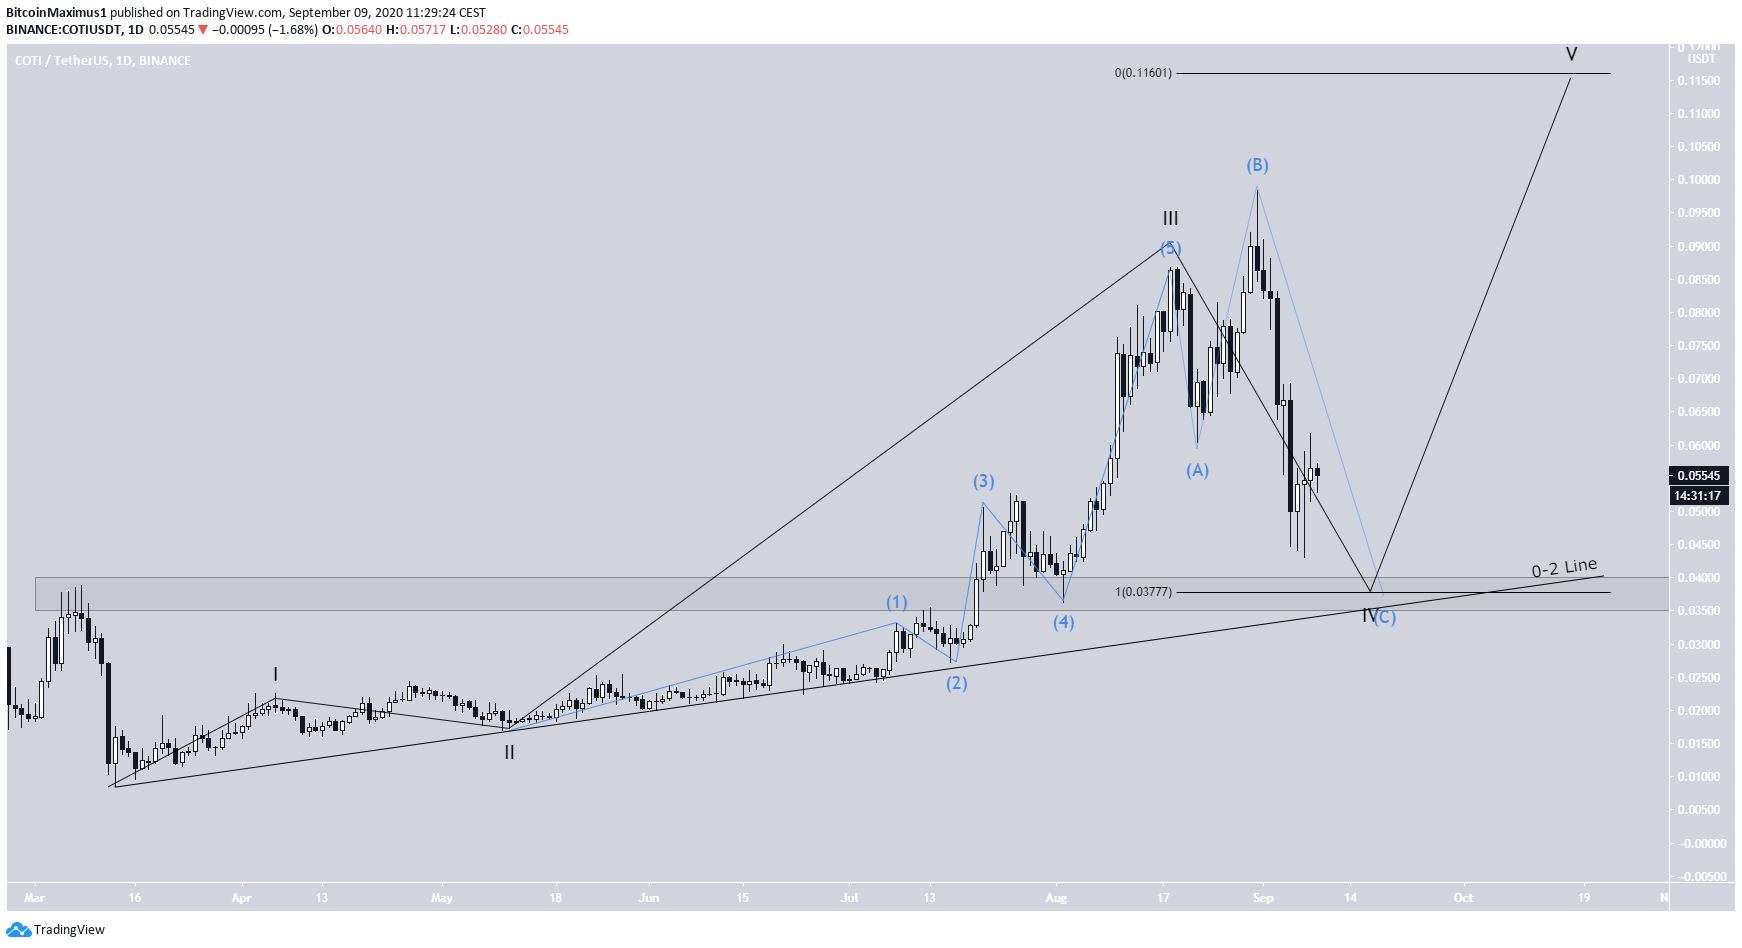
A closer look at wave 4 reveals that it is likely transpiring in an expanded flat, A-B-C correction (blue). If so, the price has one more wave down to go before eventually resuming its upward movement.
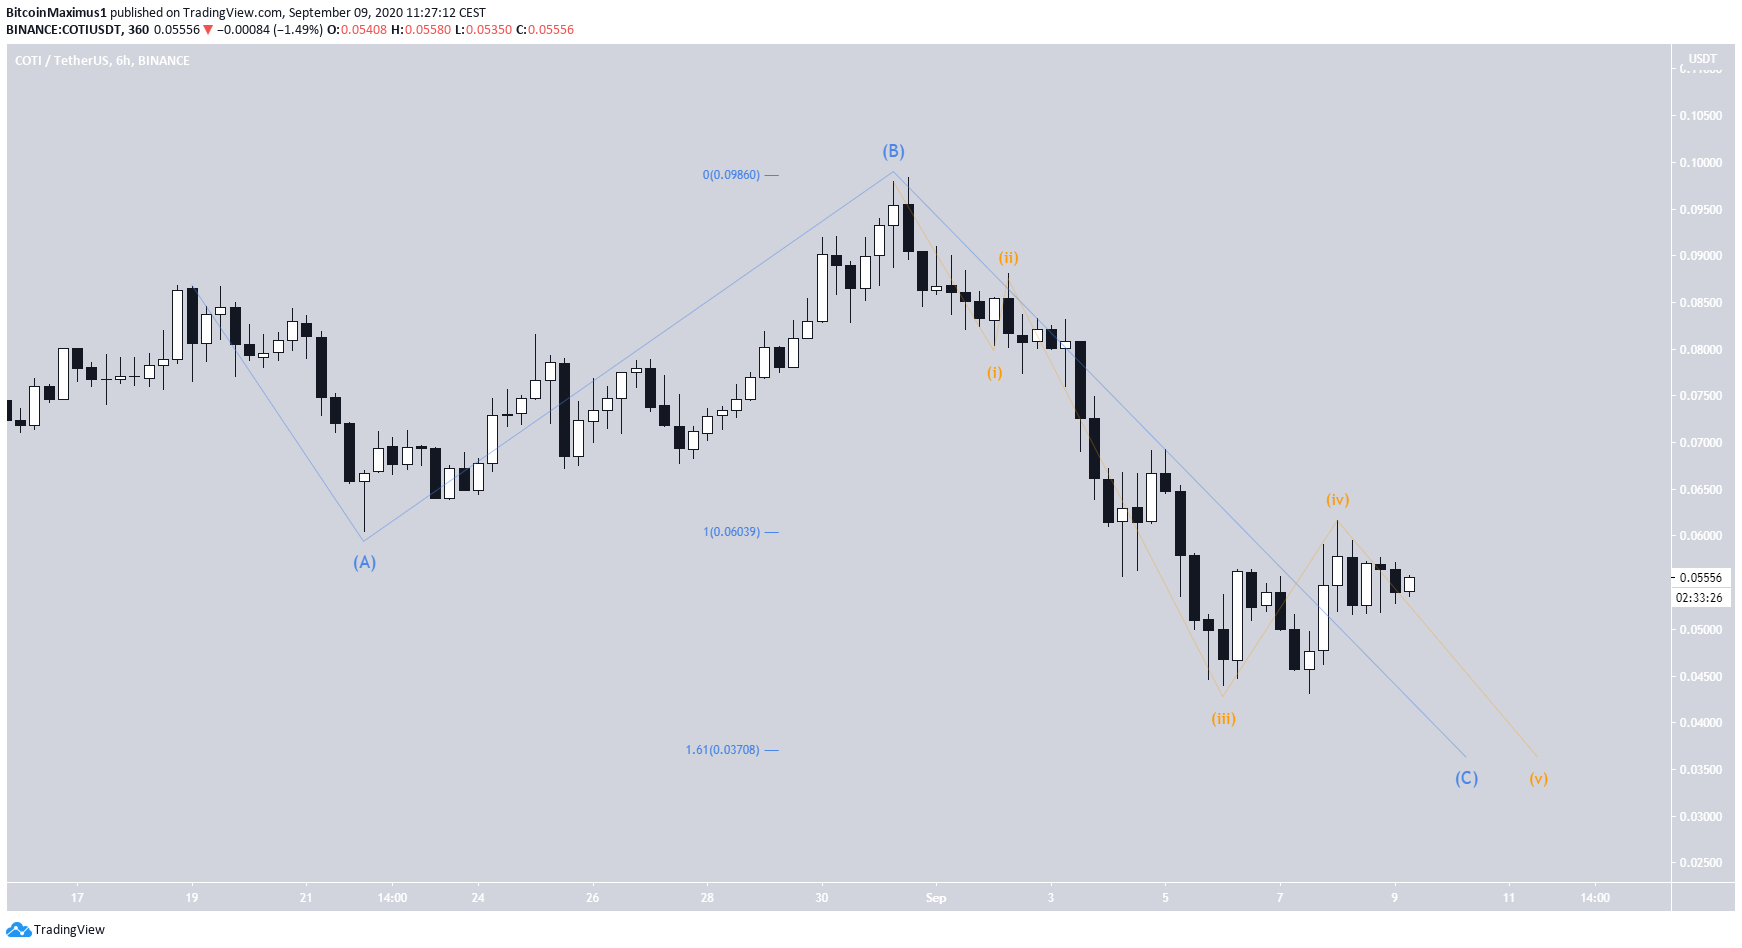
To conclude, the COTI price is expected to drop towards the $0.035 support before bouncing back up to resume its bullish movement.
For BeInCrypto’s latest Bitcoin (BTC) analysis, click here!
