


The COTI price has bounced from an important support level, temporarily halting its ongoing downward move.
The price should continue moving upwards towards the resistance levels outlined below.
Retracement to Support
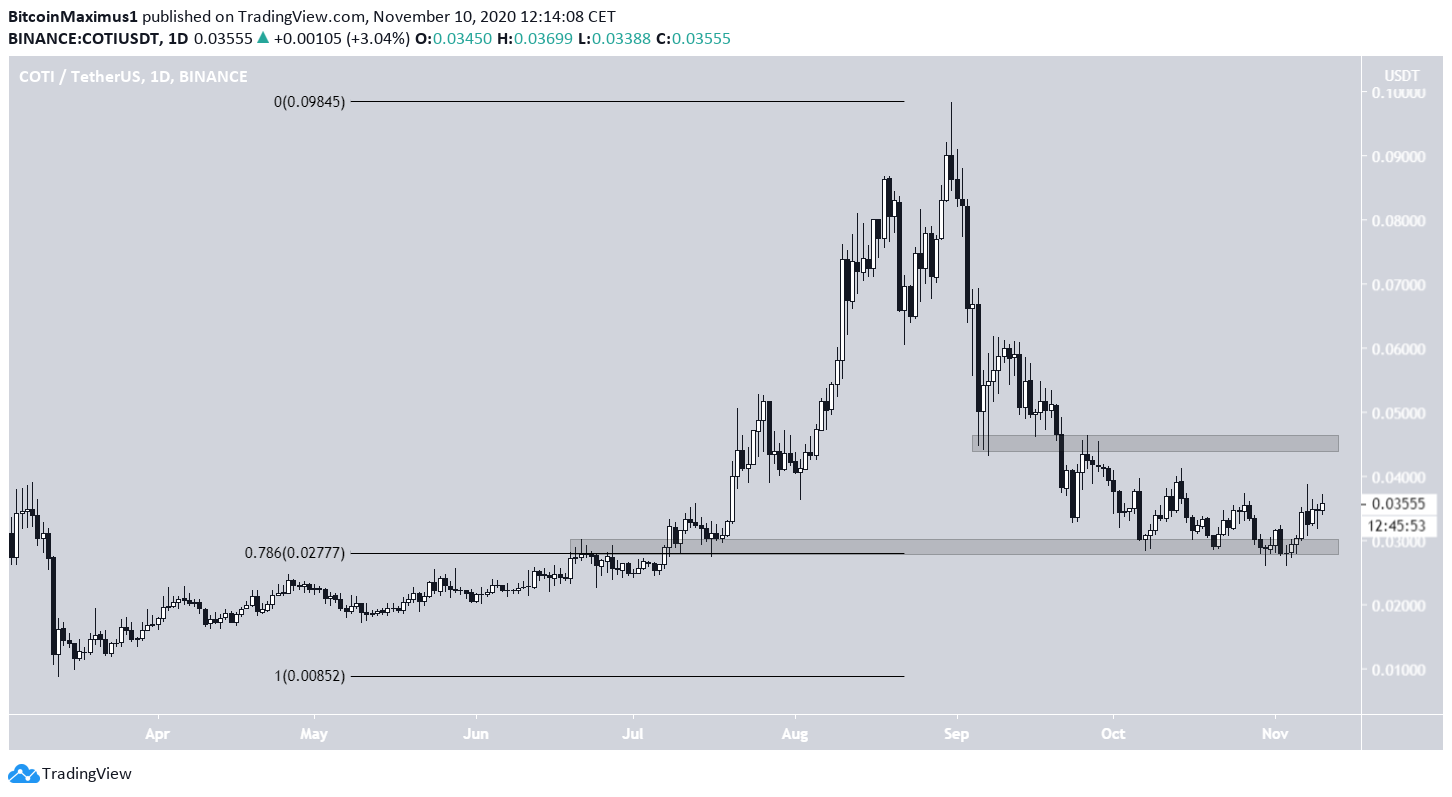
The COTI price has been falling since Aug 31, when it reached a high of $0.098. The decline has been swift, not allowing for a significant upward retracement.
Since the beginning of Oct, the price has been trading near $0.03. The main support area is found at $0.028, the 0.786 Fib level of the entire upward move, while the closest resistance is at $0.0455.
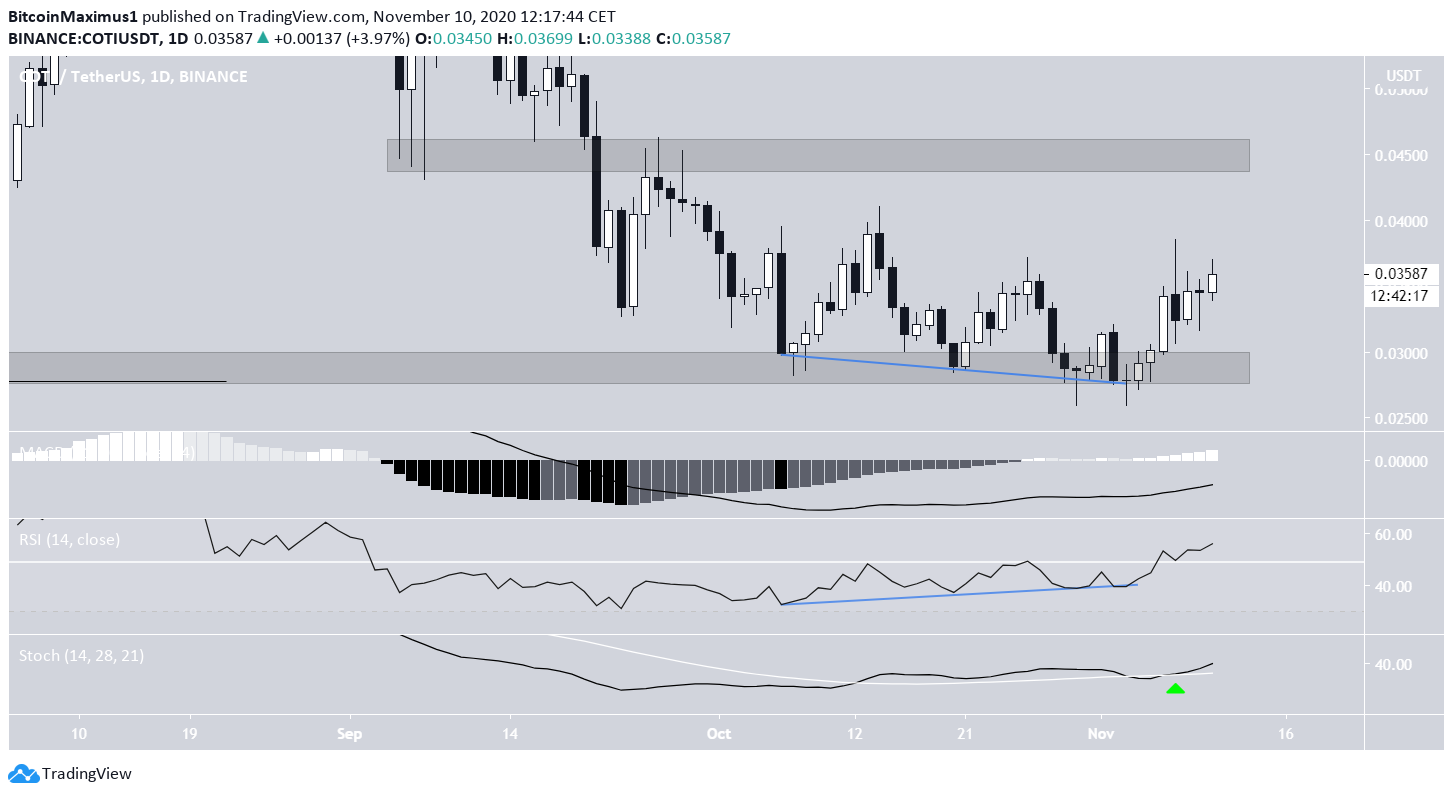
Technical indicators are bullish. The Daily RSI has formed considerable bullish divergence and moved above 50, the MACD histogram is positive and the Stochastic Oscillator has made a bullish cross.
Therefore, the price is likely to continue moving upwards towards the previously mentioned resistance area.
Current Move
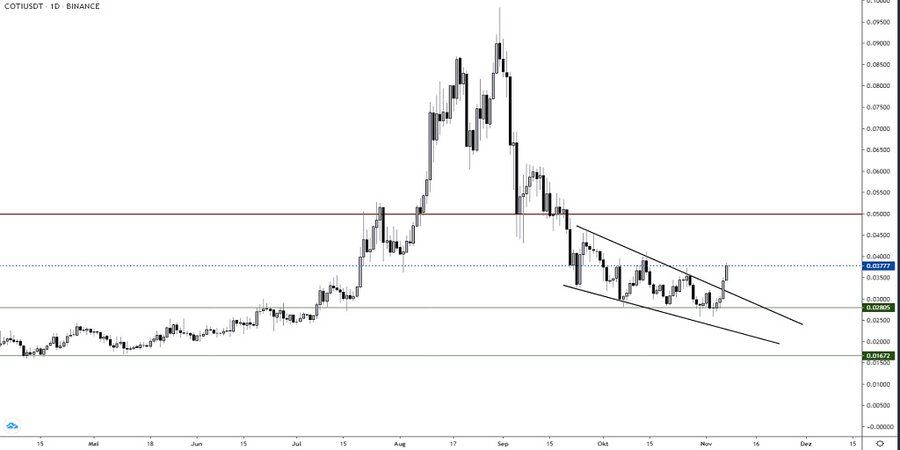
Cryptocurrency trader @The_Flash_G outlined a COTI chart, which shows an ongoing breakout from a descending wedge, targeting $0.05, just slightly above the previously mentioned resistance area.
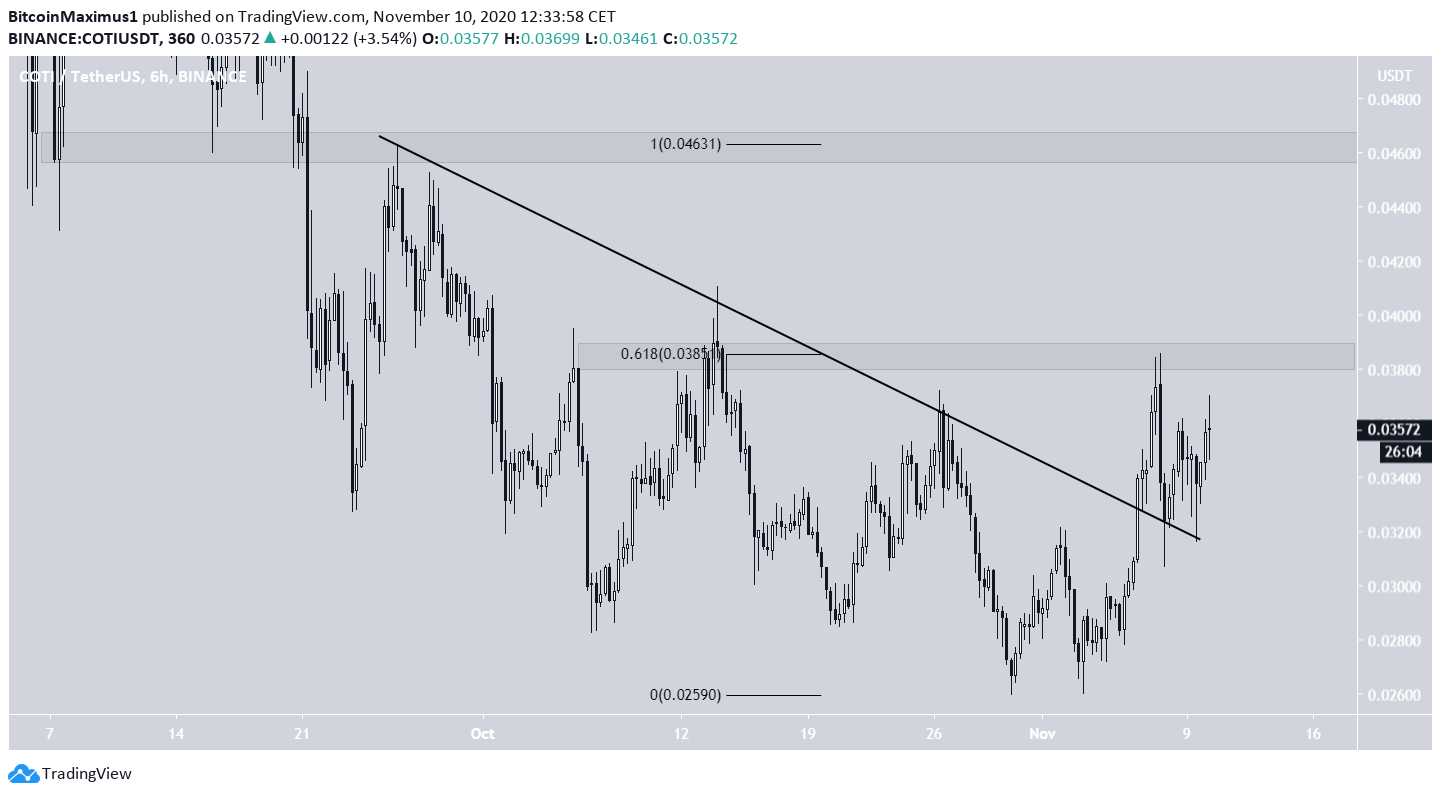
In the shorter-term, the price has indeed broken out from a descending resistance line. but was rejected by the 0.618 Fib near $0.038 and fell to validate the breakout line. It is currently gearing up for another breakout attempt.
If it breaks out, which seems likely, the main resistance area definitely seems to be closer to $0.045 than $0.05, since the former is also the top of the descending resistance line.
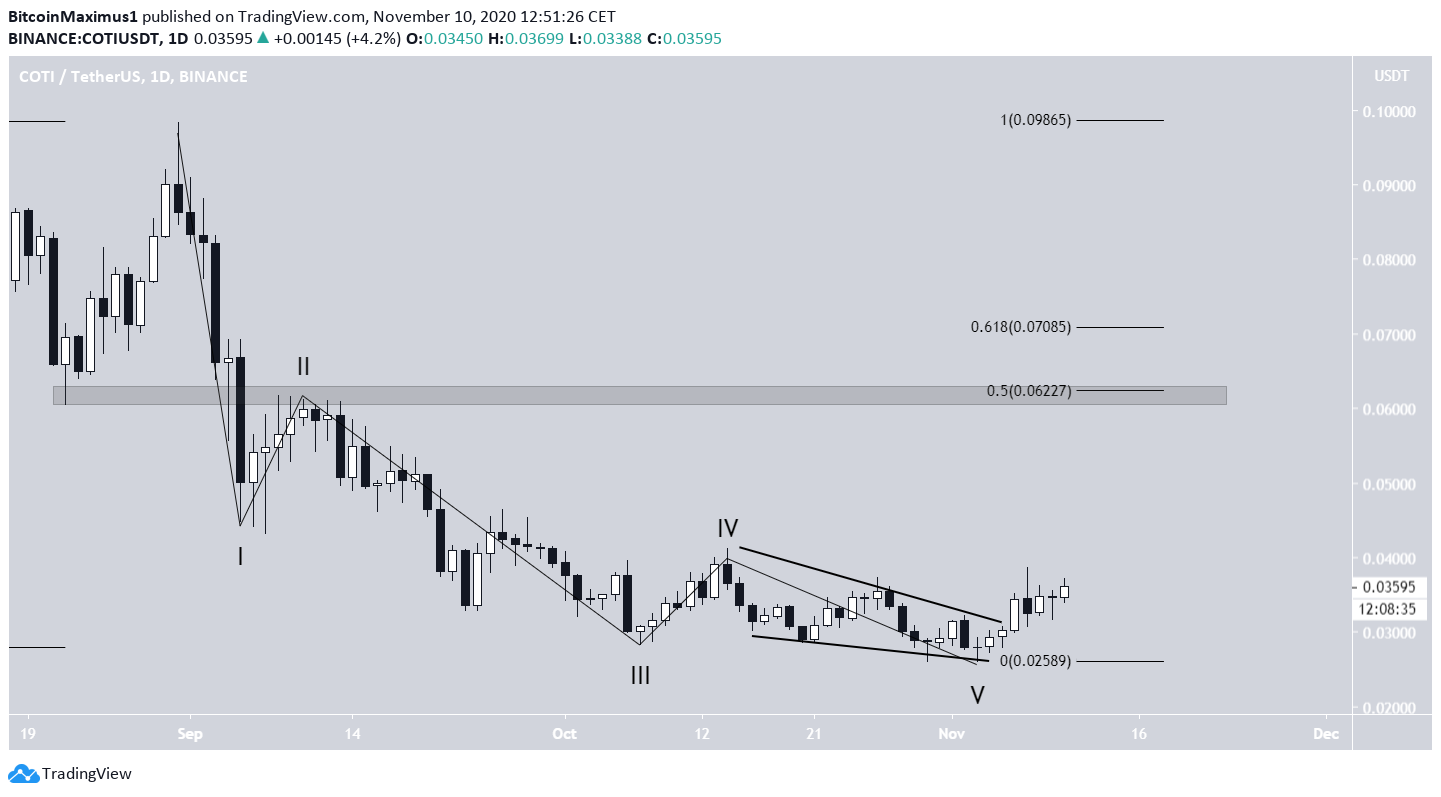
Wave Count
Since the previous high on Aug 31, it seems that COTI has completed a bearish impulse (shown in black below), in which the fifth wave was an ending diagonal.
If correct, the price should retrace upwards, possibly reaching the 0.5 Fib level of the entire downward move at $0.062. A fall below the Nov 3 low at $0.2596 would invalidate this possibility.
Conclusion
To conclude, the COTI price should resume its bounce and gradually continue moving upwards towards the targets given above.
For BeInCrypto’s latest Bitcoin analysis, click here!
Disclaimer: Cryptocurrency trading carries a high level of risk and may not be suitable for all investors. The views expressed in this article do not reflect those of BeInCrypto.


