
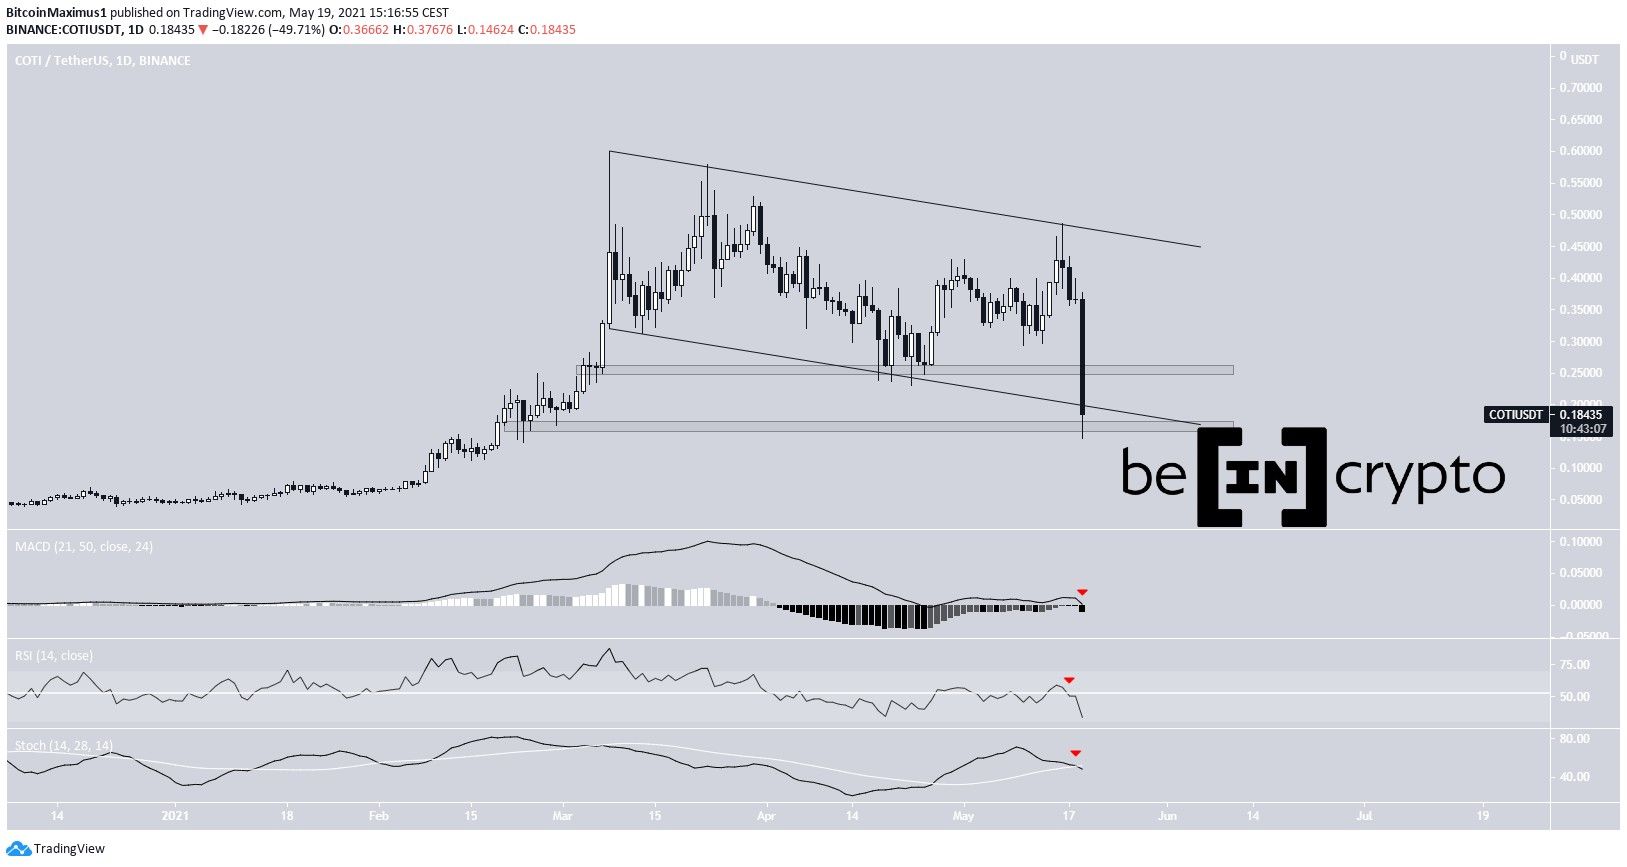
COTI (COTI) has been decreasing alongside a descending channel since it reached an all-time high price of $0.6, on March 8.
It has just reached the support line of the channel and a horizontal support area, but has not shown any bullish reversal signs.
COTI drops to support
COTI has been moving downwards alongside a descending channel since March 8. So far, it has been rejected thrice, most recently on May 16.
Today, it reached the $0.255 support area and broke down. It had not traded below this level since March 2. However, it has yet to reach a daily close below this level.
Afterwards, it reached the $0.165 support area and bounced.
However, technical indicators are bearish. The Stochastic Oscillator has just made a bearish cross. The RSI is below 50 and the ACD is close to turning negative.
Wave count
Cryptocurrency trader @Mesawine1 outlined a COTI chart, stating that it is currently re-testing the resistance line it broke out from.
If it holds, it could continue increasing all the way to $0.80.
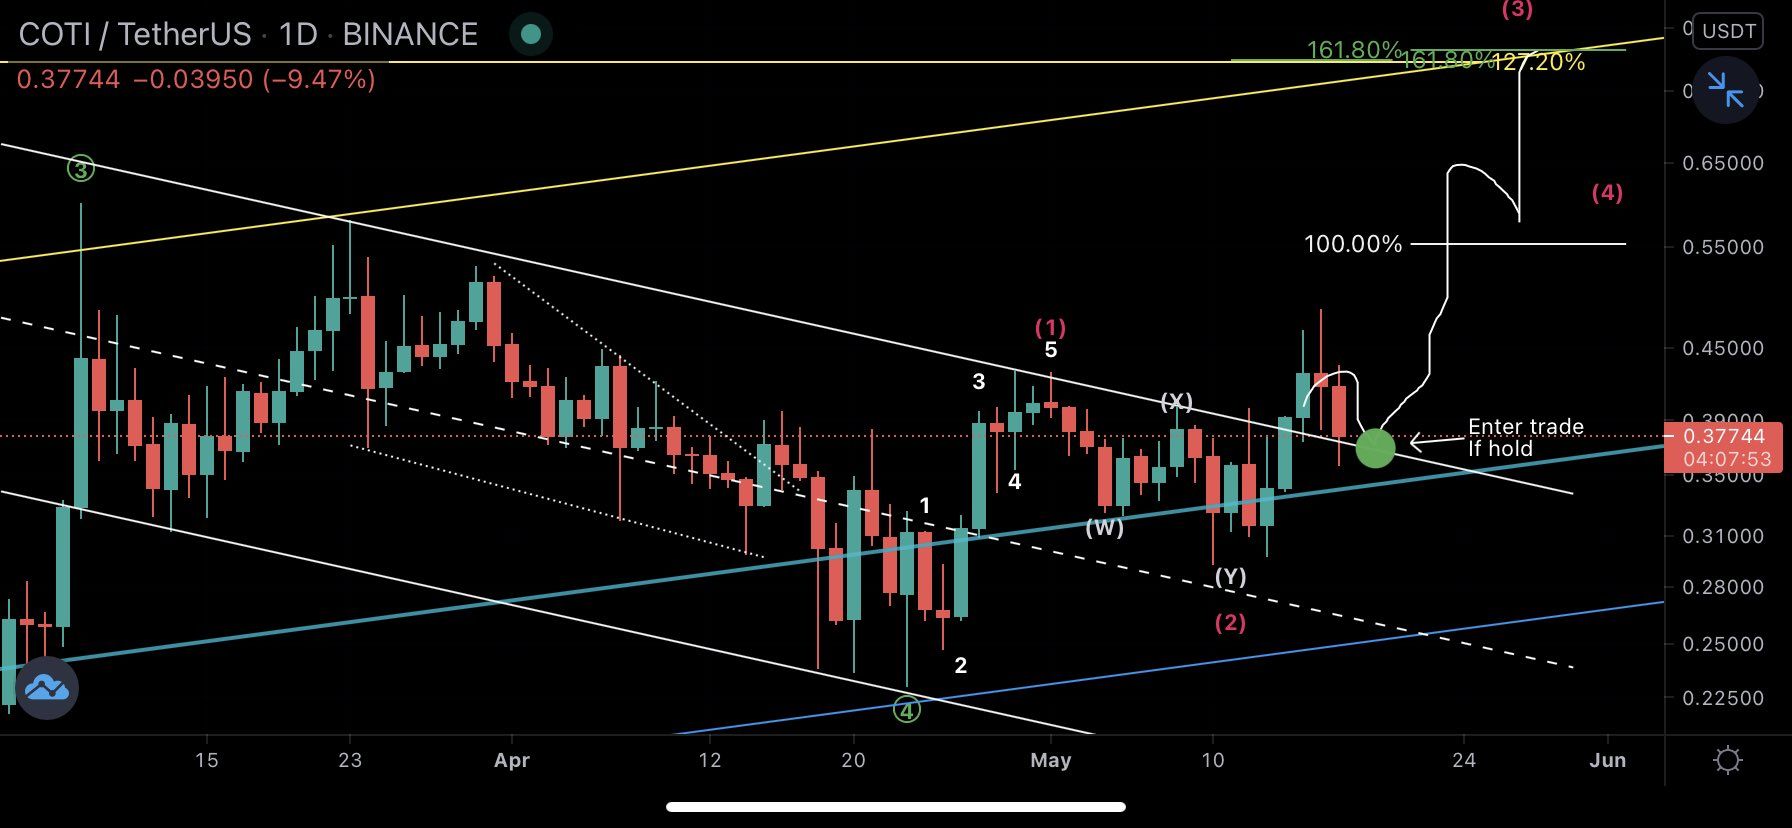
Since the tweet, the price has fallen below the line.
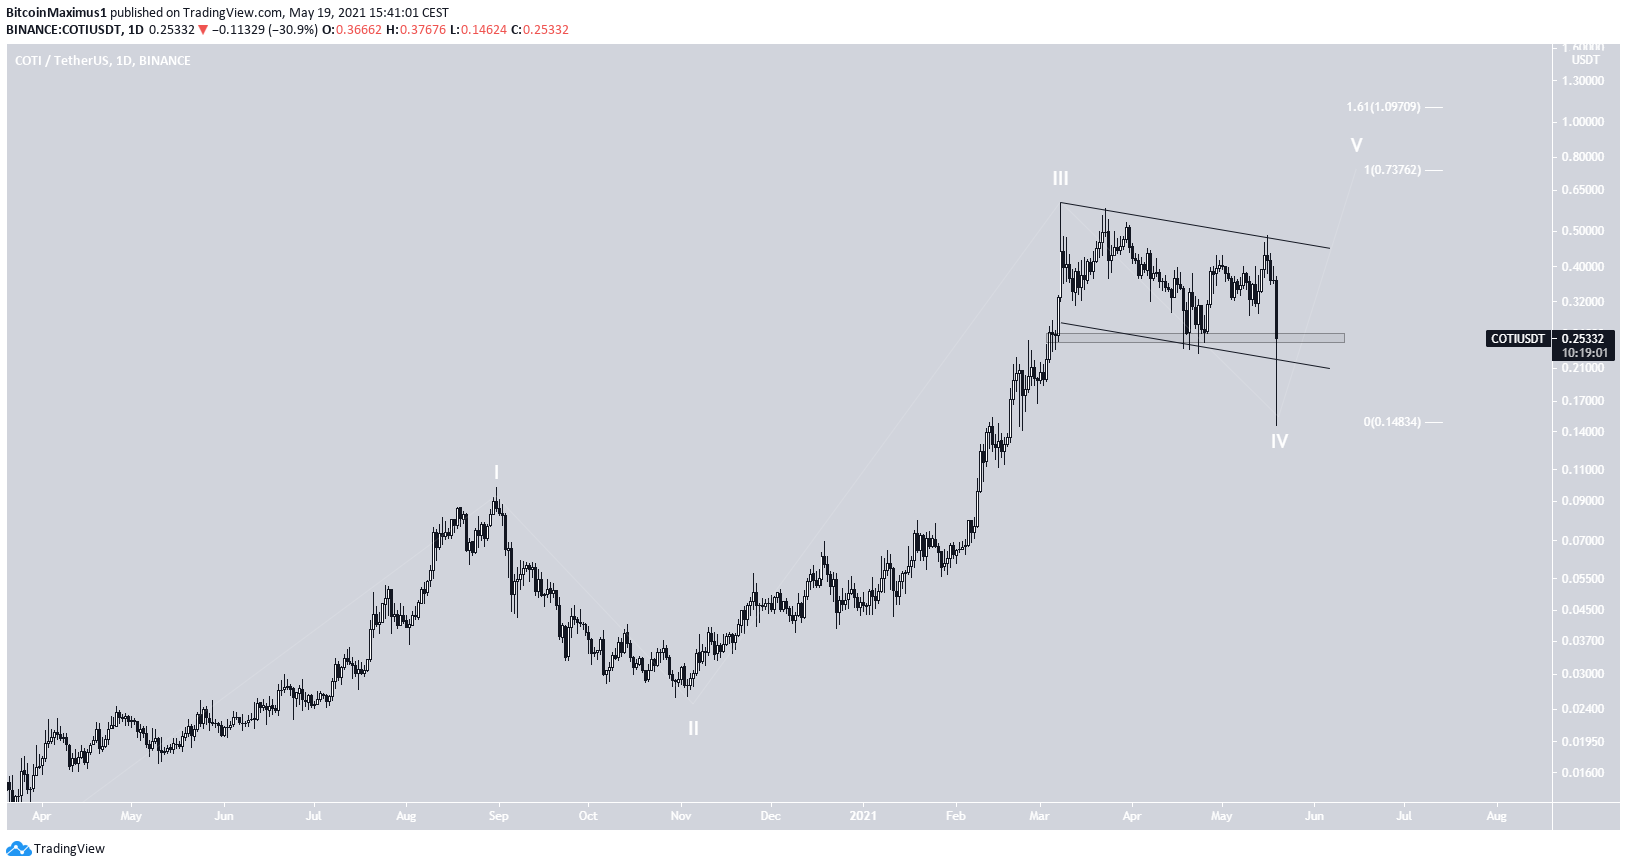
However, the wave count suggests that this was the bottom of wave four (white) of a five wave bullish impulse that began in April 2020.
If correct, the most likely target for the top of the entire move would be found at $0.73. Afterwards, the next one is at $1.07. The targets are found by using a Fib projection on waves 1-3.
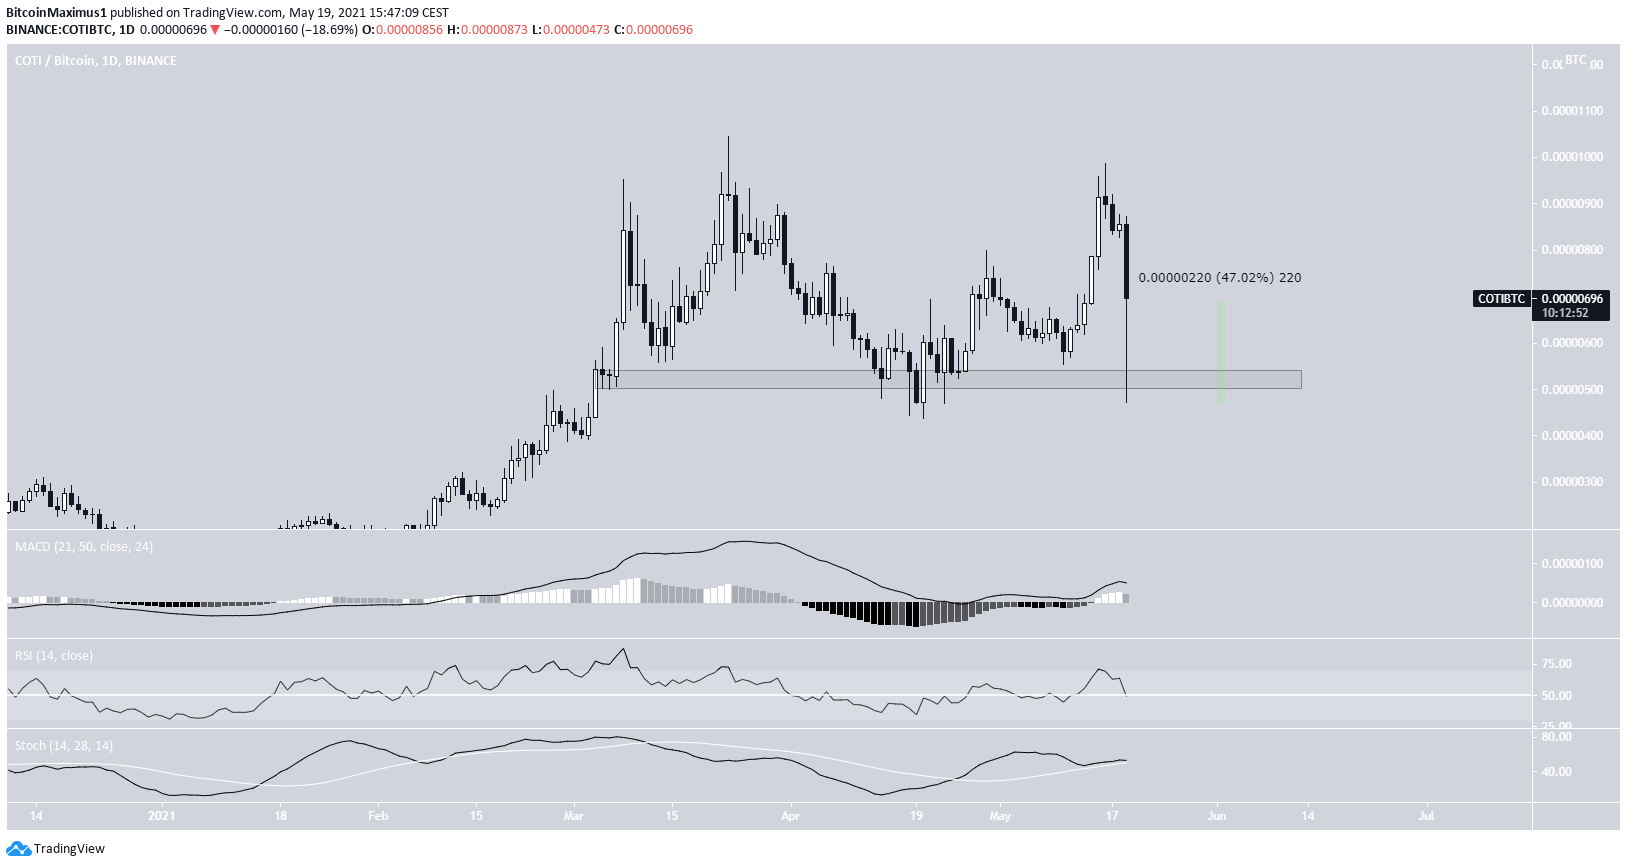
COTI/BTC
The COTI/BTC chart shows a significant bounce that occurred at the 520 satoshi support area. The lower wick already has a magnitude of 47%.
In addition, technical indicators are still bullish.
Therefore, the trend can still be considered bullish as long as the price is trading above this area.
To conclude, it is likely that COTI has completed its correction and will soon begin wave five. This would be confirmed by a reclaim of the $0.255 area.
For BeInCrypto’s latest bitcoin (BTC) analysis, click here.
