


The COTI price is in the process of breaking out from a resistance area that has been in place for the past 150 days.
Technical indicators and the short-term price action support the possibility of a breakout for COTI, which could further accelerate the rate of increase.
Potential Breakout
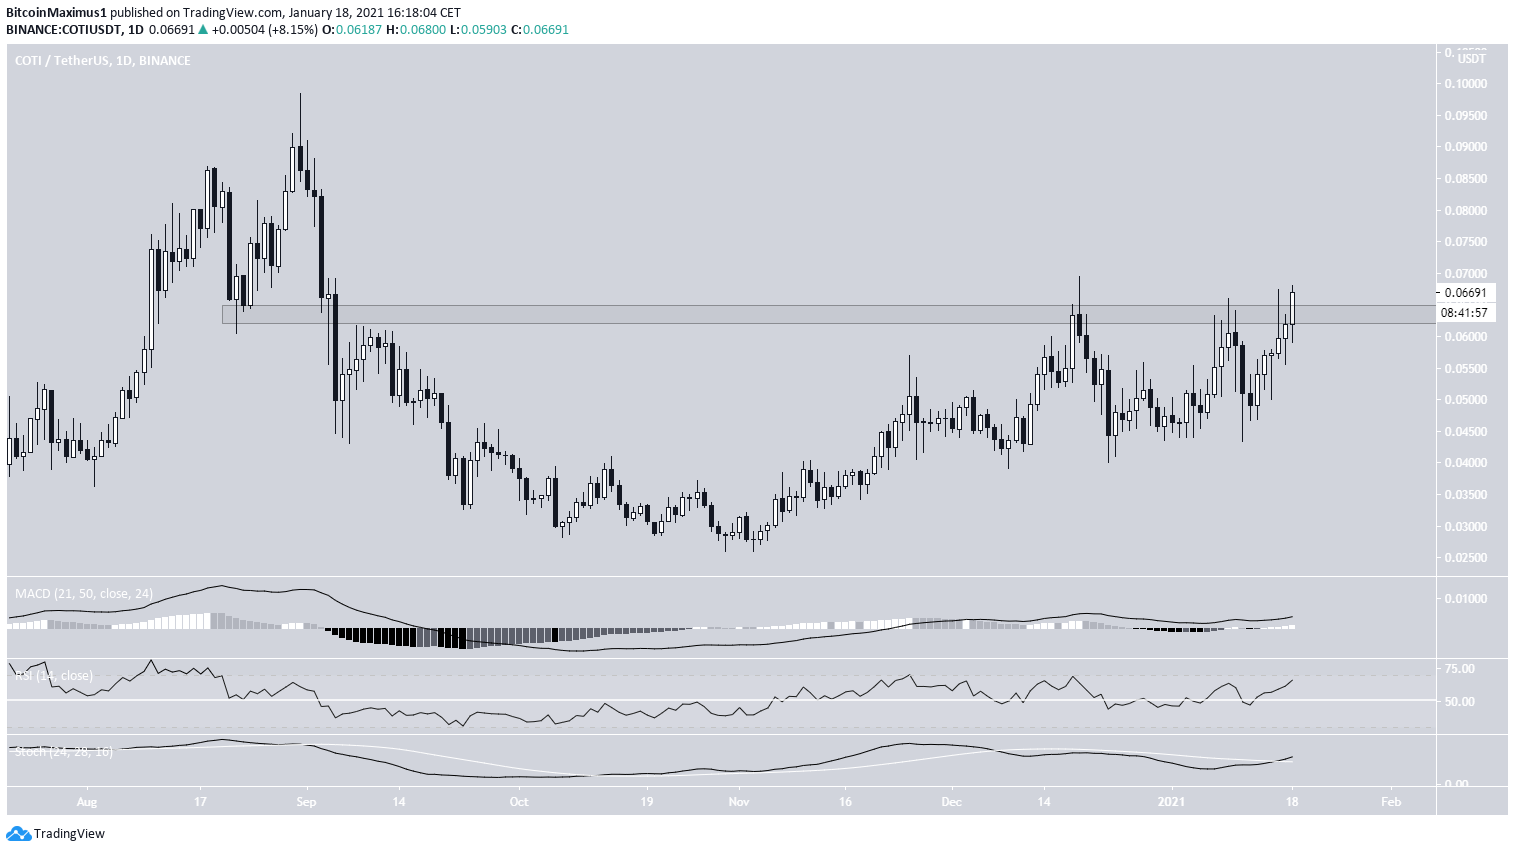
COTI has been moving upwards since it reached a low of $0.026 on Oct. 30. The upward move stalled once the price reached the $0.064 resistance area on Dec. 18, 2020, which caused a temporary rejection.
However, COTI regained its footing and is currently in the process of moving above this area. A daily close above $0.064 would confirm a breakout.
Technical indicators on the daily time-frame are bullish, supporting this possibility. If one occurs, there would be virtually no resistance until the $0.09 highs of Aug. 2020, potentially paving the way for a new all-time high price above $0.098.
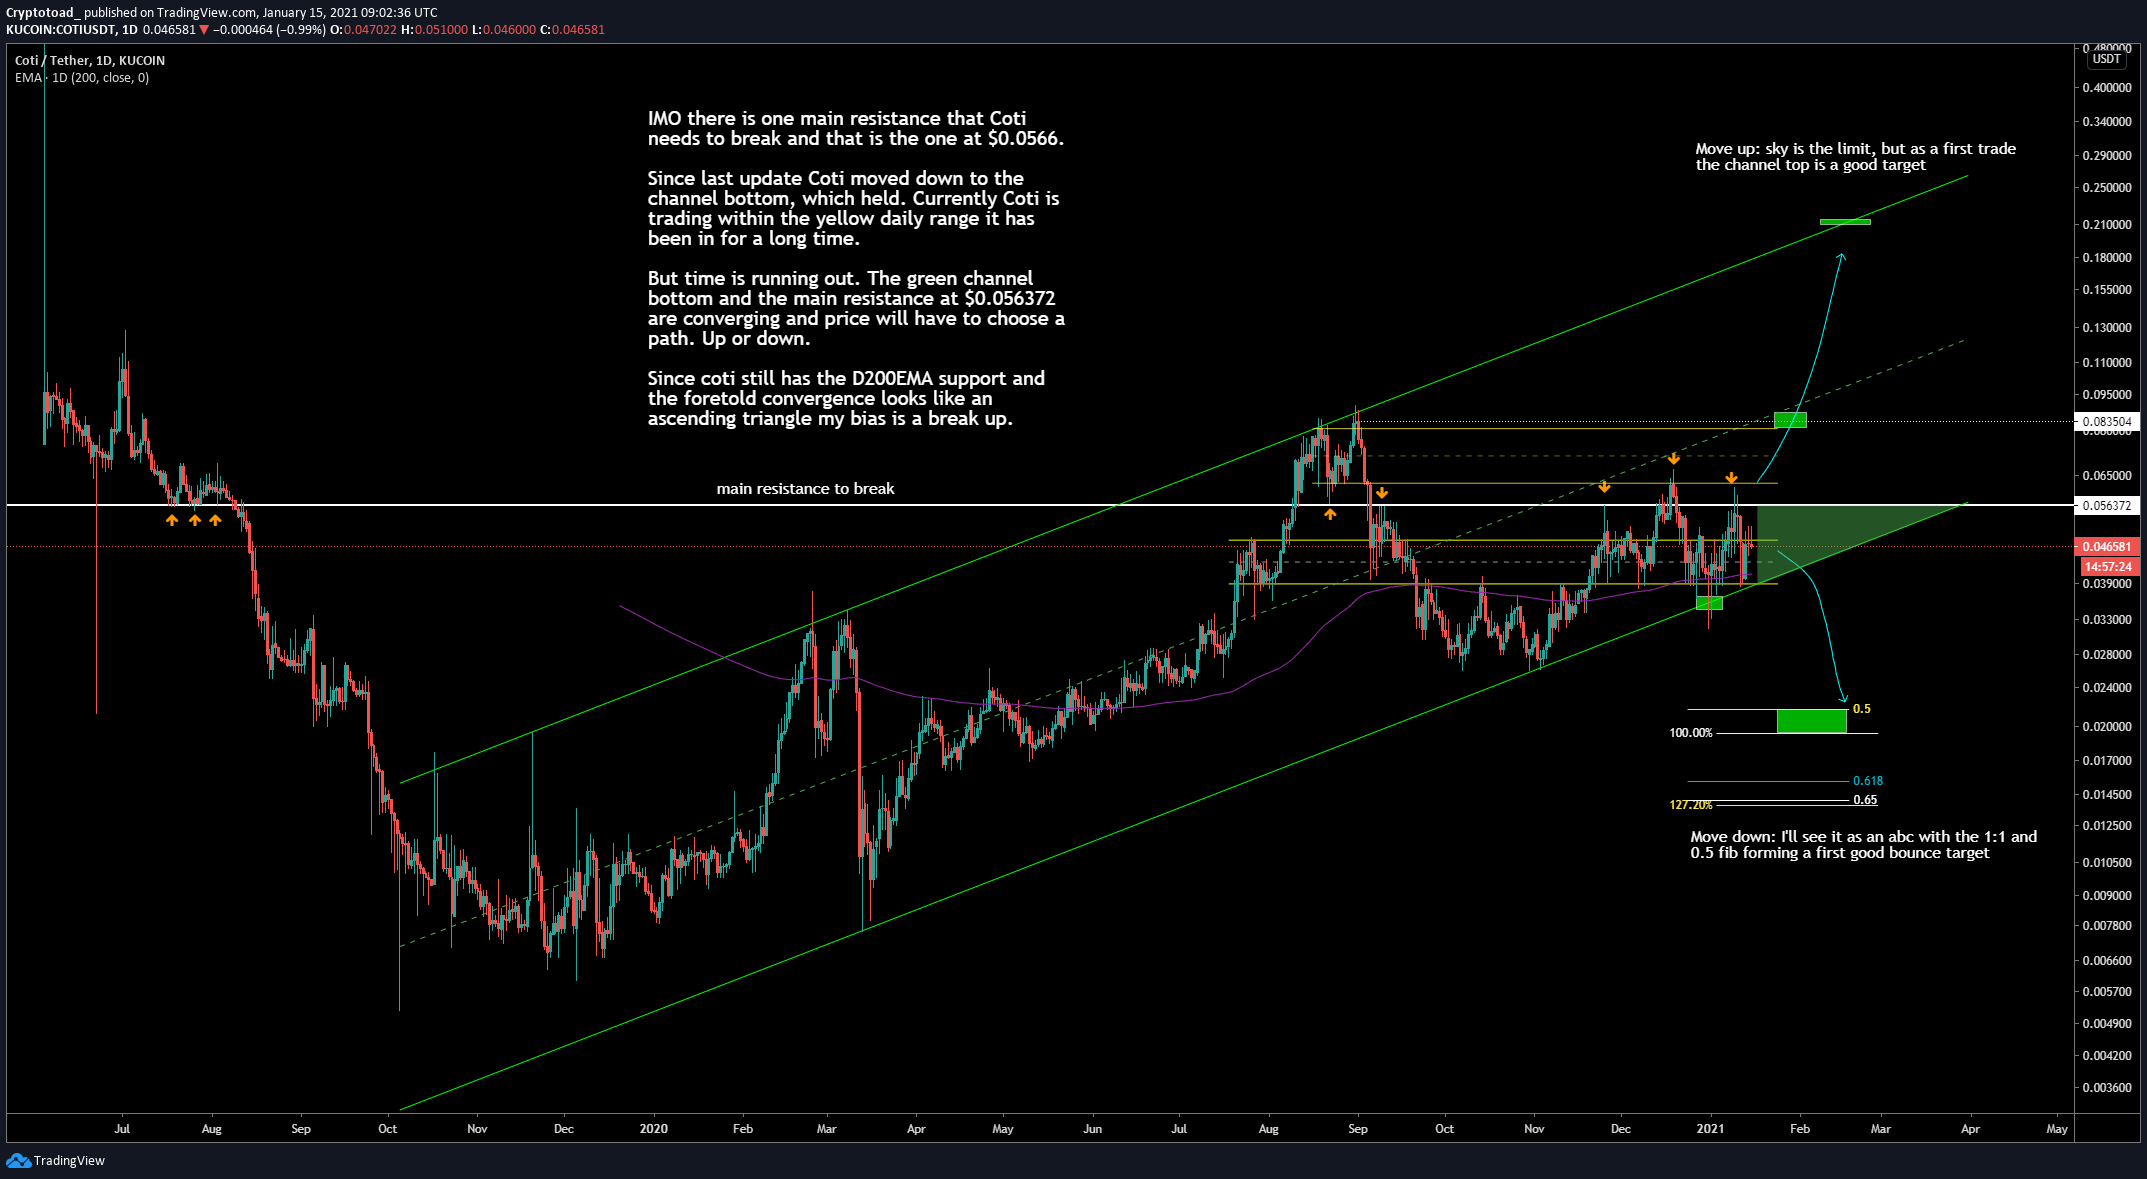
Cryptocurrency trader @Mesawine1 outlined a chart stating that if COTI manages to clear the $0.064 resistance area, it’s likely to move upwards at an accelerated rate and break out above $0.1.
Future Movement
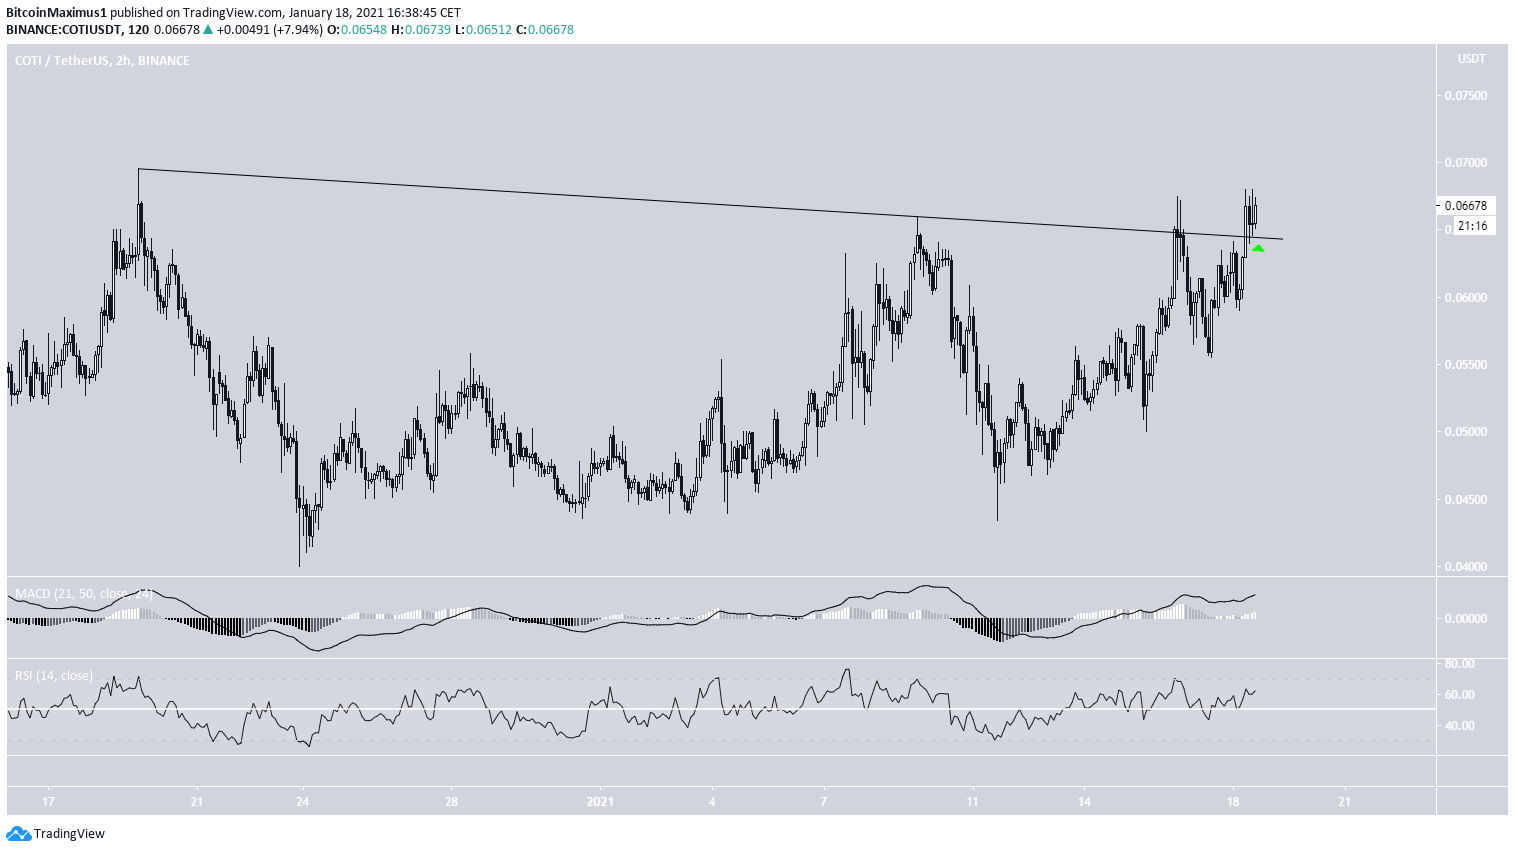
The shorter-term two-hour chart supports the possibility of a breakout from the resistance area since it shows that the price has already broken out from a descending resistance line and validated it as support.
Furthermore, technical indicators suggest that the upward momentum will continue. Therefore, COTI should gradually increase towards $0.09 and possibly break out towards an all-time high.
COTI/BTC
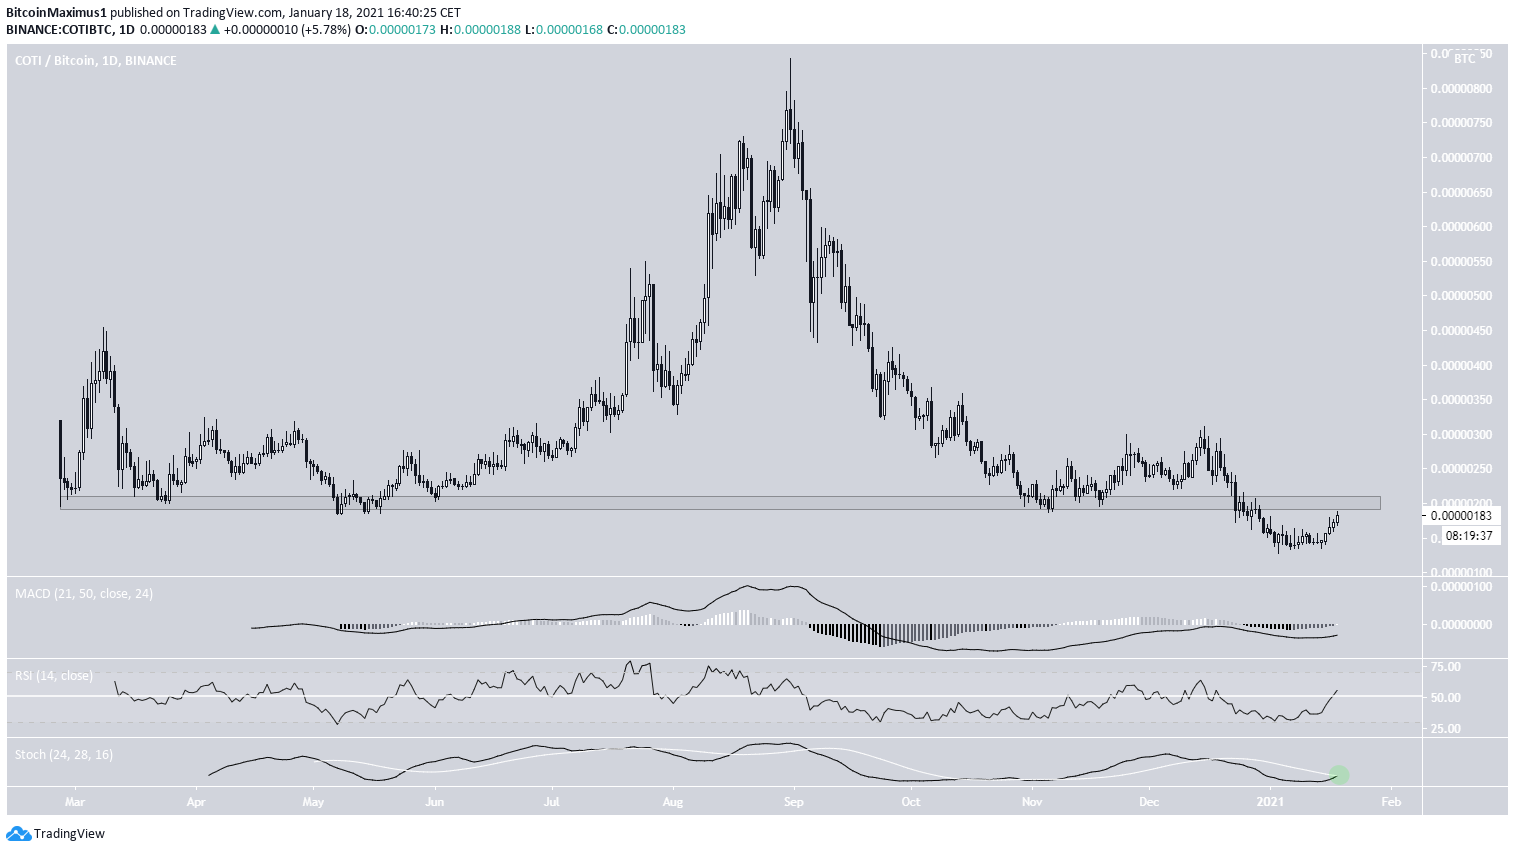
The movement for COTI/BTC is not nearly as bullish since COTI has been falling since Aug. 31, 2020. It reached an all-time low of 128 satoshis on Jan. 3.
While technical indicators are bullish, COTI is still trading below the 200 satoshi area, which is the breakdown level that leads to the all-time low.
Until it manages to reclaim it, the trend cannot be considered bullish.
Conclusion
To conclude, a daily close above $0.064 would confirm that COTI has broken out above its resistance area and will rally towards a new all-time high price. The same thing is true for the COTI/BTC pair and the 200 satoshi resistance area.
Technical indicators on the daily time-frame substantiate the possibility of a breakout for both pairs.
For BeInCrypto’s latest Bitcoin (BTC) and altcoin analyses, click here!
Disclaimer: Altcoin trading carries a high level of risk and may not be suitable for all investors. The views expressed in this article do not reflect those of BeInCrypto.


