
Although Cosmos (ATOM) has reclaimed two important support levels, the move still appears to be corrective rather than impulsive.
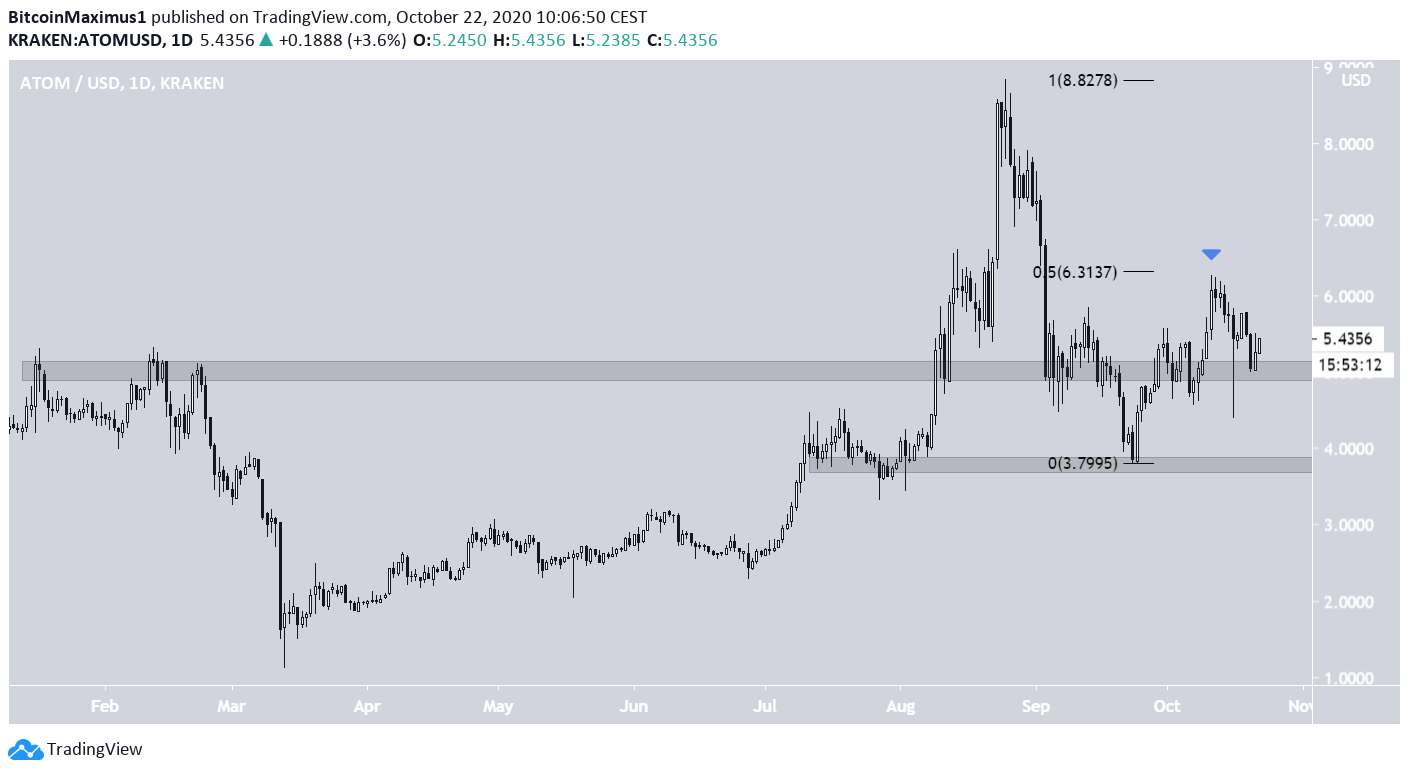
The ATOM price has, for the most part, been steadily decreasing since Aug 25 after reaching a high of $8.84. It dropped back to $3.80 in September but has bounced back slightly to the mid-$5 range.
ATOM Revisits Support
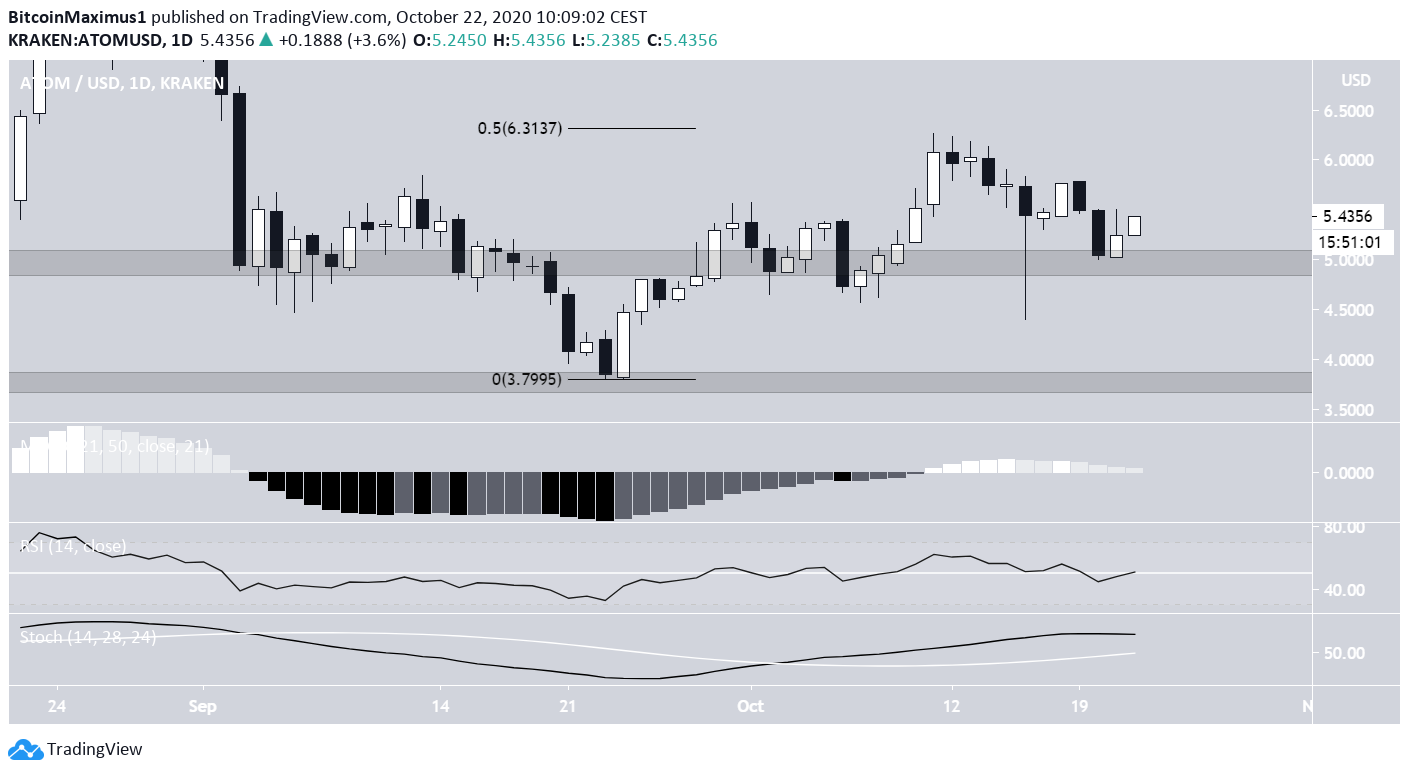
The two main support levels are found at $3.80 and $5, and the price is currently trading above both.
The aforementioned increase stopped once the price reached the 0.5 Fib level of the previous downward move at $6.31, raising the possibility that the increase was corrective.
Despite the upward move and validation of the support level, technical indicators are undecided. The MACD is positive but decreasing, as is the Stochastic oscillator. The RSI is at the 50-line, normally indicative of consolidation.
Short-Term Resistance
The ATOM price has been following a descending resistance line since it reached a local high of $6.31 on Oct 11. The line has been validated four times up to this point.
While the price bounced and is in the process of making another breakout attempt, the movement could also be a validation of the $5.40 area as resistance.
A breakout from this resistance line would likely take the price to $6.25, while rejection could take it back to $5.
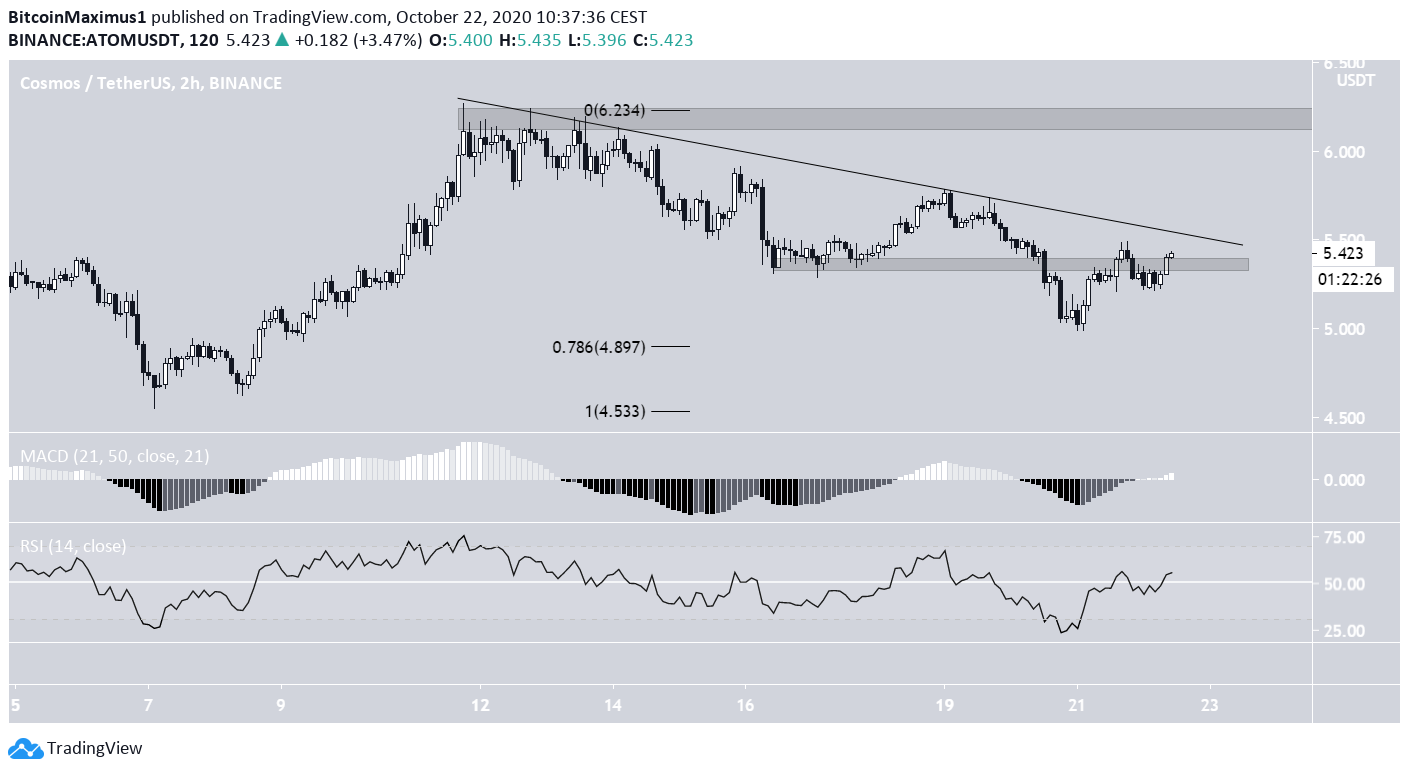
Technical indicators are undecided, slightly leaning on bearish.
Wave Count
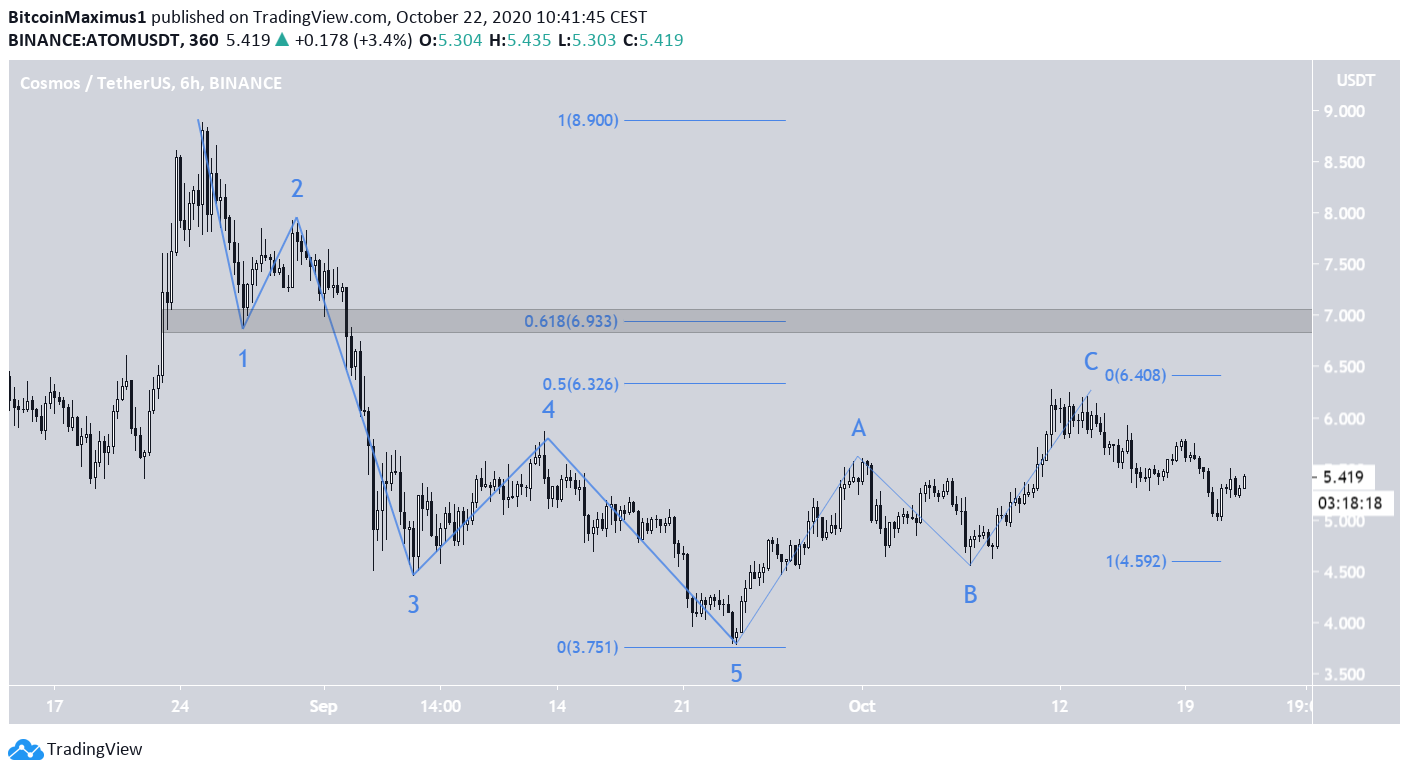
Since the aforementioned Aug 25 high, the ATOM price seems to have completed a bearish five-wave impulse (shown in blue below).
Since then, the price has also completed or is nearing the top of an A-B-C corrective structure. With the current top, the A:C waves have a 1:1 ratio, which is common in such corrections.
Until the price breaks out above the $6.93 area (the 0.618 Fib level of the downward move and a previous support area), the current increase is likely to be a correction rather than the beginning of a new upward move.
ATOM/BTC
Cryptocurrency trader @Lomahcrypto outlined an ATOM chart, which shows a possible inverse head-and-shoulders (H&S) pattern, which could take the price all the way to 65,000 satoshis.
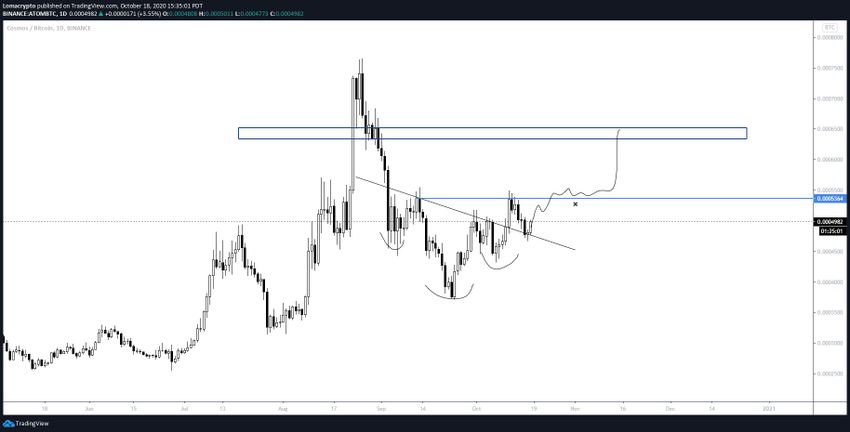
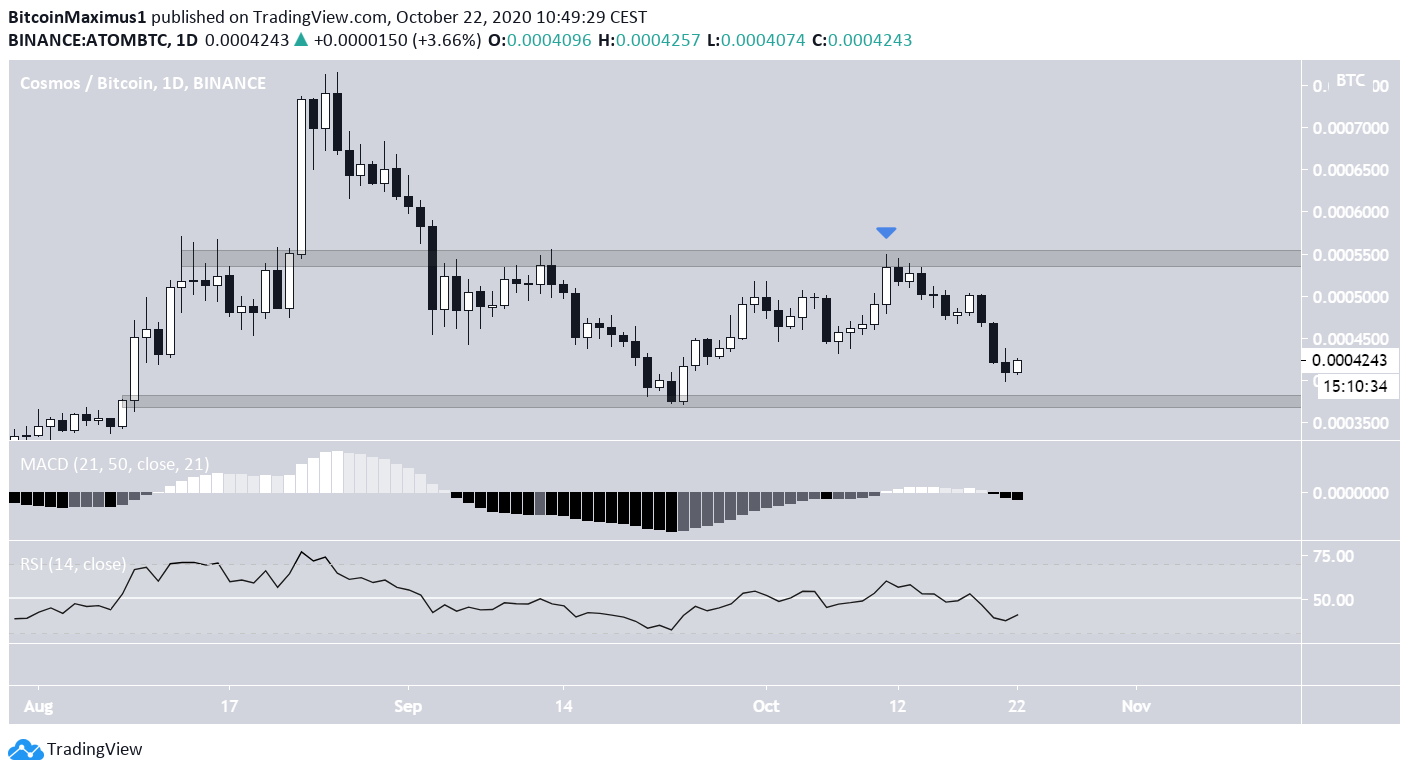
However, the price has been rejected by the 54,500 satoshi area since the tweet and has dropped considerably, invalidating the possibility of an inverse H&S pattern.
There are no bullish reversal signs, and the price is expected to decrease at least to the 37,000 satoshi support level.
For BeInCrypto’s latest Bitcoin analysis, click here!
Disclaimer: Cryptocurrency trading carries a high level of risk and may not be suitable for all investors. The views expressed in this article do not reflect those of BeInCrypto.
