


The Cosmos (ATOM) price began a reversal on March 10 and is now approaching a long-term resistance level.
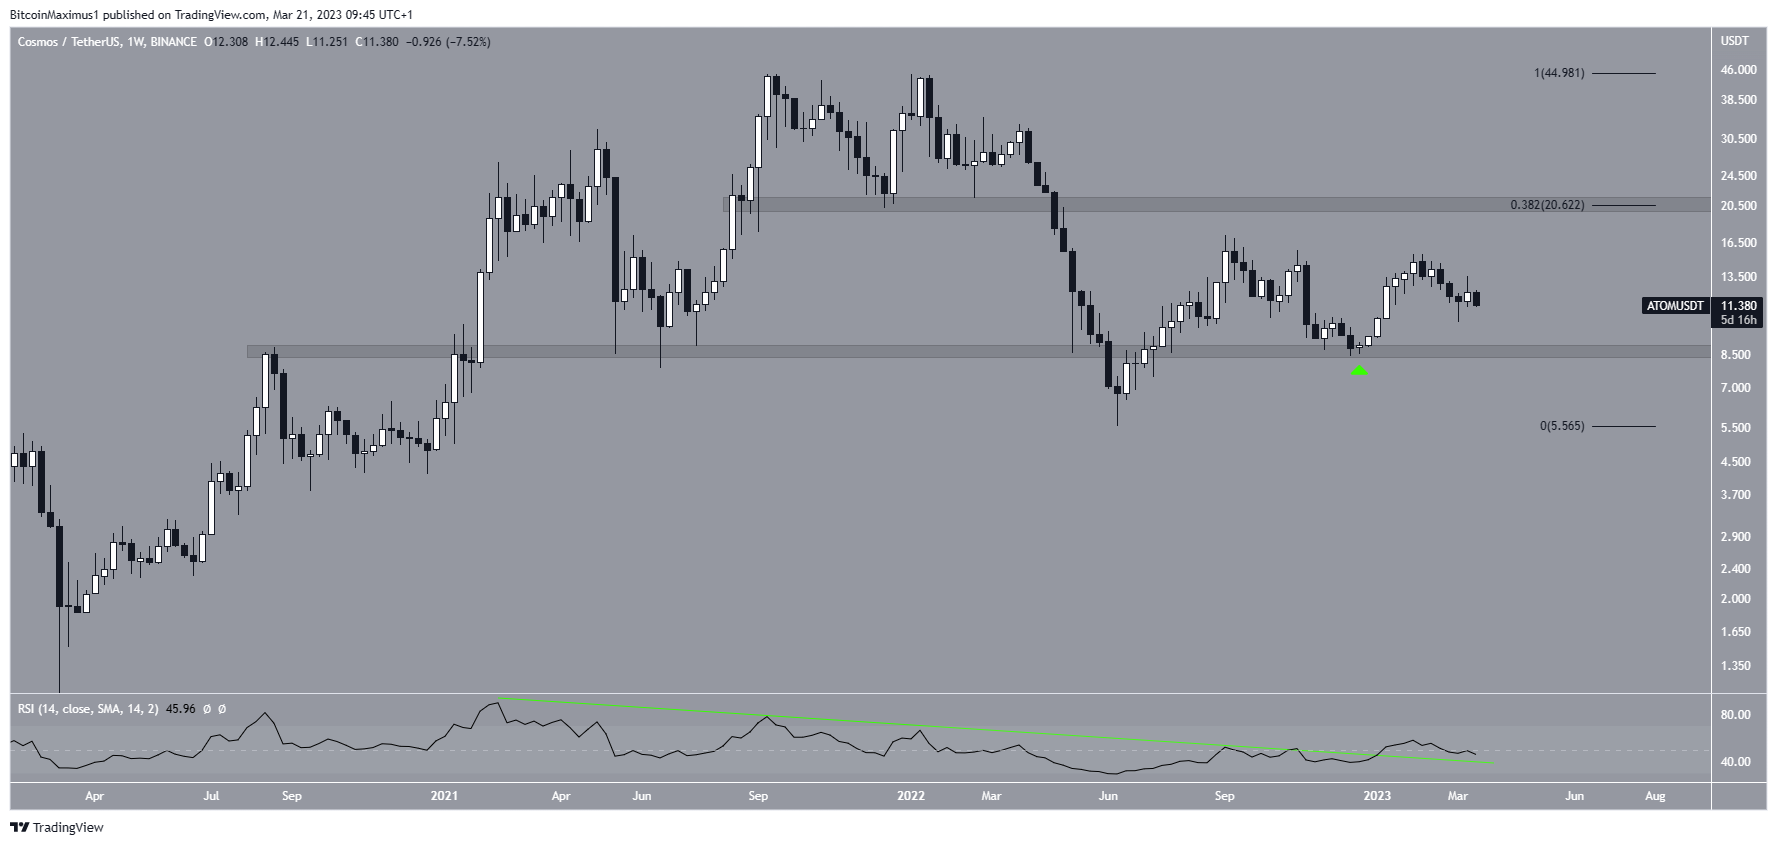
ATOM is the native token of the Cosmos ecosystem, which aims to serve as an internet of blockchains. The weekly time frame outlook for ATOM is mixed. The price has fallen since reaching an all-time high of $46.68 in September 2021. The decrease culminated with a low of $5.54 in June 2022.
However, the price has increased since, reclaiming the $9 area and validating it as support in December of the same year, creating a higher low in the process (green icon).
While this is considered a bullish development, and the weekly RSI has not broken its bearish divergence trend line (green), the indicator fell below 50 shortly afterward. Therefore, the bullish reversal is not confirmed yet.
In any case, if the upward movement continues, the closest resistance area would be at $21.30, created by the 0.382 Fib retracement resistance level and a horizontal resistance area. The level has not been reached since February 2022.
Cosmos (ATOM) Price Completes Correction
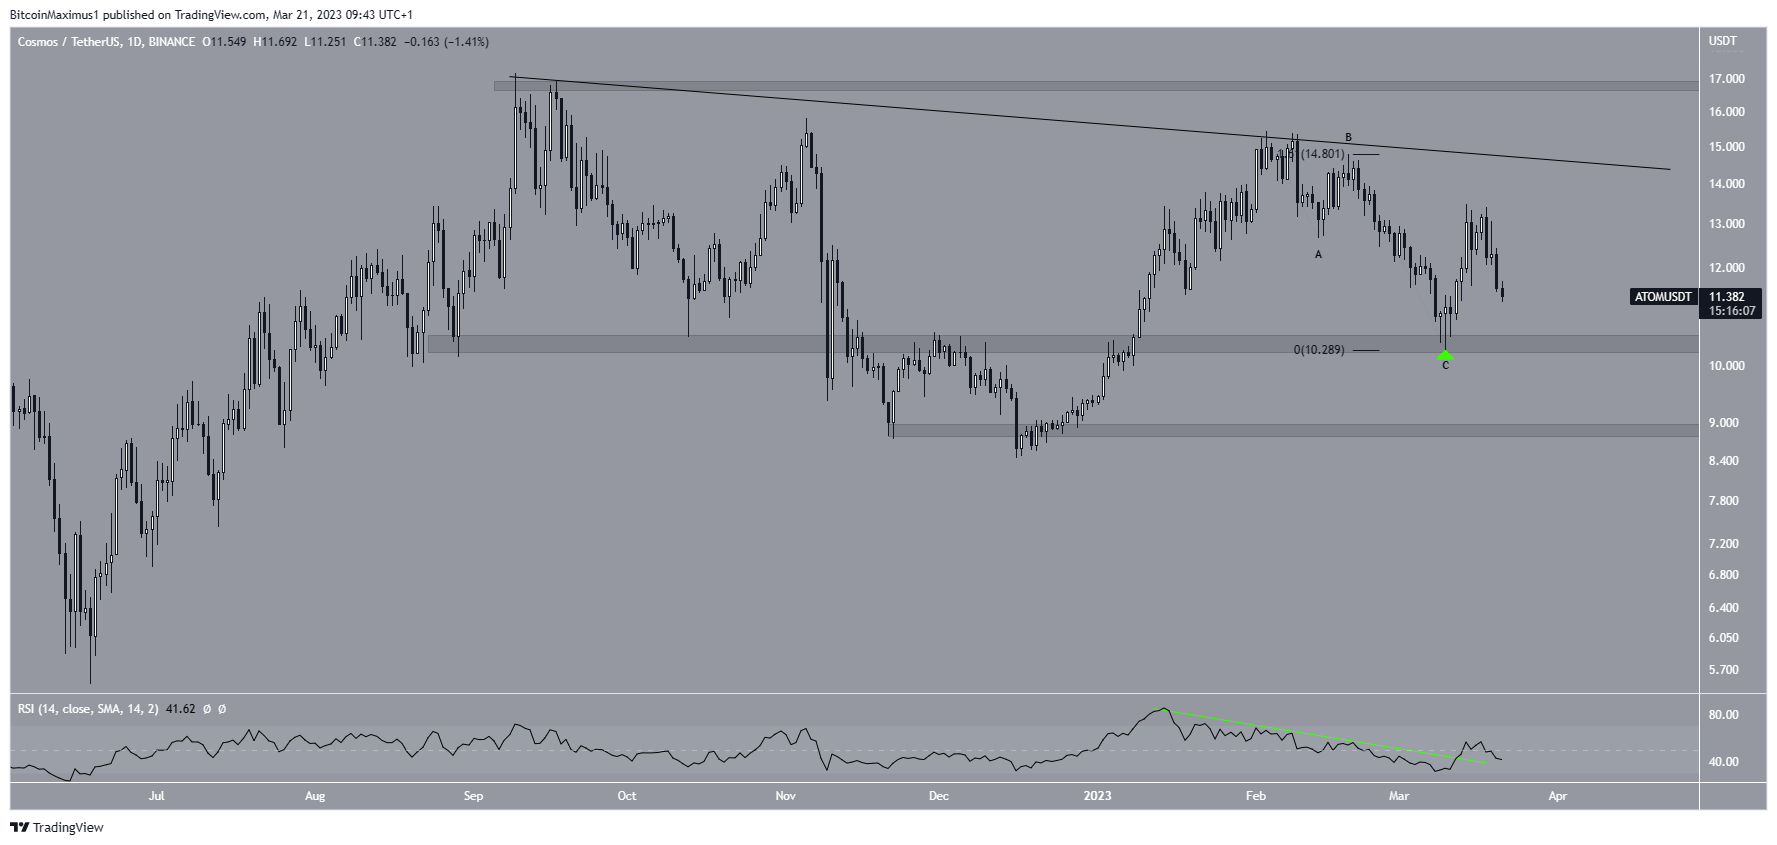
The technical analysis from the daily time frame is bullish. The ATOM price has seemingly completed an A-B-C corrective structure, in which waves A:C had an exactly 1:1.61 ratio. This is the second most common ratio in such corrections. The price has increased since completing the correction on March 10 (green icon), also validating the $10.30 area as support.
Moreover, the daily RSI broke out above its bearish divergence trend line (green line) during this increase. This is considered a bullish sign that often precedes extended upward movements.
As a result, an increase toward the descending resistance line at $14.30 is the most likely scenario. If the price breaks out from the resistance line, it could increase to the $16.80 horizontal resistance area.
On the other hand, a fall below the March 10 low of $10.29 would invalidate this bullish forecast. In that case, the ATOM token price could fall to the next closest support at $8.80.
To conclude, the most likely Cosmos price forecast is an increase toward at least the resistance line at $14.30 and possibly $16.80. However, a close below $10.30 would invalidate this bullish forecast. In that case, the ATOM price would fall to $8.80.


