


The Cosmos (ATOM) price could be in the process of creating a bullish pattern, which would be the first step in continuing the bullish trend reversal.
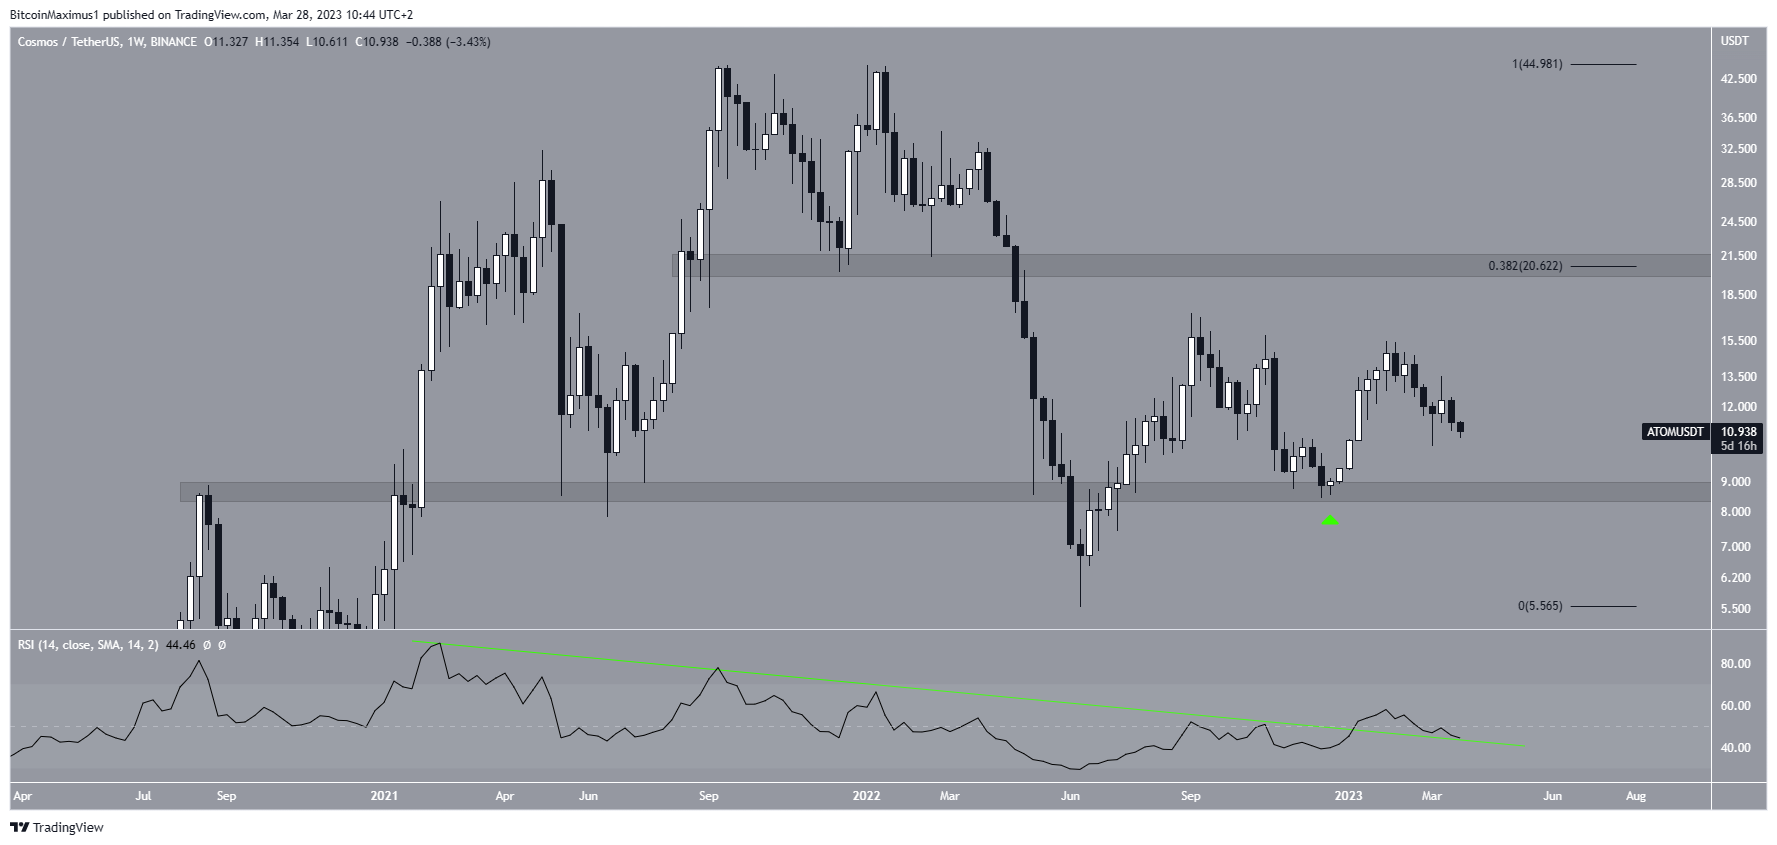
The Cosmos ecosystem, which aims to act as an internet of blockchains, has ATOM as its native token. The outlook for ATOM given by the weekly time frame is unclear. Since the price peaked at $46.68 in September 2021, it has decreased. The decline reached its nadir in June 2022 at a low of $5.54.
However, since then, the price has risen, reclaiming the $9 region and validating it as support in December of that same year. As a result, it created a higher low (green icon).
This is regarded as a bullish development. Furthermore, the weekly RSI broke out from its bearish divergence trend line (green) and could now be validating it as support. If successful, it will likely lead to an upward movement.
In that case, the ATOM token price would likely increase to the $20.60 area, created by the 0.382 Fib retracement resistance level and a horizontal resistance area.
However, if the weekly RSI fails to validate the line as support and the decrease continues, ATOM could drop to $8.80, which would be the lowest price of the year.
Cosmos (ATOM) Price Bullish Pattern Could Lead to Reversal
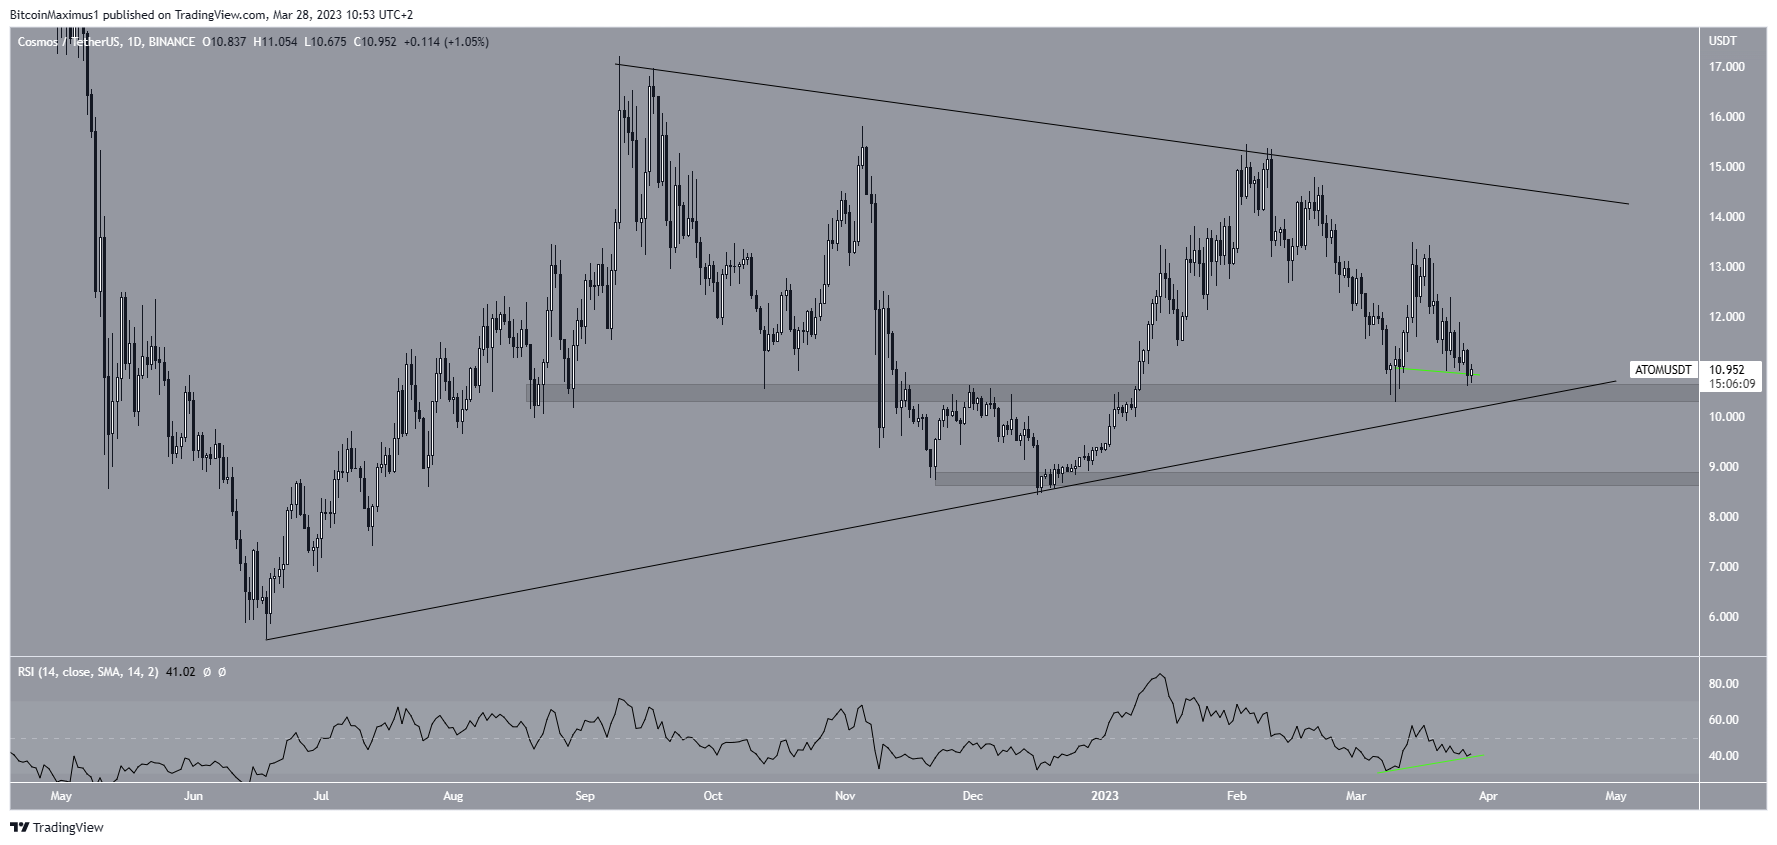
The technical analysis from the daily time frame shows that the Cosmos price is trading at a confluence of support levels at $10.50. The support is created by an ascending support line and the $0.50 horizontal support area.
Furthermore, ATOM has created a double bottom just above this area. The double bottom is considered a bullish pattern. Additionally, it has been combined with bullish divergence in the daily RSI. The next 24 hours could be crucial in confirming the pattern.
As a result, an upward movement from the current level is the most likely scenario. If so, ATOM could increase to the closest resistance at $14.
However, if the price closes below $10.50, it will invalidate its bullish structure. In that case, a drop to $8.80 could transpire.
To conclude, due to the bullish pattern in the daily time frame, the most likely Cosmos price forecast is an increase toward $14. However, if the price closes below $10.50, it could break down and fall to $8.80.


