
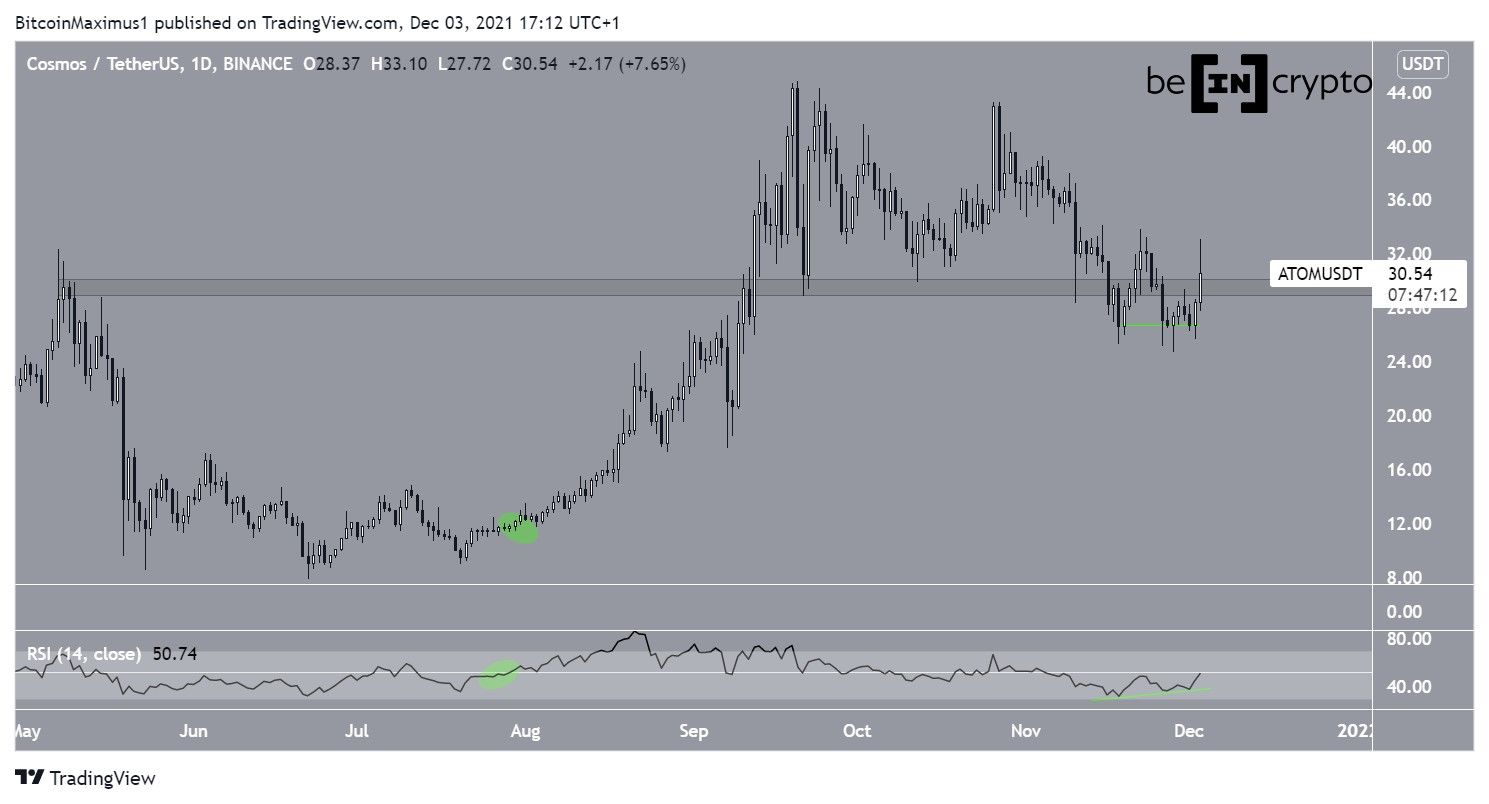
Cosmos (ATOM) is in the process of reclaiming the $29.60 horizontal support area. Doing so would be an extremely bullish development that could lead to a new all-time high price.
ATOM has been moving downwards since reaching an all-time high price on Sept 20. This led to a low of $24.67 on Nov 28.
On Nov 14, the token seemingly broke down from the $29.60 area. This had previously acted as resistance and was expected to provide support.
However, after creating a double bottom pattern, ATOM initiated an upward movement and reclaimed the area.
Furthermore, technical indicators in the daily time-frame are bullish. The upward movement was preceded by bullish divergence in the RSI (green line), which is a sign that often precedes bullish reversals.
In addition to this, the RSI has moved above 50. The previous time this occurred was on July 27, just prior to the beginning of the upward movement that led to the all-time high. Therefore, it is possible that a similar movement will transpire this time around.
Short-term ATOM movement
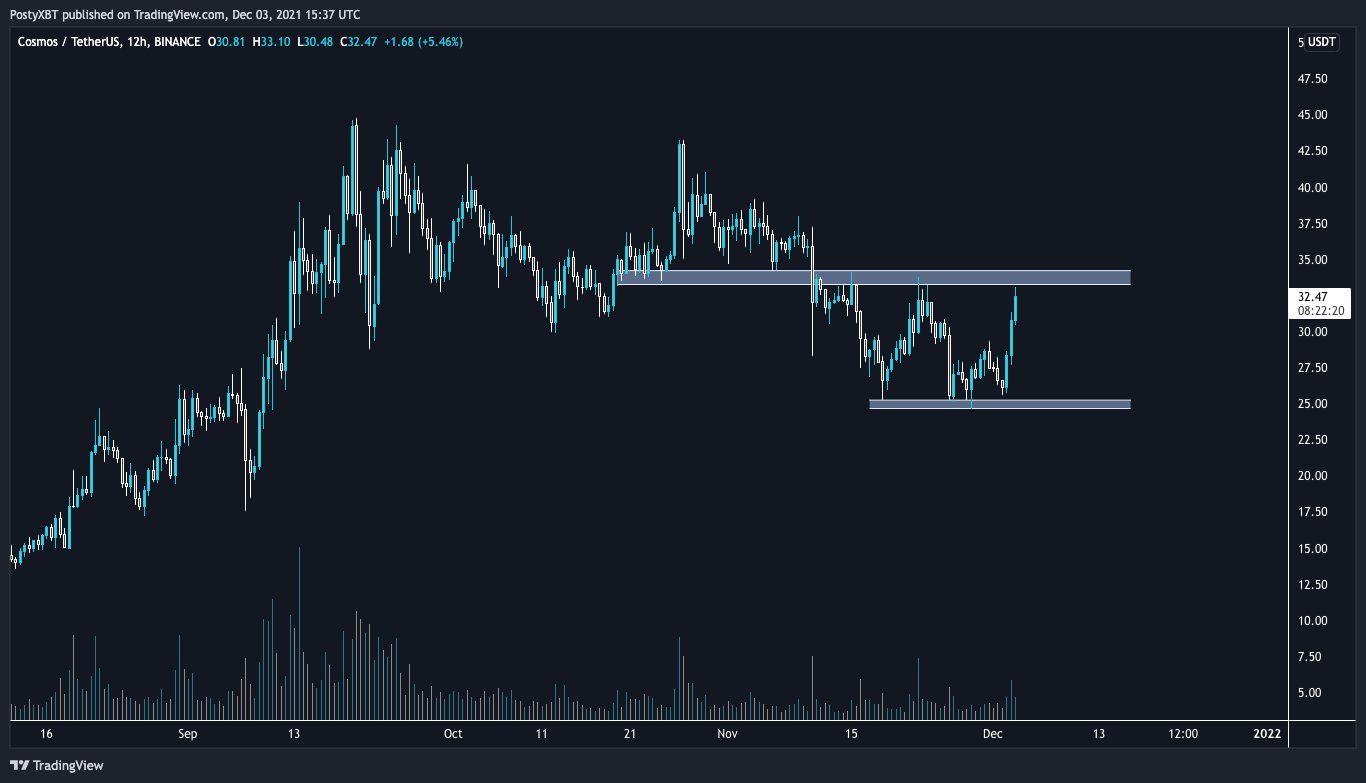
Cryptocurrency trader @PostyXBT tweeted an ATOM chart, stating that a reclaim of the range high at $35 is required for the trend to be considered bullish.
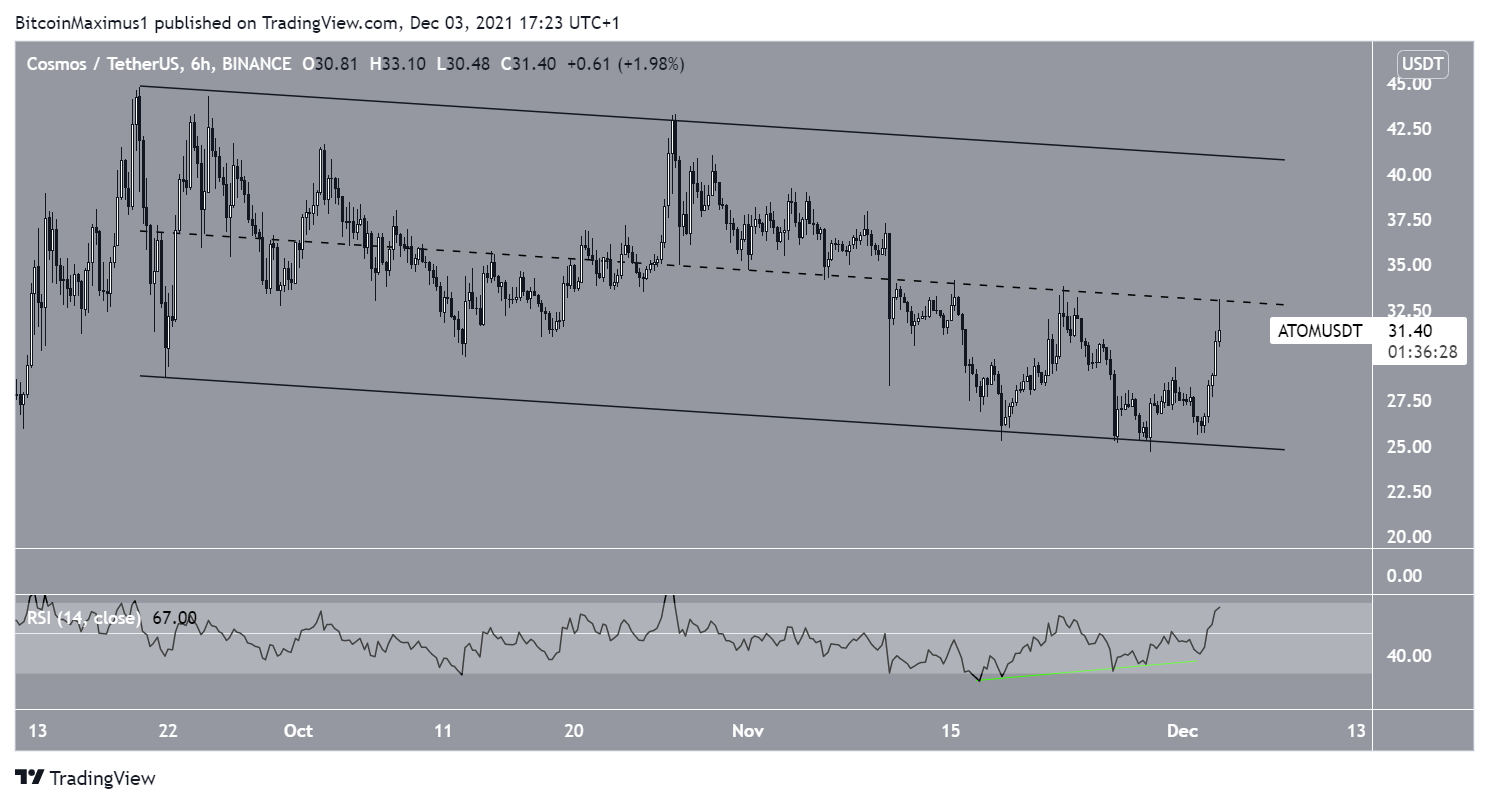
The shorter-term six-hour chart shows that ATOM is trading inside a descending parallel channel. It has been doing so since reaching the aforementioned all-time high on Sept 20.
Such channels usually contain corrective movements, meaning that a breakout from them is expected.
Furthermore, similarly to the daily time-frame, the six-hour RSI has also generated bullish divergence, a sign of a trend reversal.
A reclaim of the middle of the channel would be a strong bullish sign that would suggest that an eventual breakout and new all-time high are likely.
For BeInCrypto’s latest Bitcoin (BTC) analysis, click here.
