


Cosmos (ATOM) is very close to breaking down from a corrective pattern that has been in place since June 18. Doing so would likely accelerate the rate of decrease.
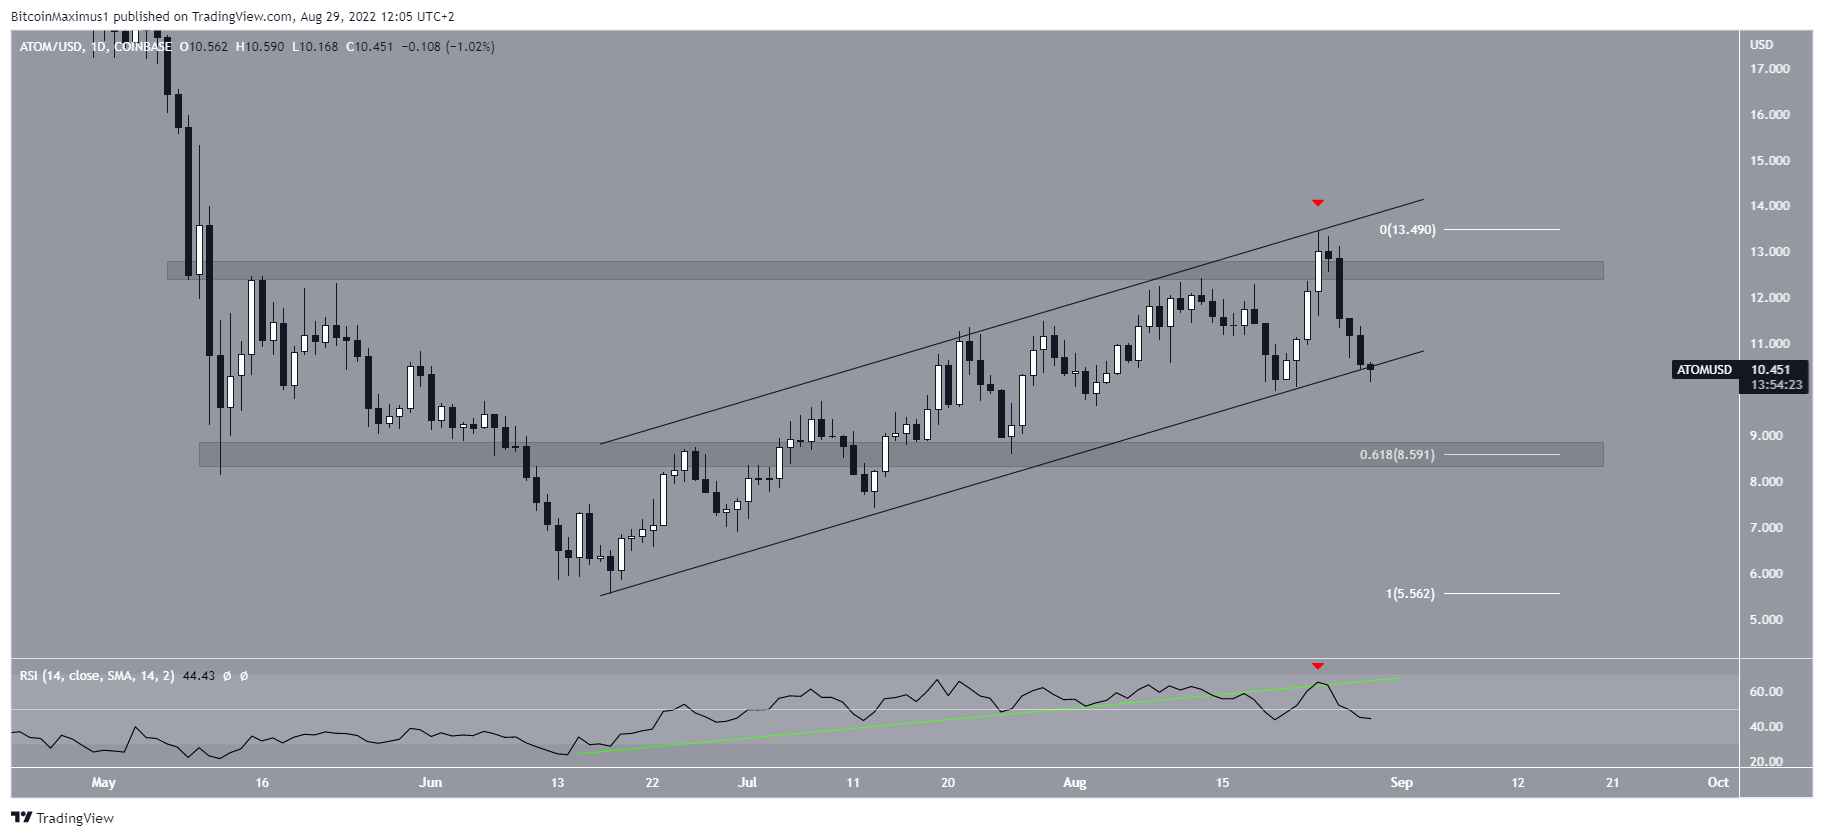
The daily chart shows that ATOM has been increasing inside an ascending parallel channel since reaching a low of $5.54 on June 18. Such channels usually contain corrective movements, meaning that an eventual breakdown from it would be expected.
The price was rejected by the resistance line of the channel on Aug. 24 (red icon) and has been falling since. Besides the resistance line, the high also marked a deviation above the $12.40 resistance area.
Cryptocurrency trader @Incomesharks tweeted a chart of ATOM, stating that the price is likely to continue falling.
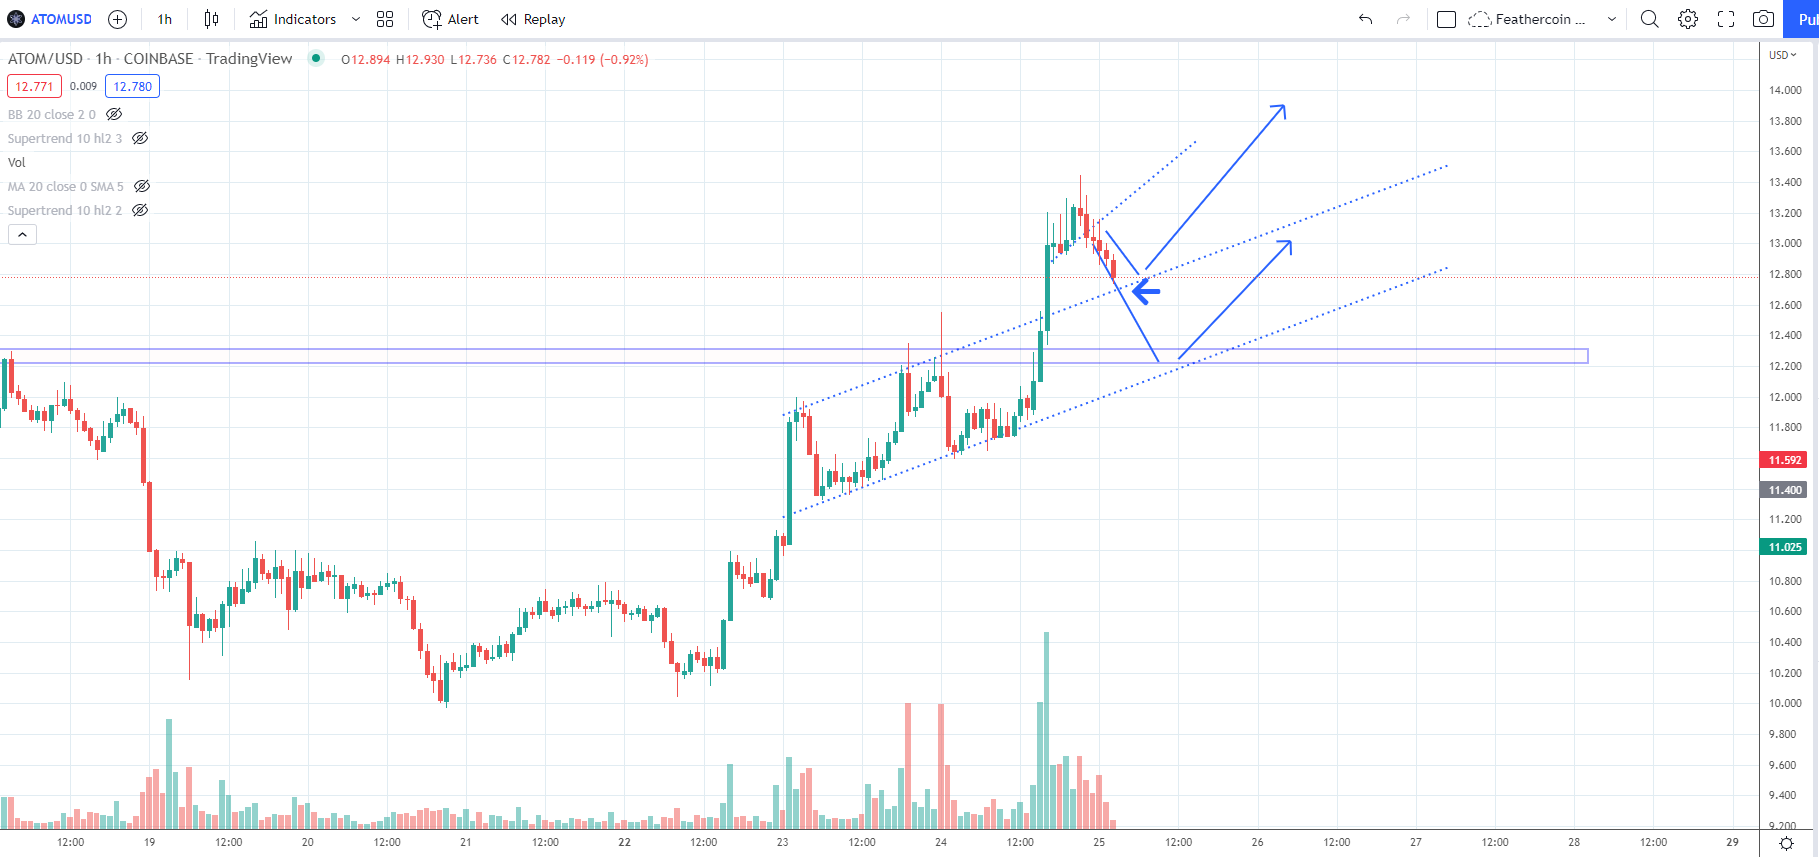
Currently, ATOM is barely holding on to the support line of the channel. If a breakdown from the channel occurs, the closest support area would be at $8.60. This is the 0.618 Fib retracement support level and a horizontal support area.
The daily RSI readings support the breakdown from the channel and the continuation of the ongoing downward movement. The main reason for this is that the indicator has broken down from its ascending support line and decreased below 50.
As a result, both the price action and indicator readings suggest that a considerable decrease is expected.
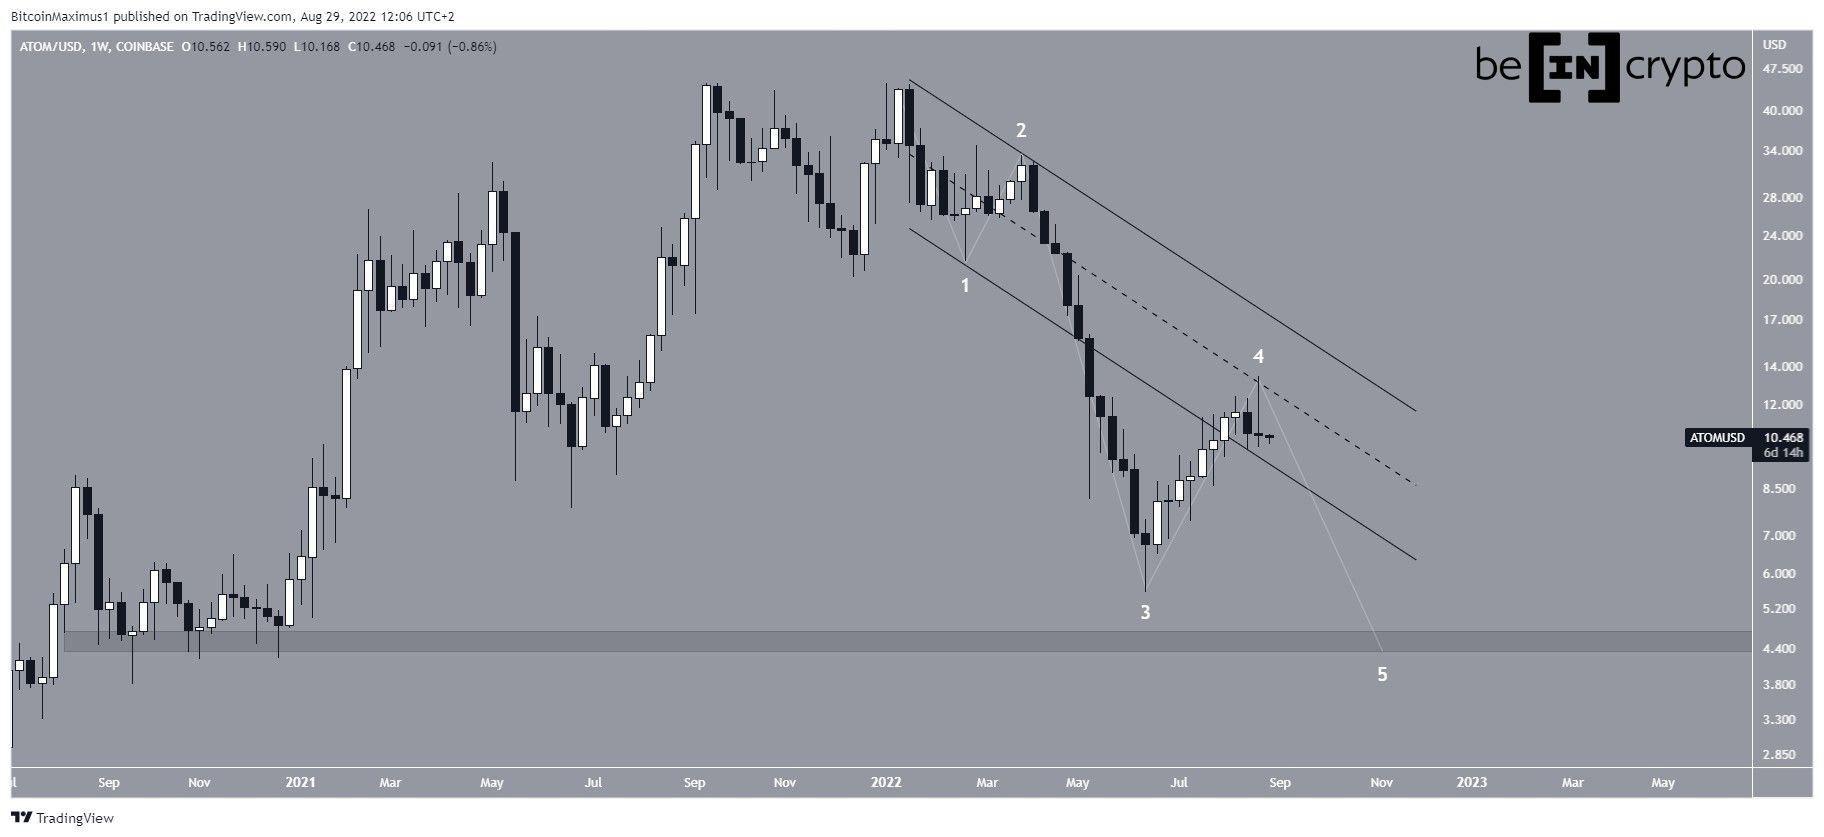
ATOM wave count analysis
The wave count shows that ATOM began a five-wave downward movement after reaching an all-time high price in Jan. 2022. If the count is correct, the June bottom marked the bottom of wave three (white).
So, the ongoing upward movement is part of a fourth wave pullback, as evidenced by the touch of the middle of the channel connecting waves one and two.
So, if the price begins the fifth and final wave, the downward movement could continue until the $4.50 horizontal support area.
For Be[in]Crypto’s latest Bitcoin (BTC) analysis, click here


