


Cosmos (ATOM) has been moving upwards since June 18 and created its first higher low on June 30. It is in the process of breaking out from a short-term resistance line.
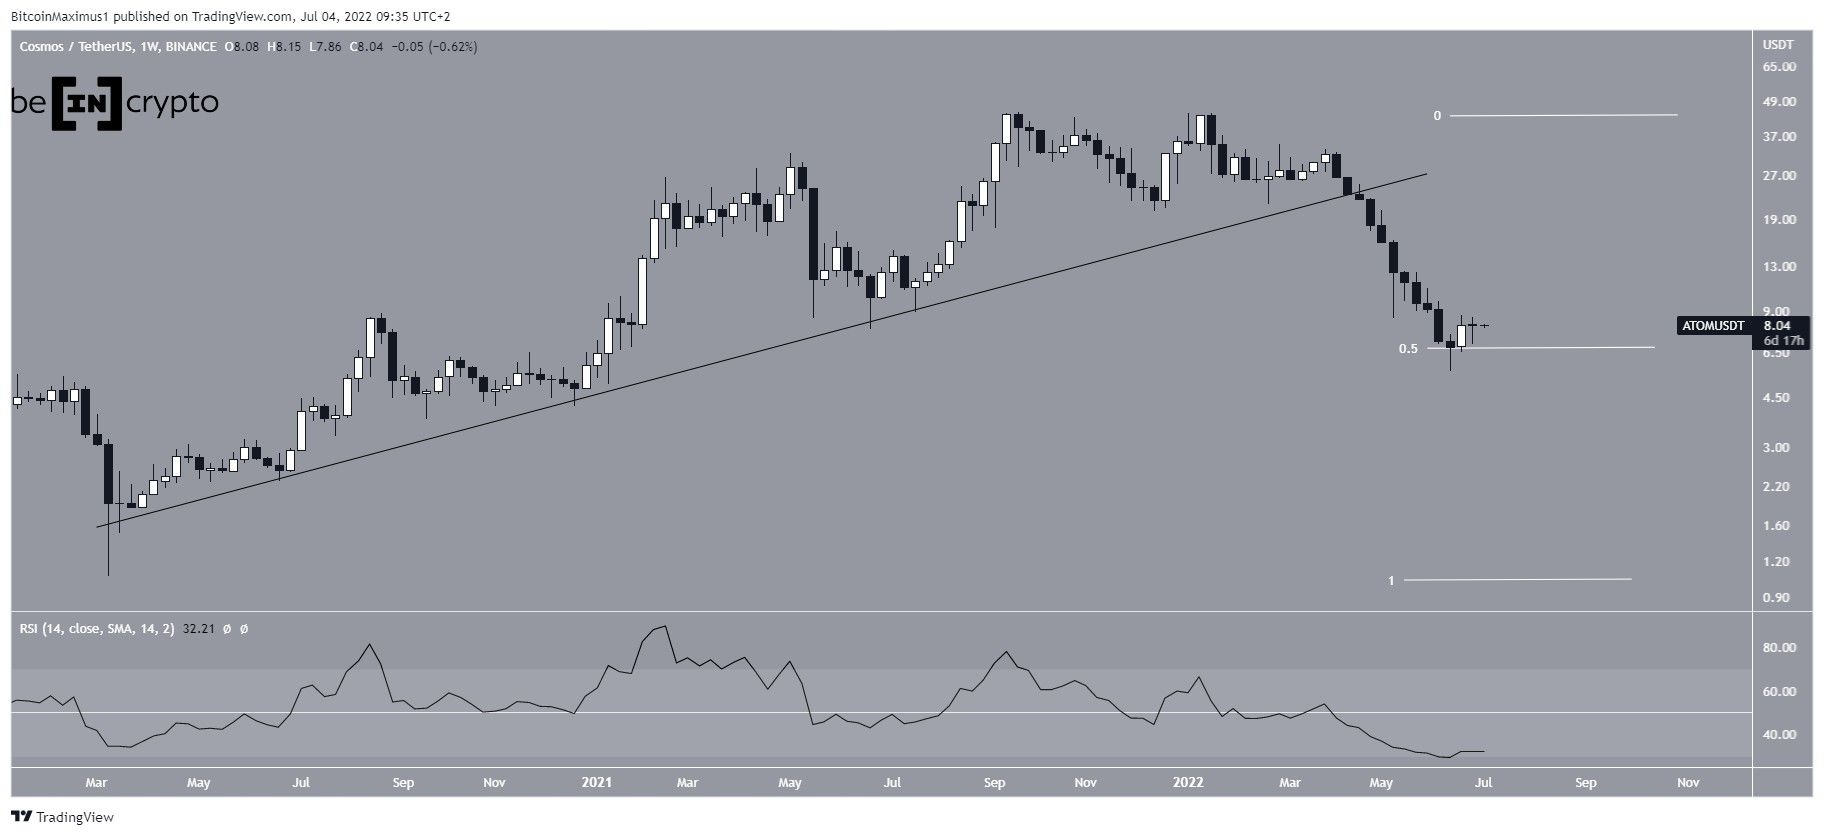
ATOM has been falling since Jan 2022, when it reached a high of $44.56. The downward movement has so far led to a low of $5.55 in June. The decrease also caused a breakdown from an ascending support line that had been in place since the March 2020 lows. Breakdowns from such long-term structures usually signify a break in trend.
The low was made right at the 0.5 Fib retracement level when measuring the entire upward movement since March 2020 and initiated a slight bounce. However, there are no bullish reversal signs despite the oversold weekly RSI.
Daily RSI is bullish
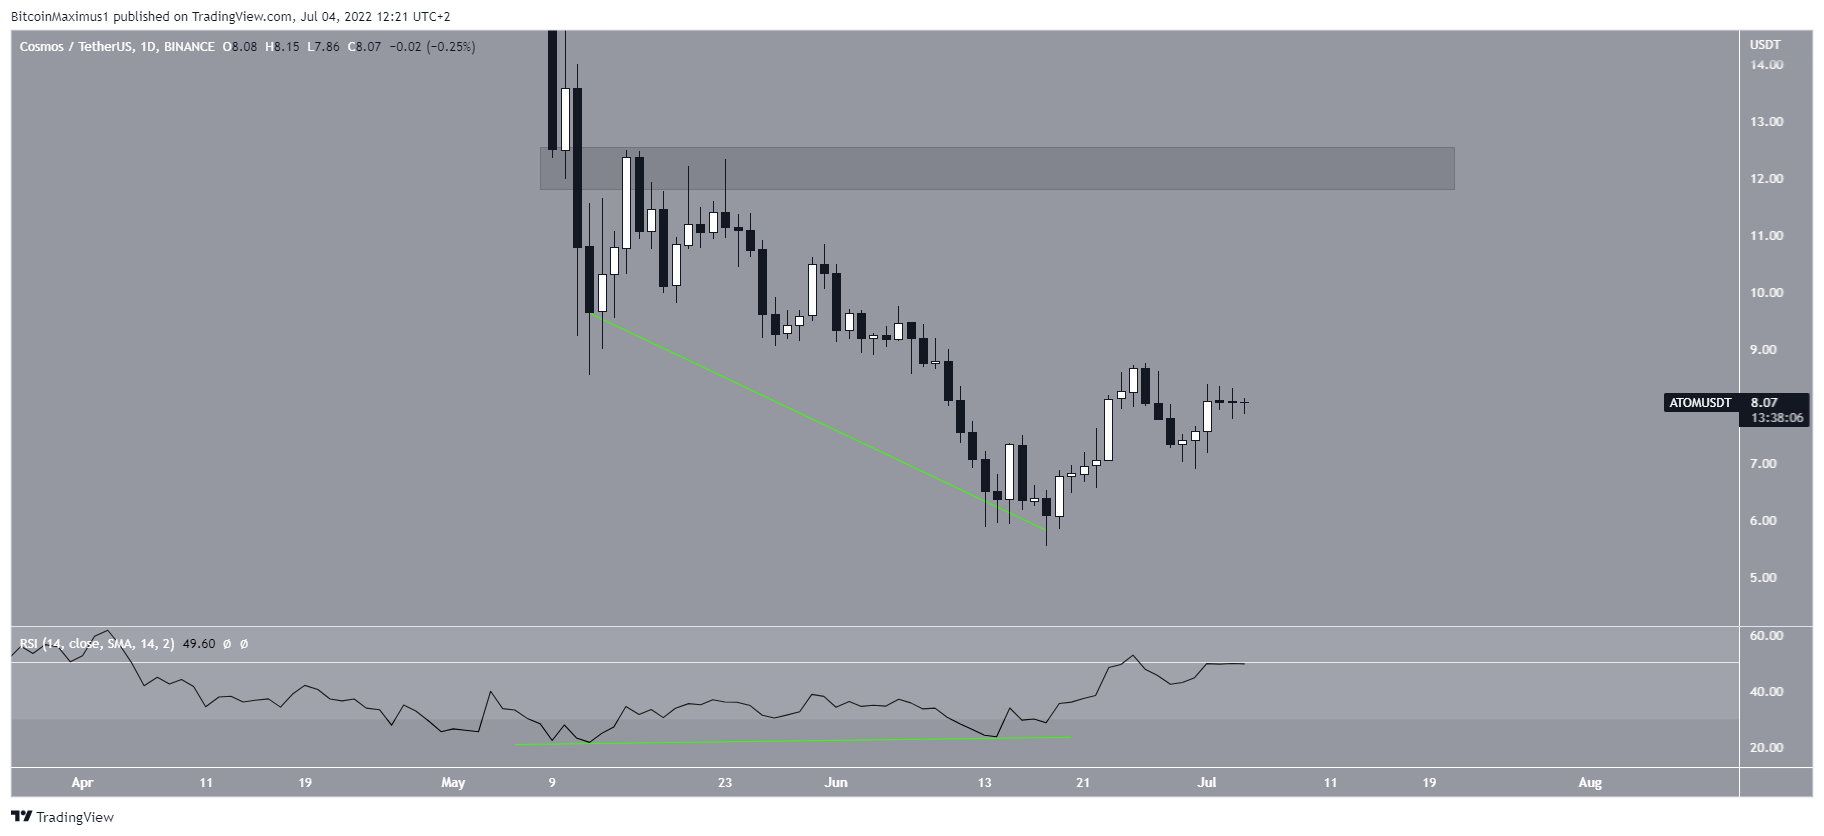
The daily chart gives a more bullish outlook than the weekly one. The reason for this is that the RSI reading is extremely bullish.
After generating bullish divergence (green line), the RSI moved above its oversold region and successfully completed a swing bottom, which is another bullish development. The RSI is now close to moving above 50, which could confirm that the bullish reversal.
In that case, the closest resistance area is at $12.20.
Short-term ATOM bounce
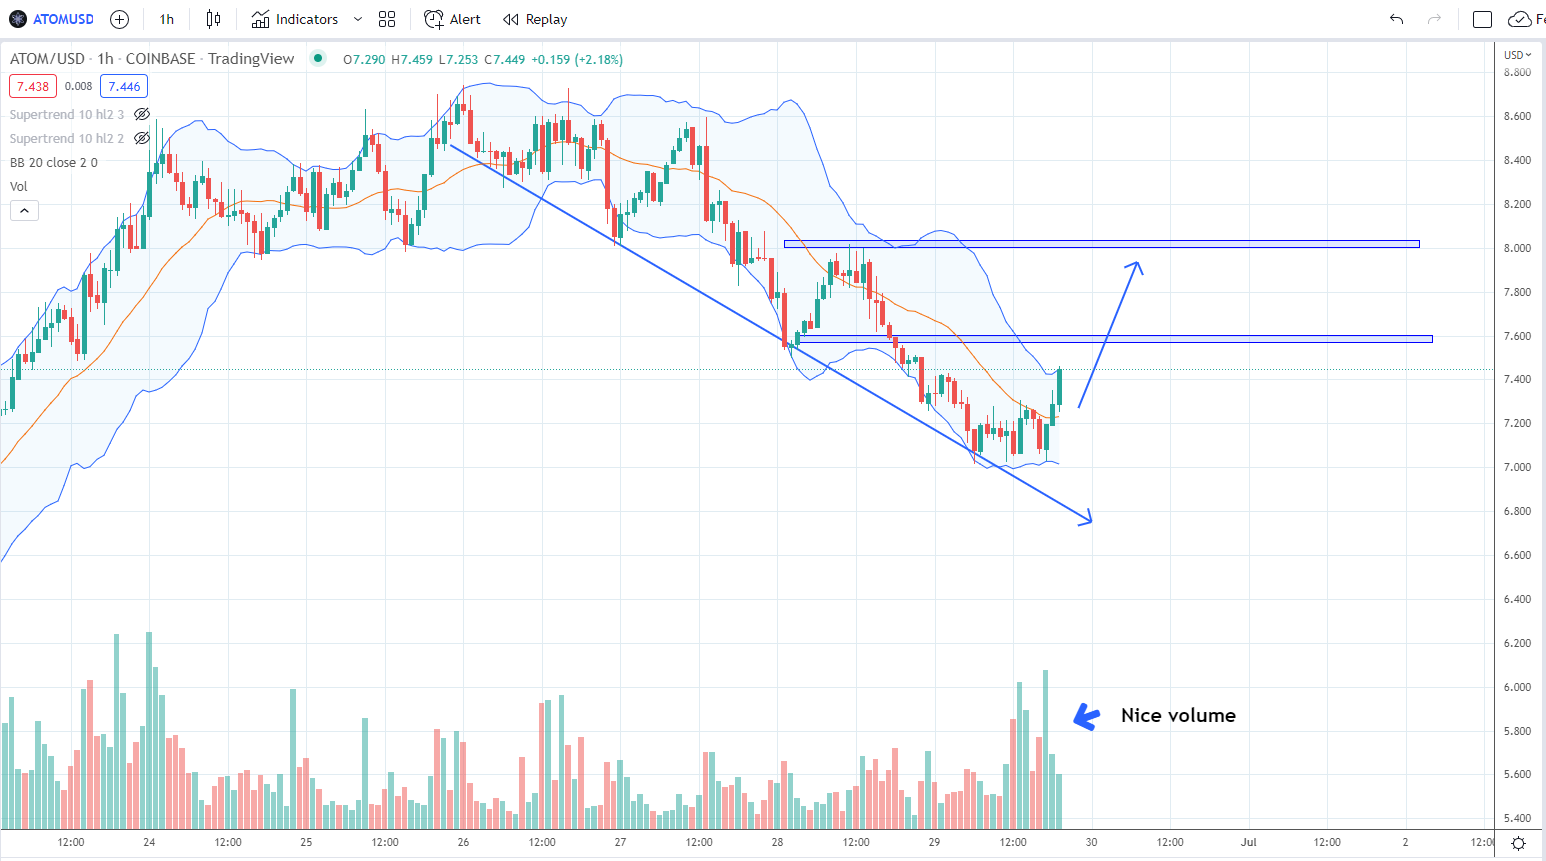
Cryptocurrency trader @IncomeSharks tweeted a chart of ATOM, stating that the price could increase all the way to $8 in the short-term.
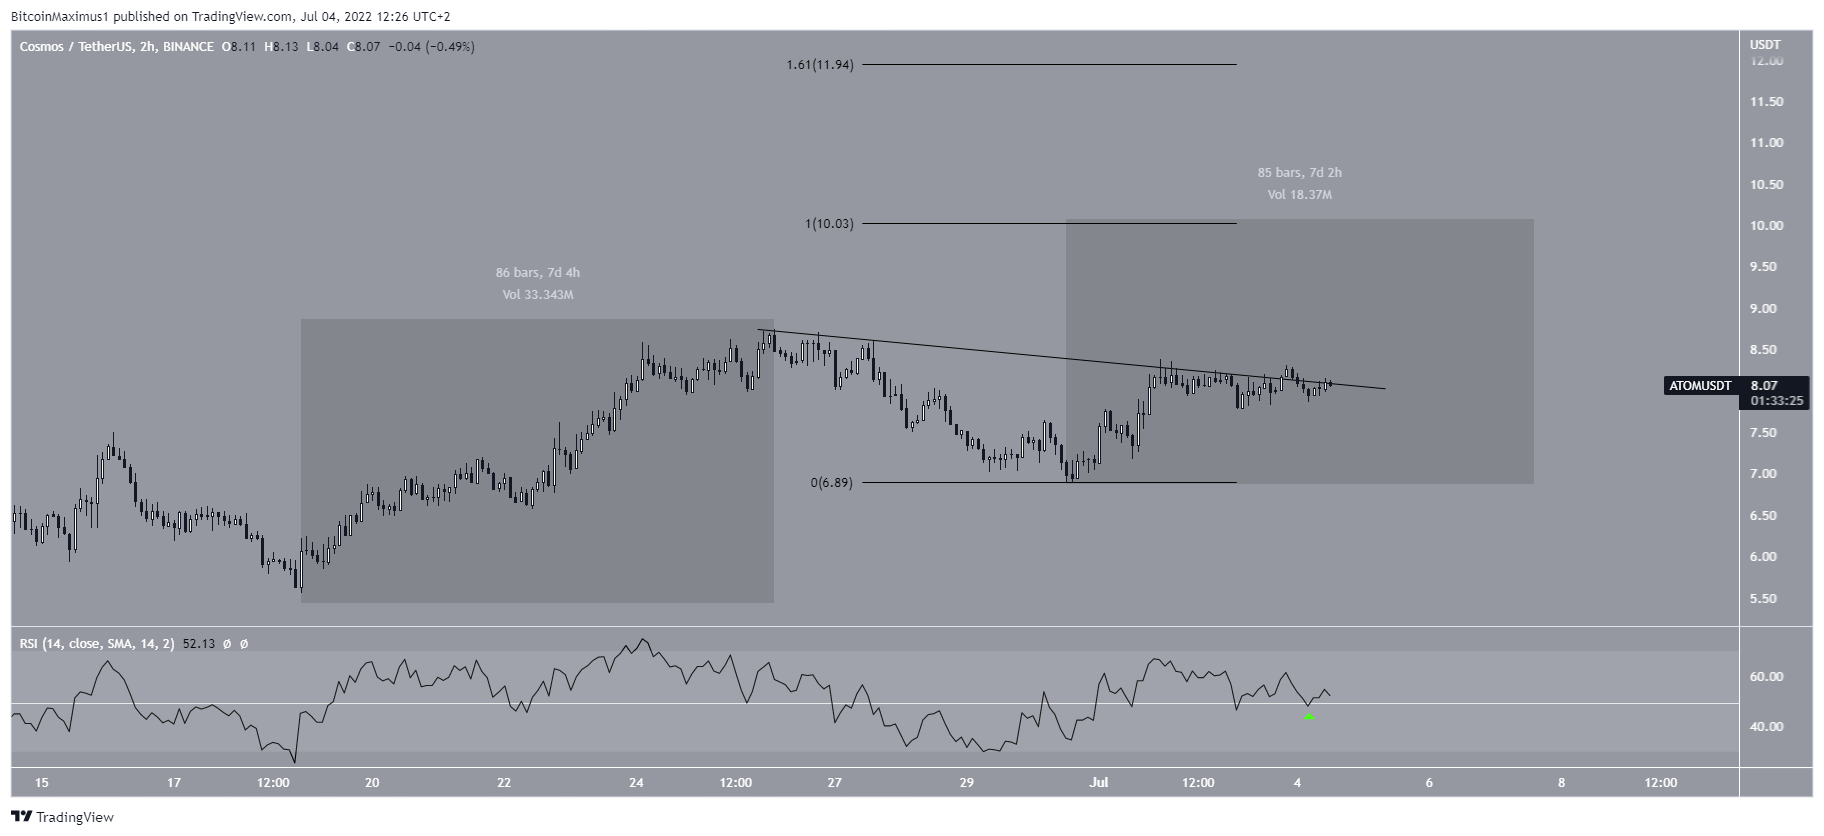
Finally, the two-hour chart shows that the price is in the process of breaking out from a short-term descending resistance line, which has been in place since June 27. Additionally, the RSI is above 50 (green icon), which is considered a sign of a bullish trend. Since the price has made at least five attempts at breaking out, an eventual breakout is expected.
If the two upward movements (highlighted) have a 1:1 ratio, ATOM would increase all the way to $10. If they have a 1:1.61 ratio instead, it would take it all the way to $12, very close to the previously outlined resistance area.
For Be[in]Crypto’s latest bitcoin (BTC) analysis, click here



