


While the price of Bitcoin is in a downtrend, analysts are trying to determine possible scenarios for its further movements. One way to manage investment risk is to try to determine the worst case scenario and the price below which the asset should not fall. The most recent development in this area is the Confluence Floor Model.
The author of the Confluence Floor Model is popular crypto market analyst @TheRealPlanC. Recently, at BeInCrypto, we wrote about another of his models called Market Risk Map. Using his latest model, the analyst claims that Bitcoin should never fall below $26,769 again.
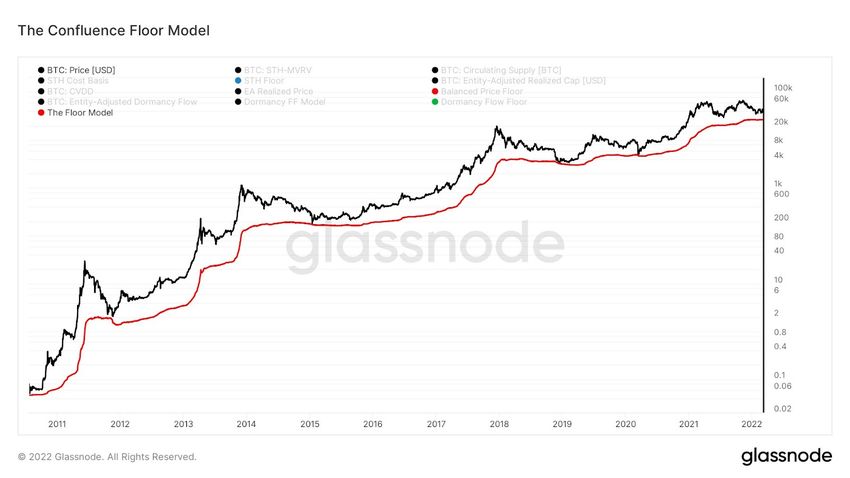
Moreover, PlanC believes that his model marks the historical macro lows of the BTC price with greater accuracy than the 200-week SMA. The latter is used by many analysts and commentators in the crypto market, pointing out the best buying opportunities for Bitcoin in history.
A rising triangle on the Bitcoin chart
On the BTC price chart, we are seeing an attempt to reverse the downtrend that has been underway since the January 24 bottom at $32,900. For the next 45 days, the price has not fallen below this value, and Bitcoin seems to have formed a rising triangle formation. Typically, this formation appears as a continuation of an uptrend or as a reversal of a completed downtrend.
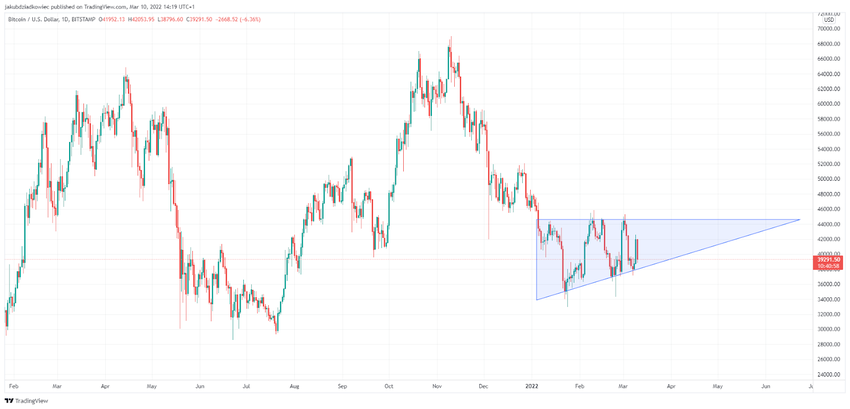
If this pattern were to play out, a breakout should be expected around April-May when about 70% of the pattern is filled. A rising triangle has a higher probability of an upward breakout than a breakdown, so a trend reversal is likely here.
However, there is a non-zero probability of a breakdown from the triangle and a continuation of the bearish trend. The question then becomes what level could provide ultimate support in the worst case scenario.
Confluence Floor Model: BTC will not fall below $26,769
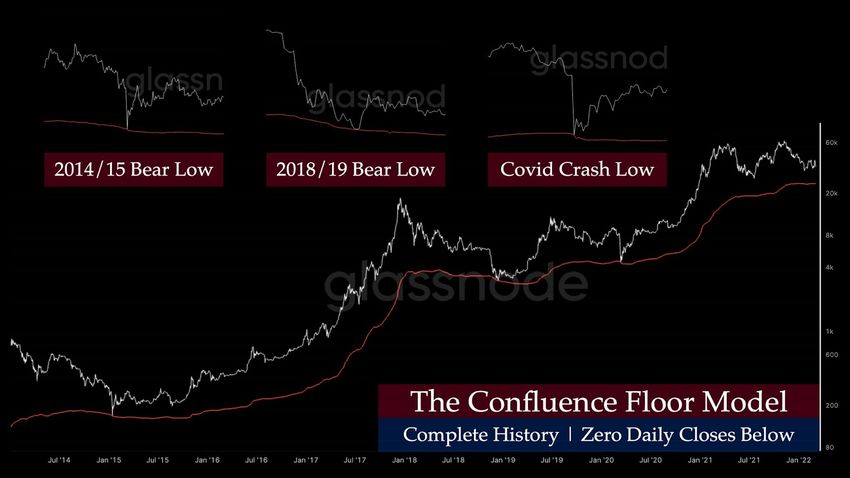
The Confluence Floor Model for Bitcoin, published on March 8, attempts to answer this question. The model takes into account three independent floor models and is extremely accurate in the historical analysis. According to PlanC, the BTC price has only touched the model’s chart three times in history, and these “were the 3 best times to buy over the last 10 years”.
At the time of the tweet, the chart was showing a price of $26,683 as the value below which the daily candle should never close. However, according to the latest update just a day later, the Confluence Floor Model was pointing to $26,768 as the absolute bottom.
So currently, according to this model, the floor for Bitcoin is rising by about $100 per day. PlanC further adds that the 30-day and 90-day change on the Confluence Floor Model chart is 1%. However, already on the scale of the last 180 days, the increase on its chart is as much as 25%.
Looking at the entire chart, we see that the value indicated by the model has almost always increased. Yet even when decreases were observed, they were not larger than a few percent.
Historical accuracy and out performance of the 200W SMA
Next, the author of the indicator highlights the historical accuracy of the Confluence Floor Model by providing zoom-ins of 3 historical macro lows of the BTC price. These were the lows during the 2014/15 and 2018/19 bear markets, as well as the COVID-19 crash in March 2020. Interestingly, in none of these cases did the Bitcoin price close below the value indicated by the model.
For this reason, PlanC claims that the Confluence Floor Model is a better indicator than the famous 200-week simple moving average (SMA). The reasons are threefold:
- better usability: daily updates vs weekly updates
- better accuracy: no daily closes below vs 36 daily closes below
- better confluence: combination of 3 on-chain analysis models vs single technical analysis model
The Confluence Floor Model is another interesting creation of on-chain analysis that can help investors effectively manage market risk. If we take $39,000 as today’s Bitcoin price and $26,768 as the floor price, the maximum downside risk today is -31%.
If, on the other hand, one counts from the November 2021 all-time high of $69,000, Bitcoin would see a 61% decline from its ATH after reaching the model value. Therefore, this would not be as deep a decline as historical bear markets (80-85%). But it is something that would certainly be expected in the maturation and growing institutional support of this new digital asset class.
For BeInCrypto’s latest Bitcoin (BTC) analysis, click here.


