


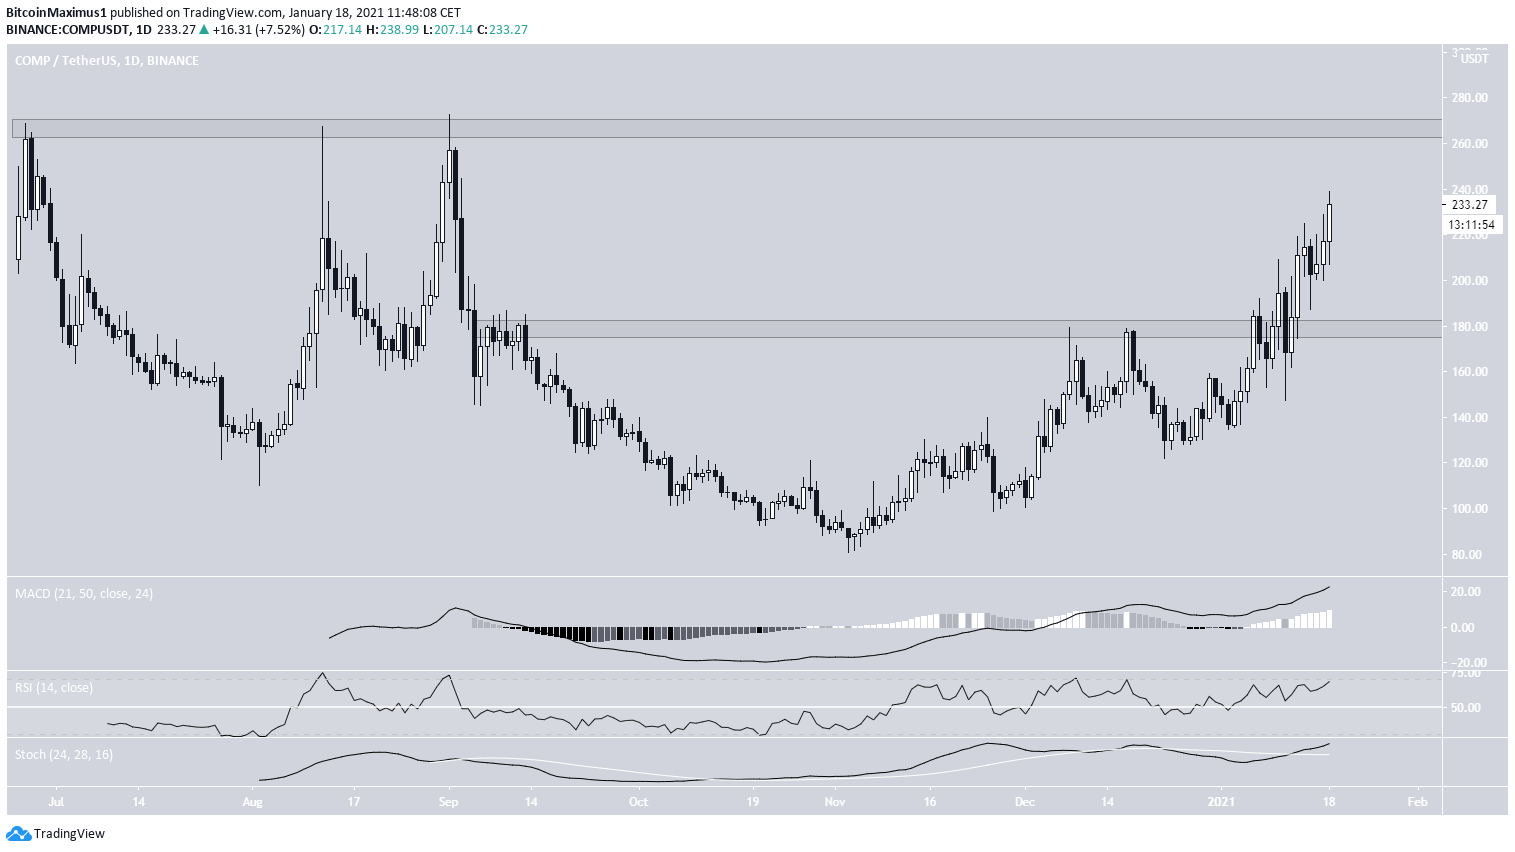
The Compound (COMP) price has increased significantly this year and is approaching the all-time high resistance area at $265.
Price action and technical indicators are bullish for both COMP/USD and COMP/BTC, supporting the continuation of their respective upward movements.
COMP’s All-Time High Resistance
COMP has been moving upwards since it reached a low of $80.62 on Nov. 3, 2020. After four unsuccessful attempts, it finally managed to move above the $180 area on Jan.10.
It validated this as support and resumed its upward movement at an accelerated rate. The closest resistance area is at $265, which coincides with the all-time high levels reached in Aug. 2020.
The presence of these bullish indicators suggests that COMP will likely reach the $265 area.
Short-Term Movement
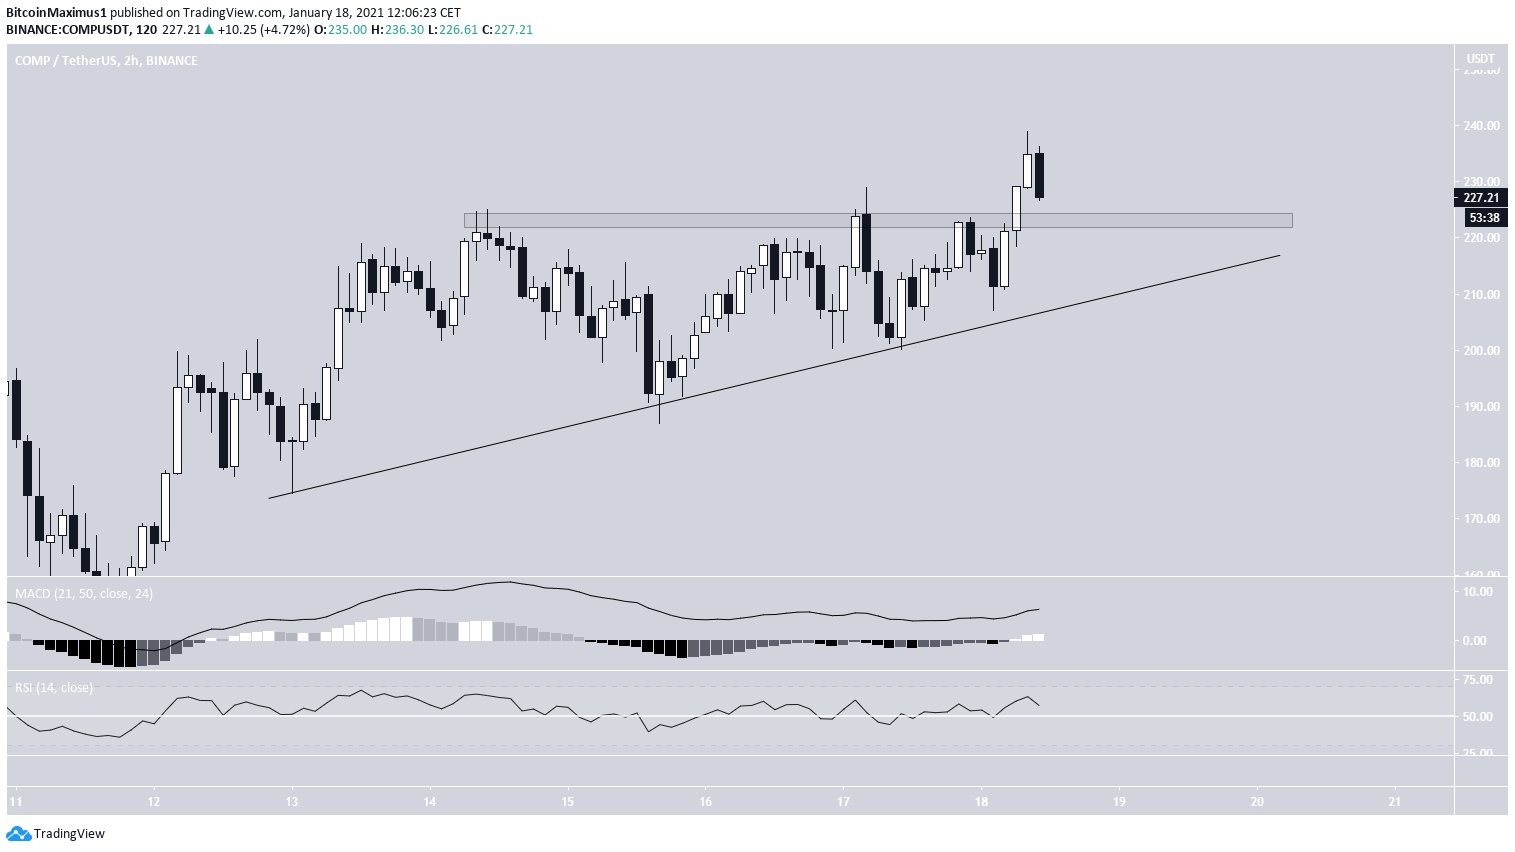
The shorter-term two-hour chart also supports the continuation of the upward momentum. COMP is following an ascending support line and has possibly broken out from what looks like an ascending triangle.
Resistance is at $226. As long as it trades above this area/line, the short-term outlook remains bullish. Similar to the daily time-frame, technical indicators are bullish.
Wave Count
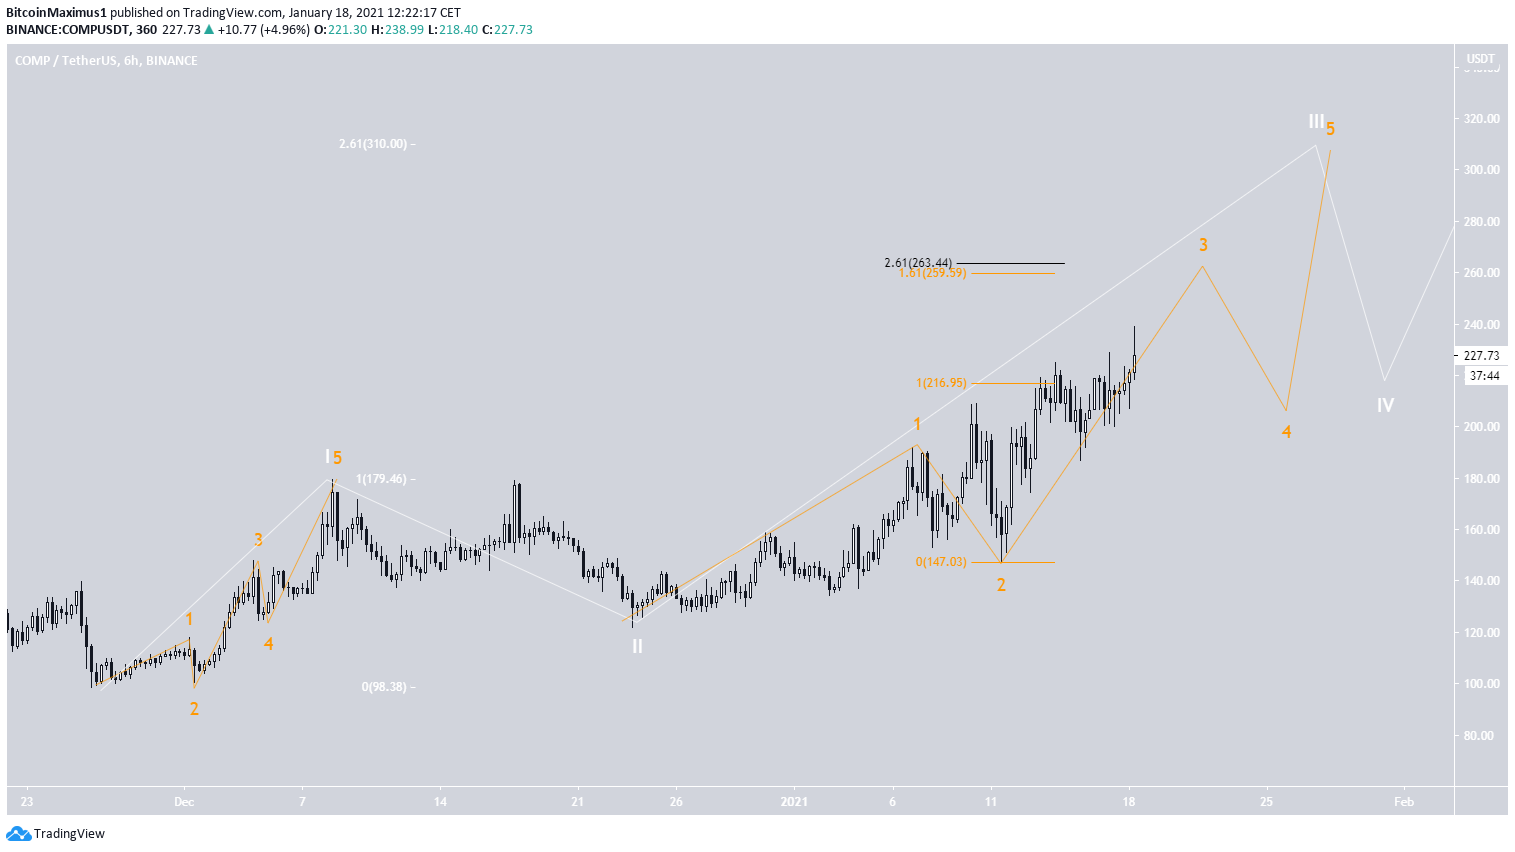
The wave count suggests that COMP is in an extended wave 3 (shown in white below) of a bullish impulse that began on Nov. 26. A possible target for the top of the impulse is at $310, the 2.61 fib extension of wave 1.
The sub-wave count is provided in orange showing that COMP is currently in wave 3. A likely target for the top of wave 3 is between $259-$263, found by a combination of fib extensions and external retracements.
COMP/BTC
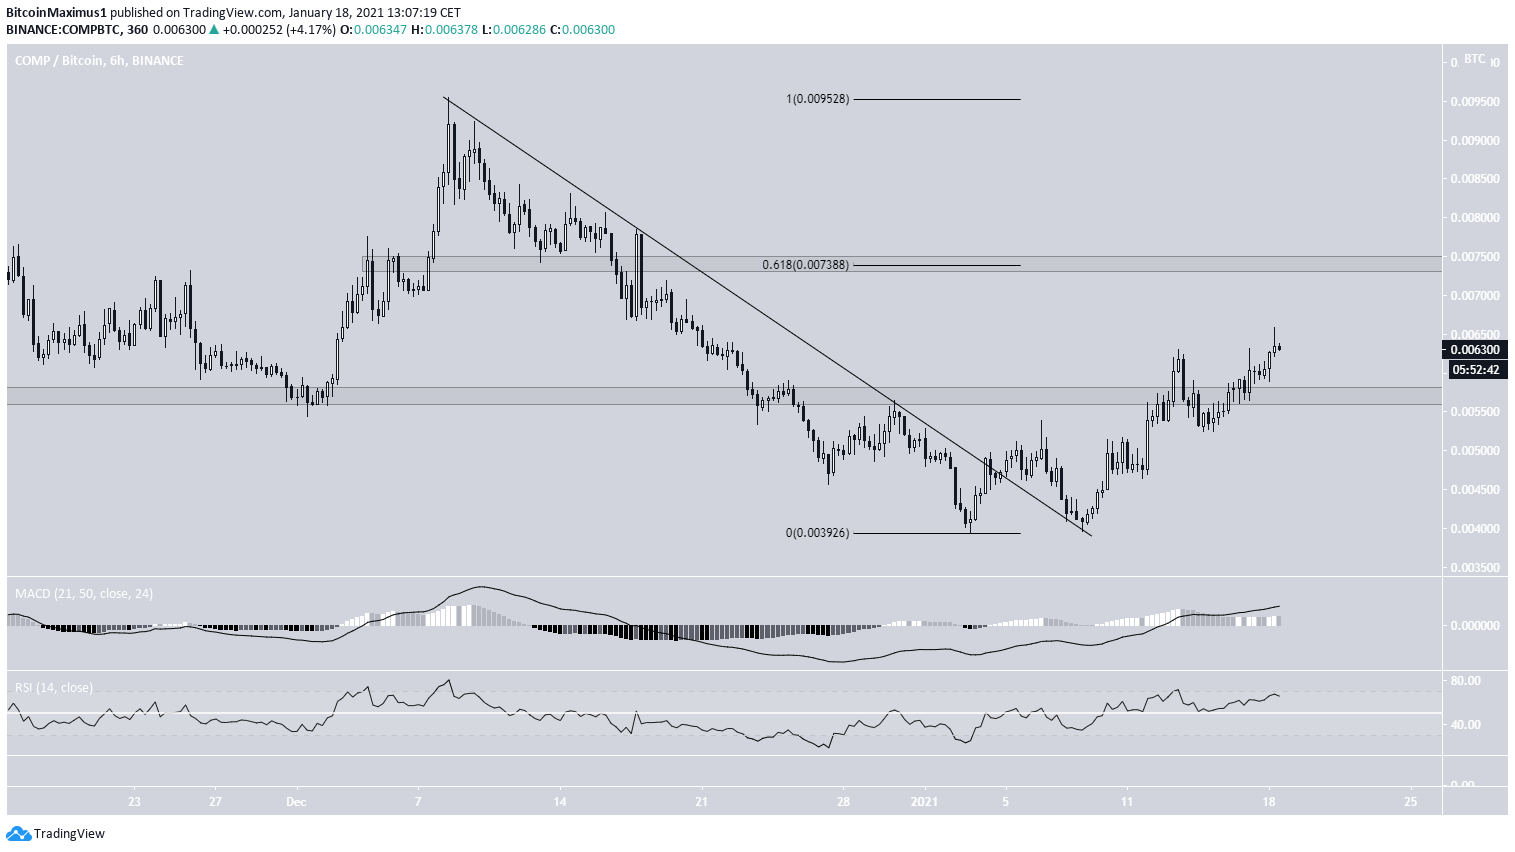
Cryptocurrency trader @JJJCycles outlined a COMP/BTC chart, stating that while the trend looks strong, the price is running into resistance.
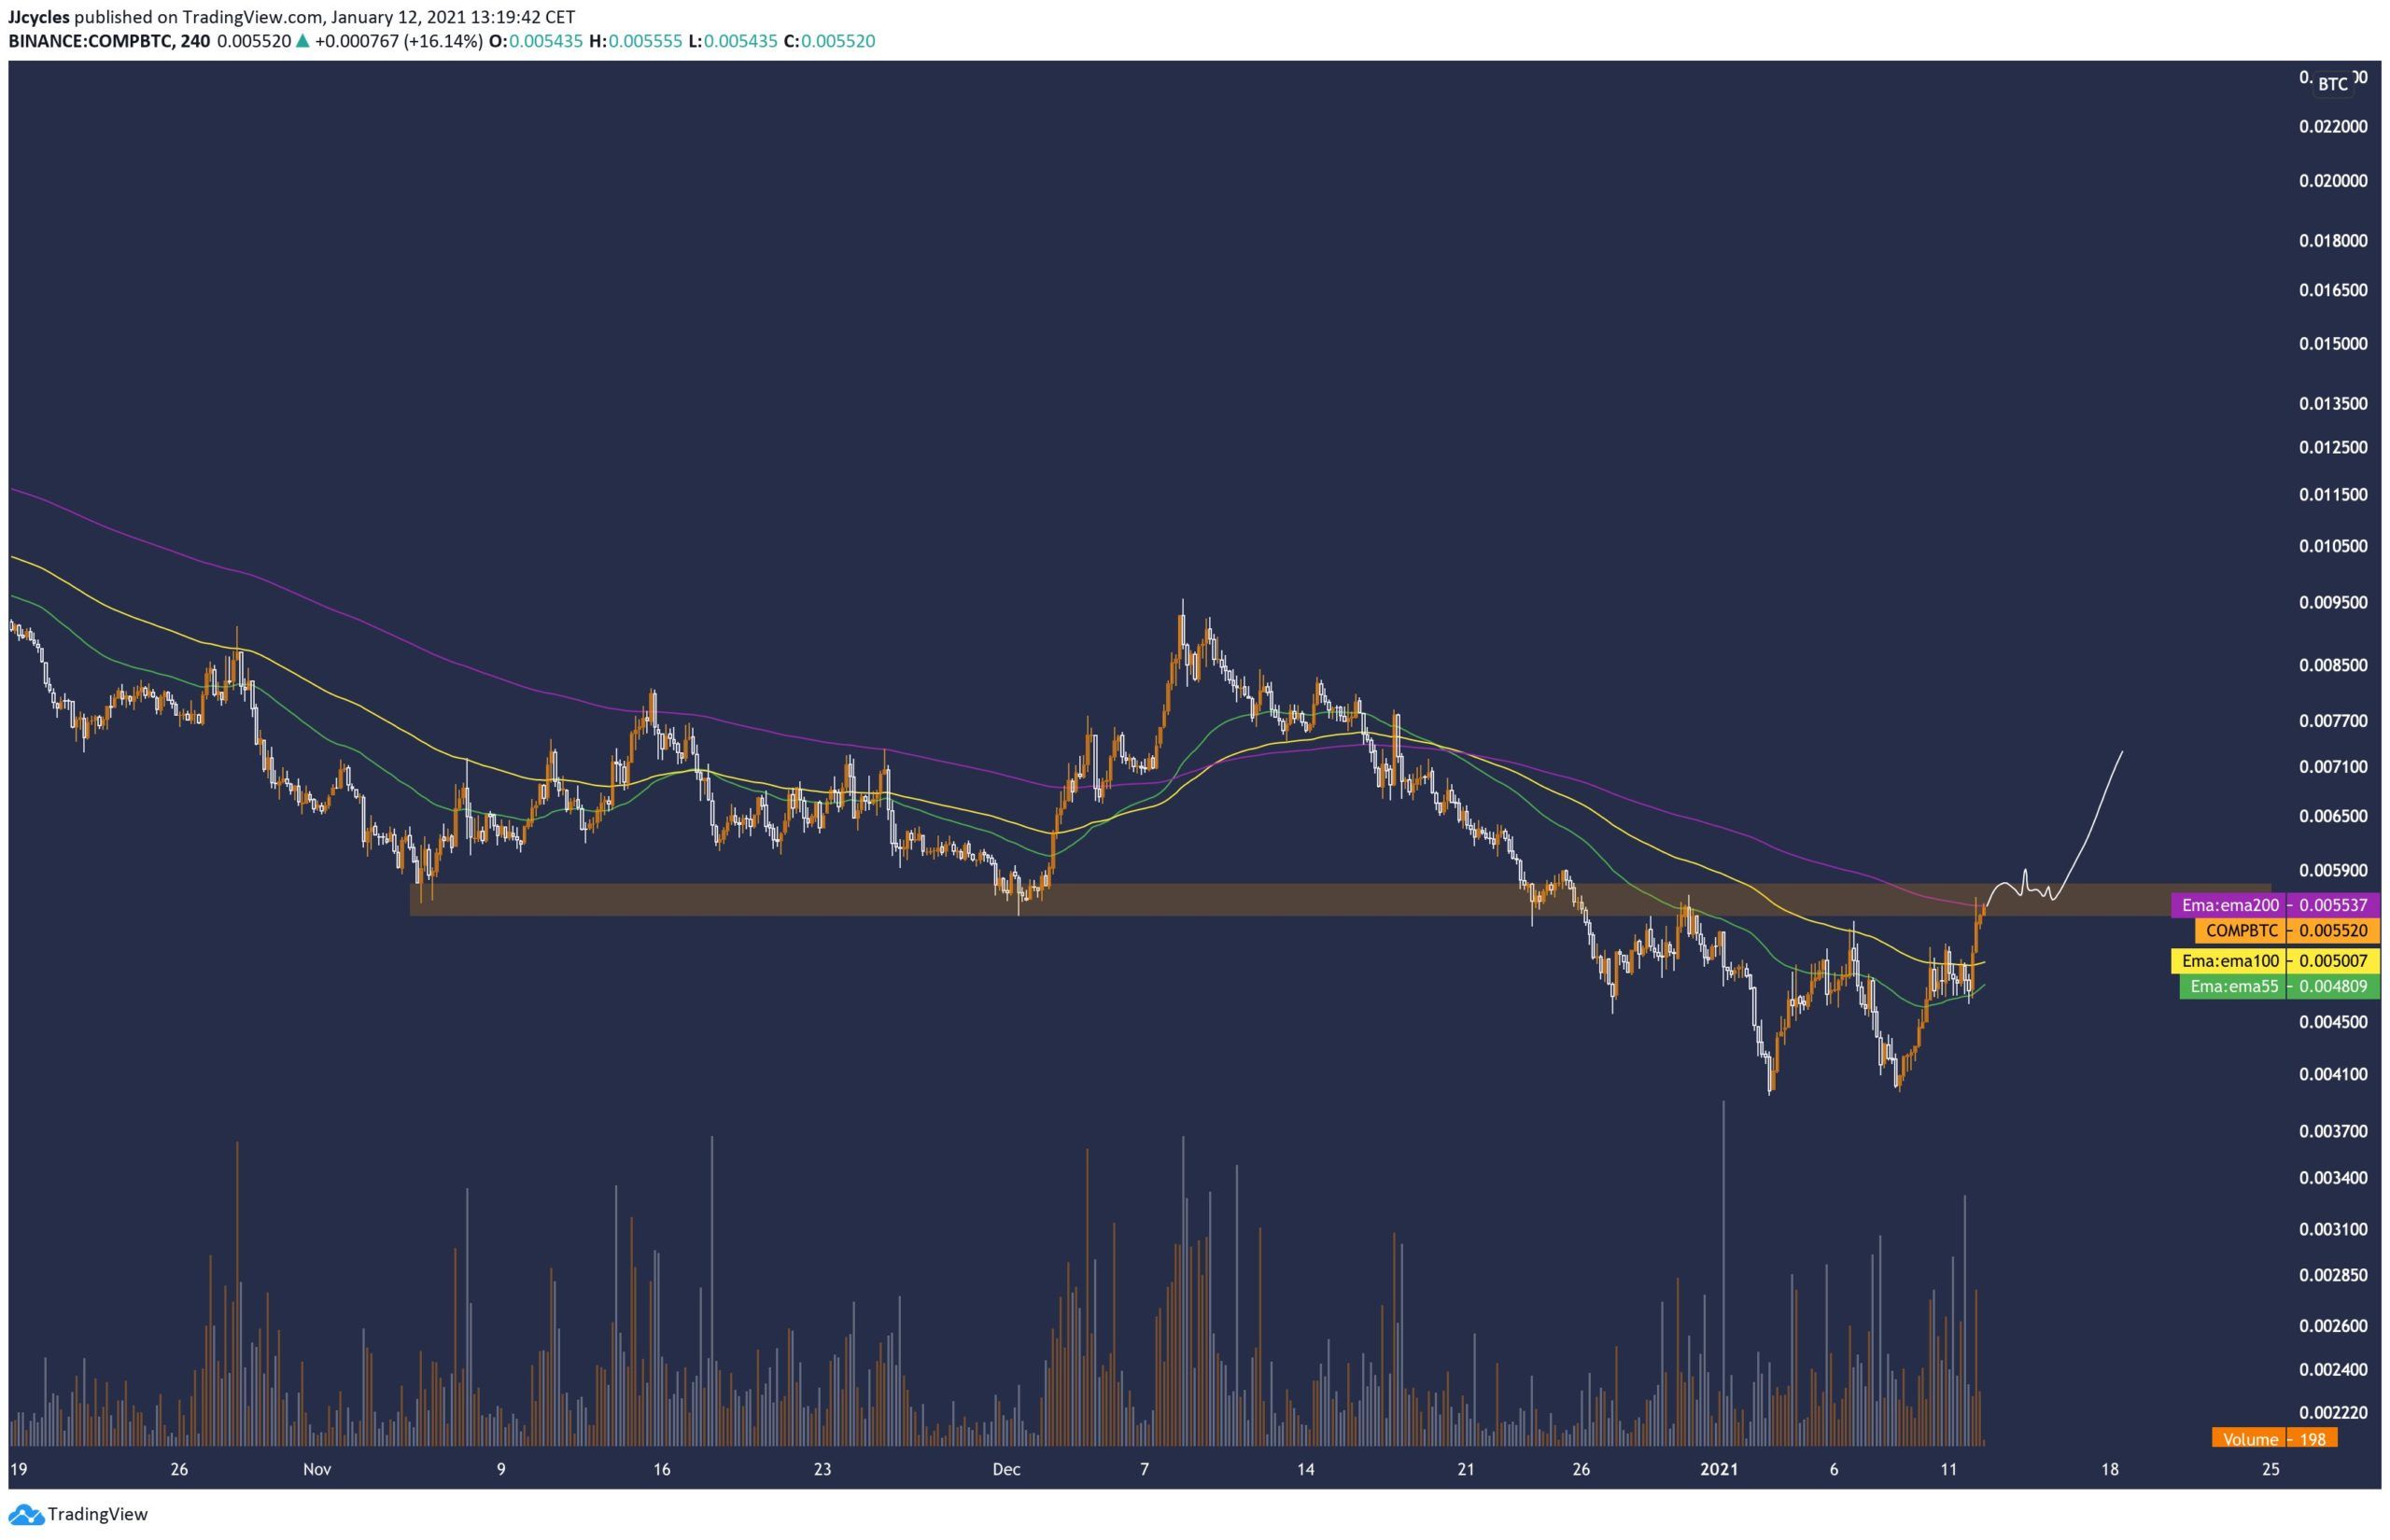
Since the tweet, it has reclaimed the support area at ₿0.0057 and has been moving upwards since. If it continues to rally, the next resistance area would be at ₿0.0074, the 0.618 Fib retracement of the downward movement.
Technical indicators support the continuation of the upward move. Therefore, as long as prices are trading above ₿0.0057, the short-term trend is bullish.
Conclusion
To conclude, both COMP/USD and COMPT/BTC should continue increasing towards their closest resistance areas at $265 and ₿0.0074, respectively.
For BeInCrypto’s latest Bitcoin (BTC) analysis, click here!
Disclaimer: Cryptocurrency trading carries a high level of risk and may not be suitable for all investors. The views expressed in this article do not reflect those of BeInCrypto.


