


Compound (COMP) has unsuccessfully attempted to move above the $515 resistance area since July 6.
After a drop on Sept 7, it regained its footing and could soon make another breakout attempt. If it does, it would confirm that it is in a bullish impulse.
COMP attempts breakout
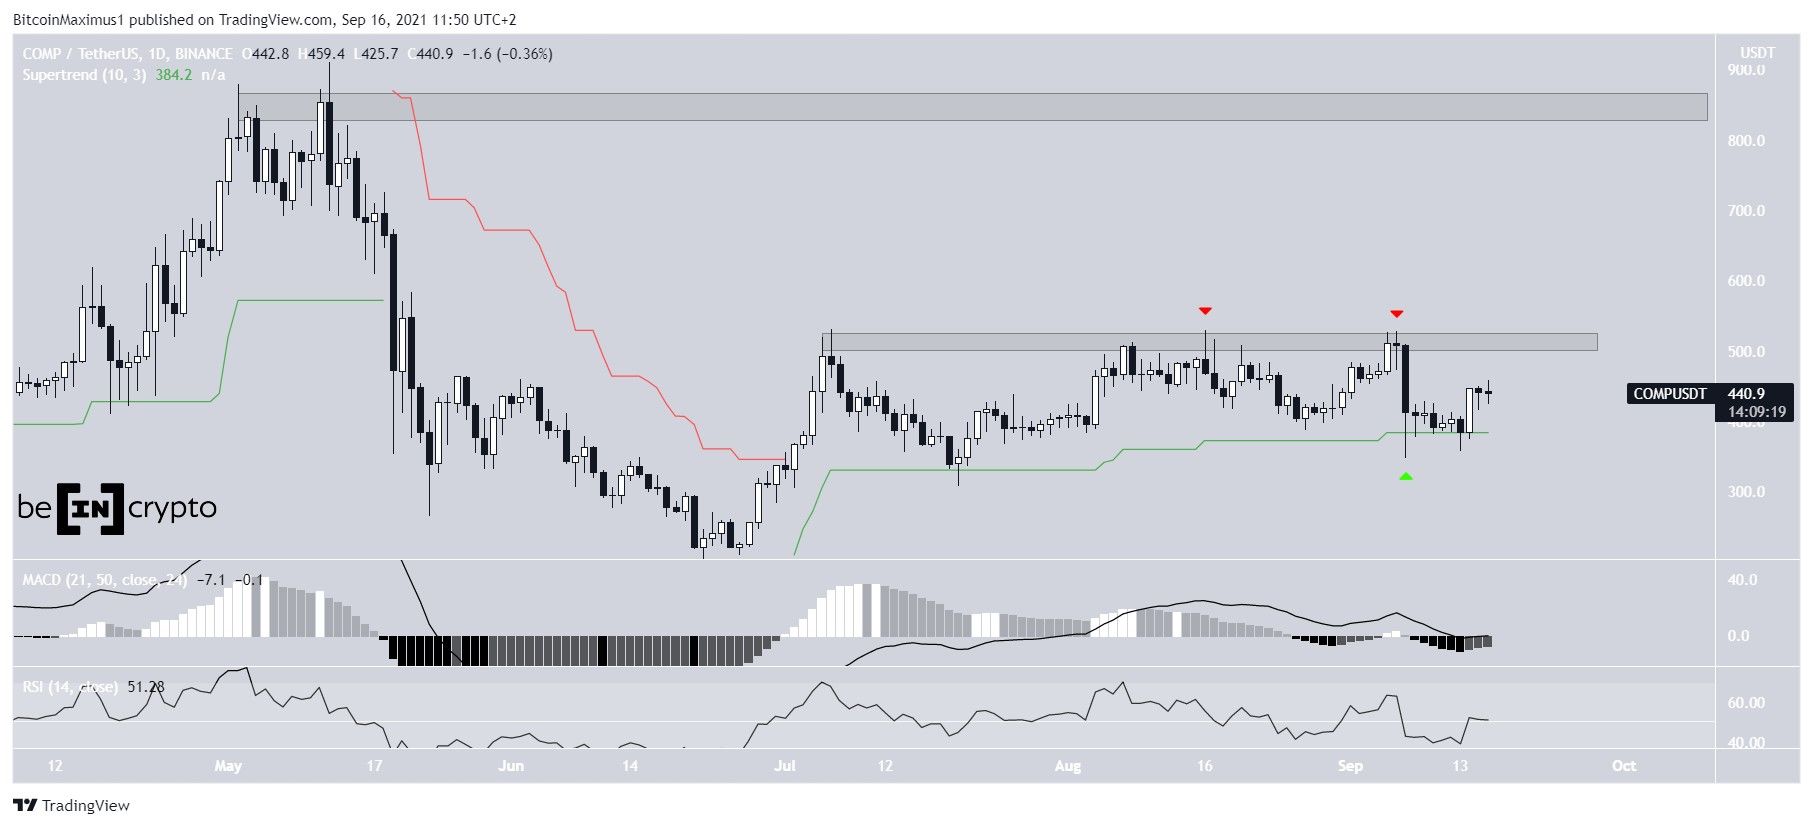
COMP initiated an upward movement on June 22, which led to a high of $531 on July 6. However, it failed to break out, and instead validated the $515 area as resistance. Since then, it has made two more unsuccessful breakout attempts (red icons).
Despite the ensuing drop, technical indicators are still bullish. COMP is still trading above the Supertrend support line, having validated it as support.
In addition to this, the RSI is close to moving above 50 and the MACD has nearly given a bullish reversal signal.
If a breakout above the $510 area transpires, COMP could increase all the way to the $850 highs, which were reached in May.
Wave count
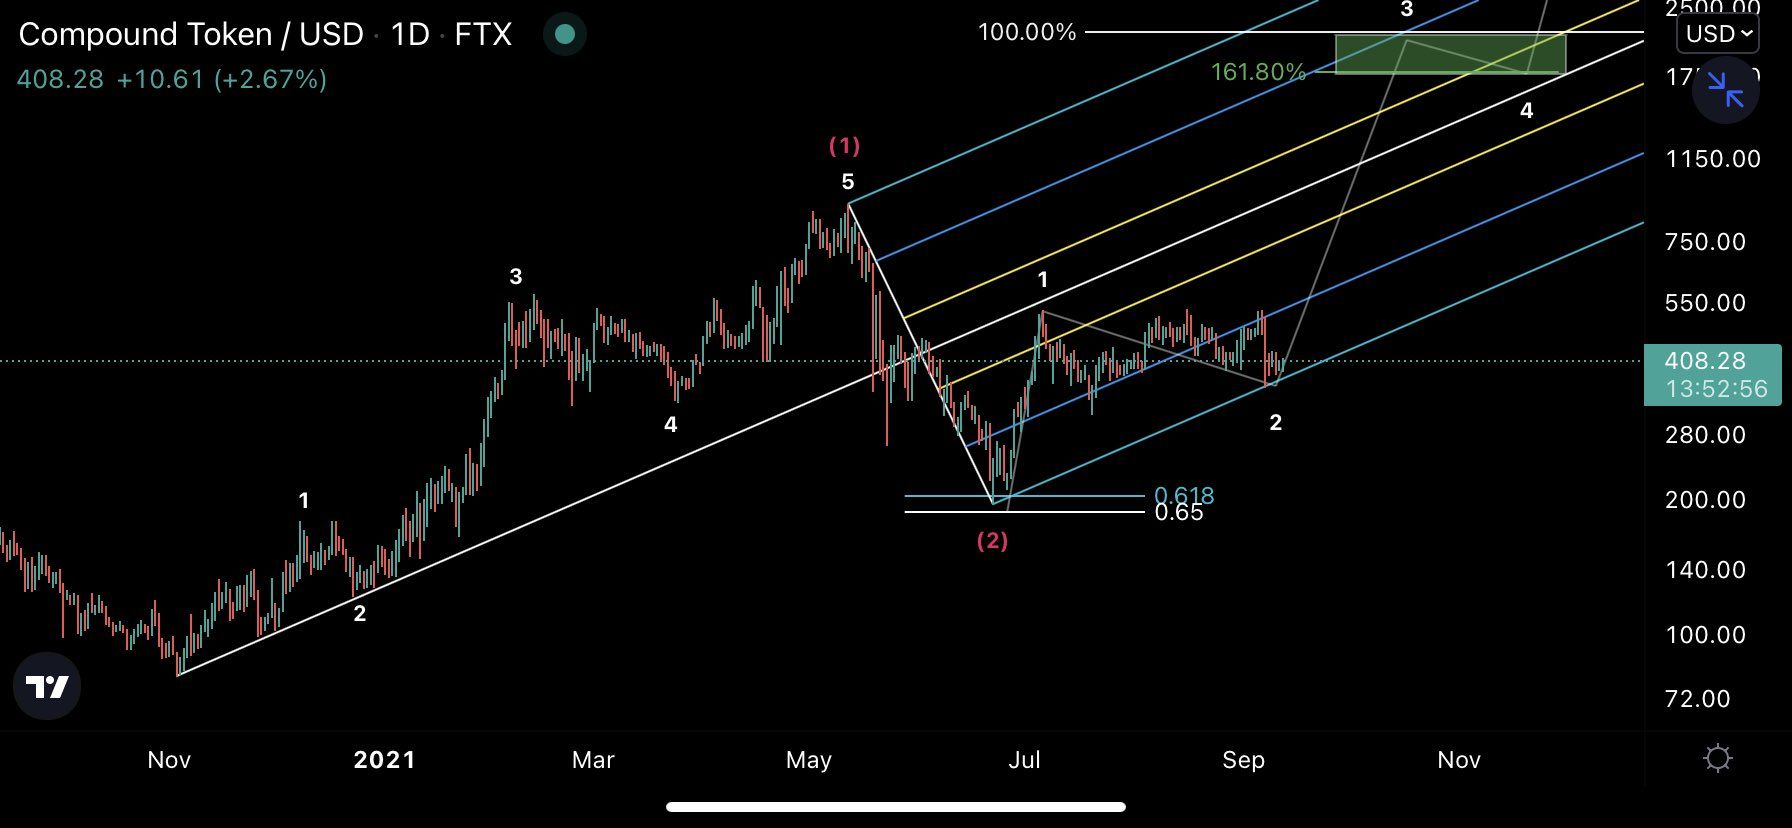
Cryptocurrency trader @Mesawine1 outlined a COMP chart, stating that it has potentially begun wave three of an extended bullish impulse. If correct, it would increase towards a new all-time high price.
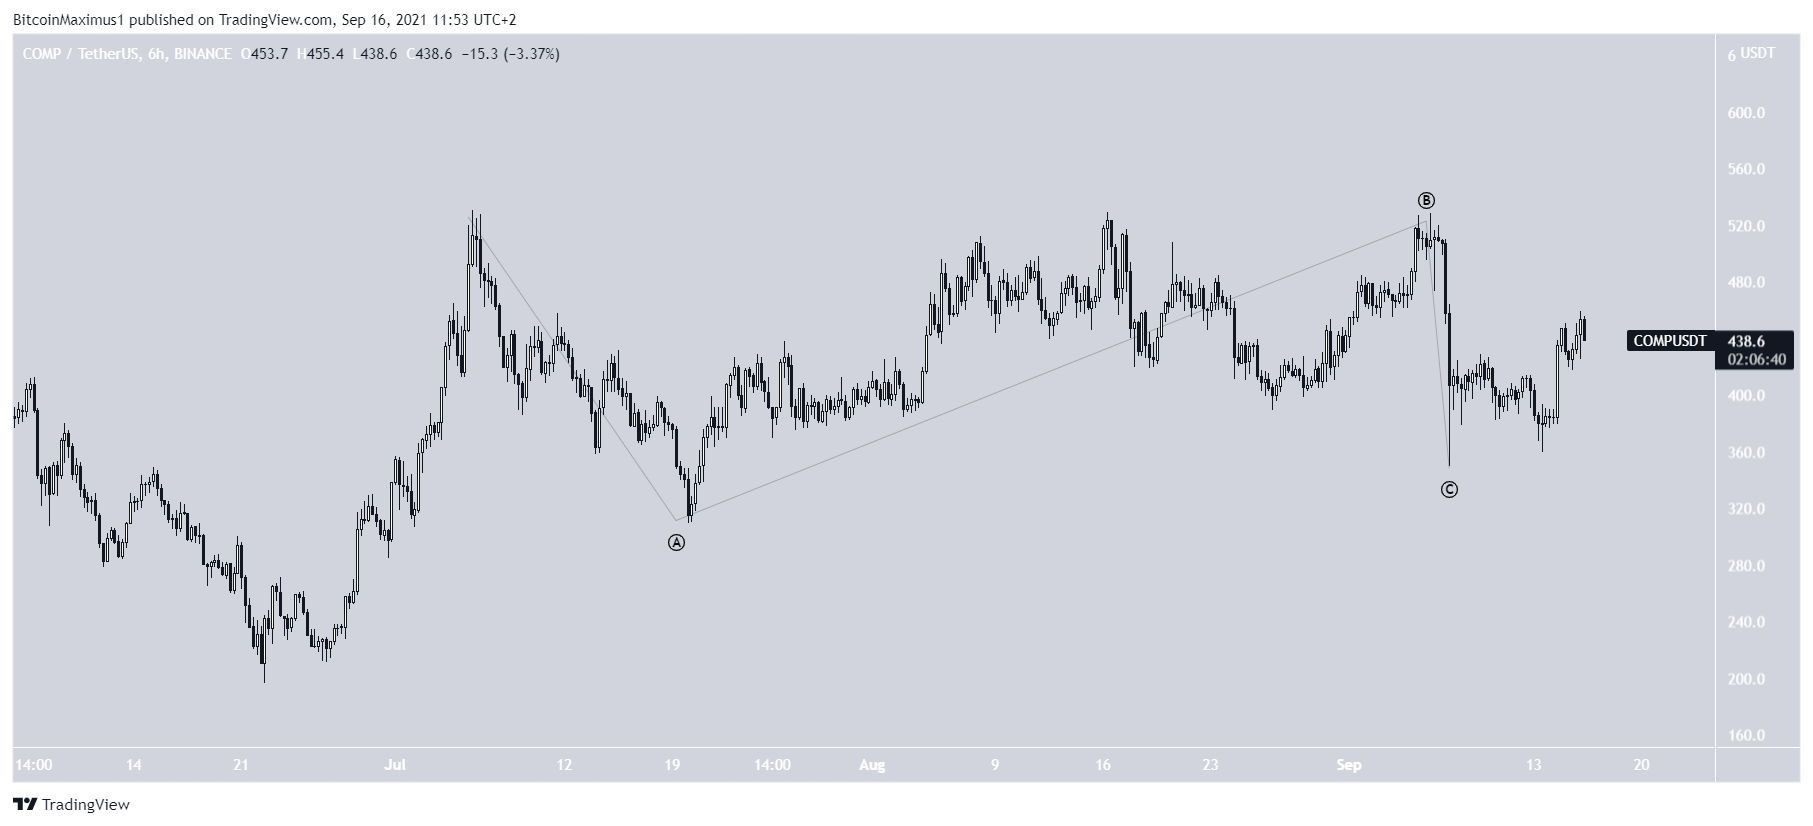
The short-term movement since July 6 does indeed look like a corrective structure, due to it being very gradual and choppy.
Therefore, it is possible that it was an A-B-C formation (black), which ended with the Sept 7 low.
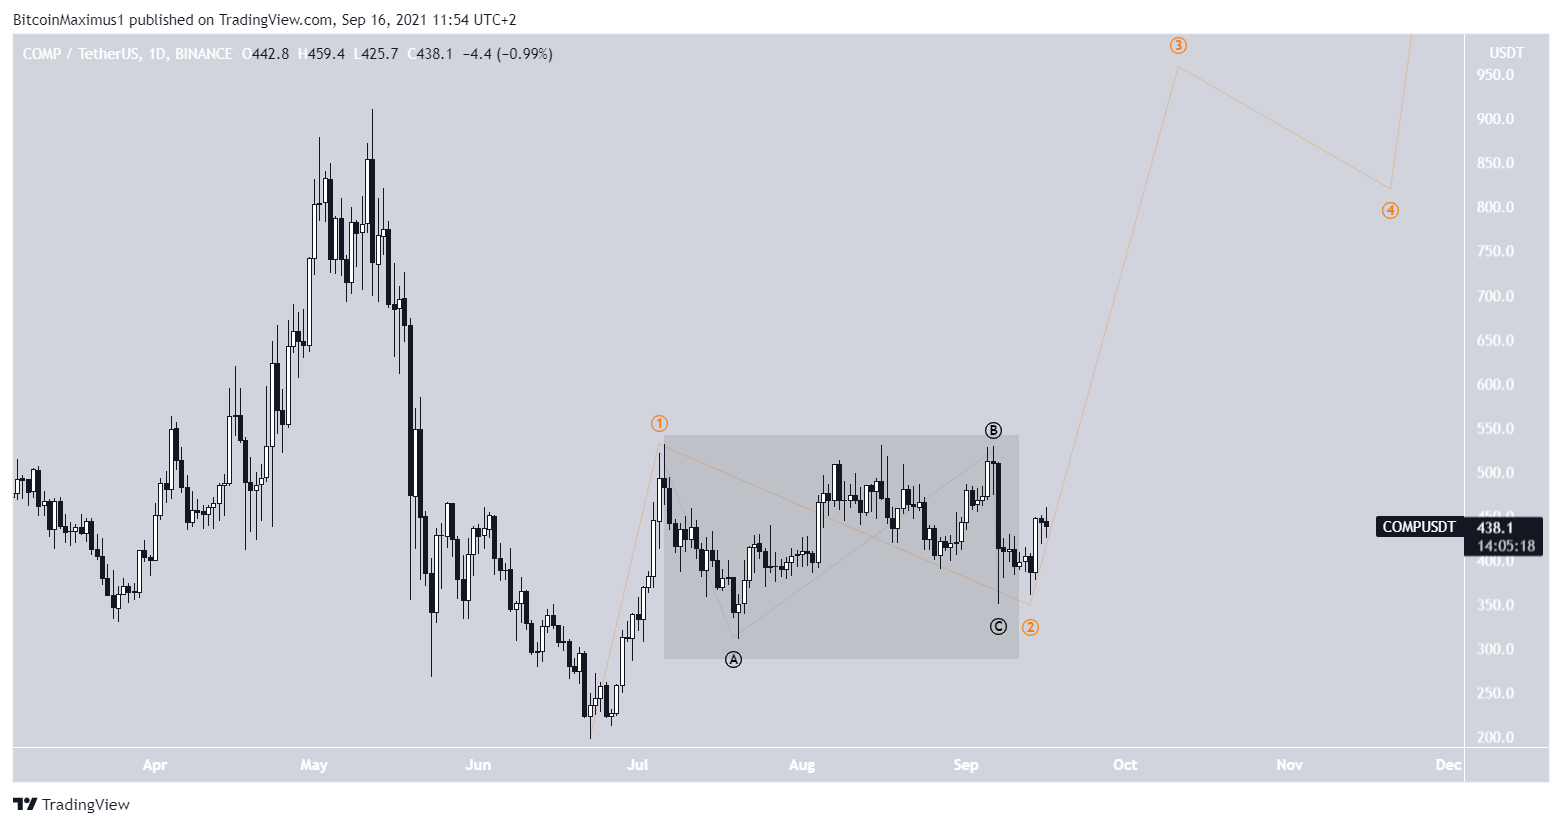
In this case, the entire correction would be part of wave two of a bullish impulse (orange). If correct, wave three would likely take COMP towards a new all-time high and beyond, since it is the wave that most often extends.
However, at the current time, we cannot determine more exact targets for the top of the upward movement.
For BeInCrypto’s latest Bitcoin (BTC) analysis, click here.



