


The Compound (COMP) price briefly reached an all-time high price on Sept 1, but was rejected the same day and dropped sharply afterward.
The price is expected to find support near $205 before resuming its upward movement.
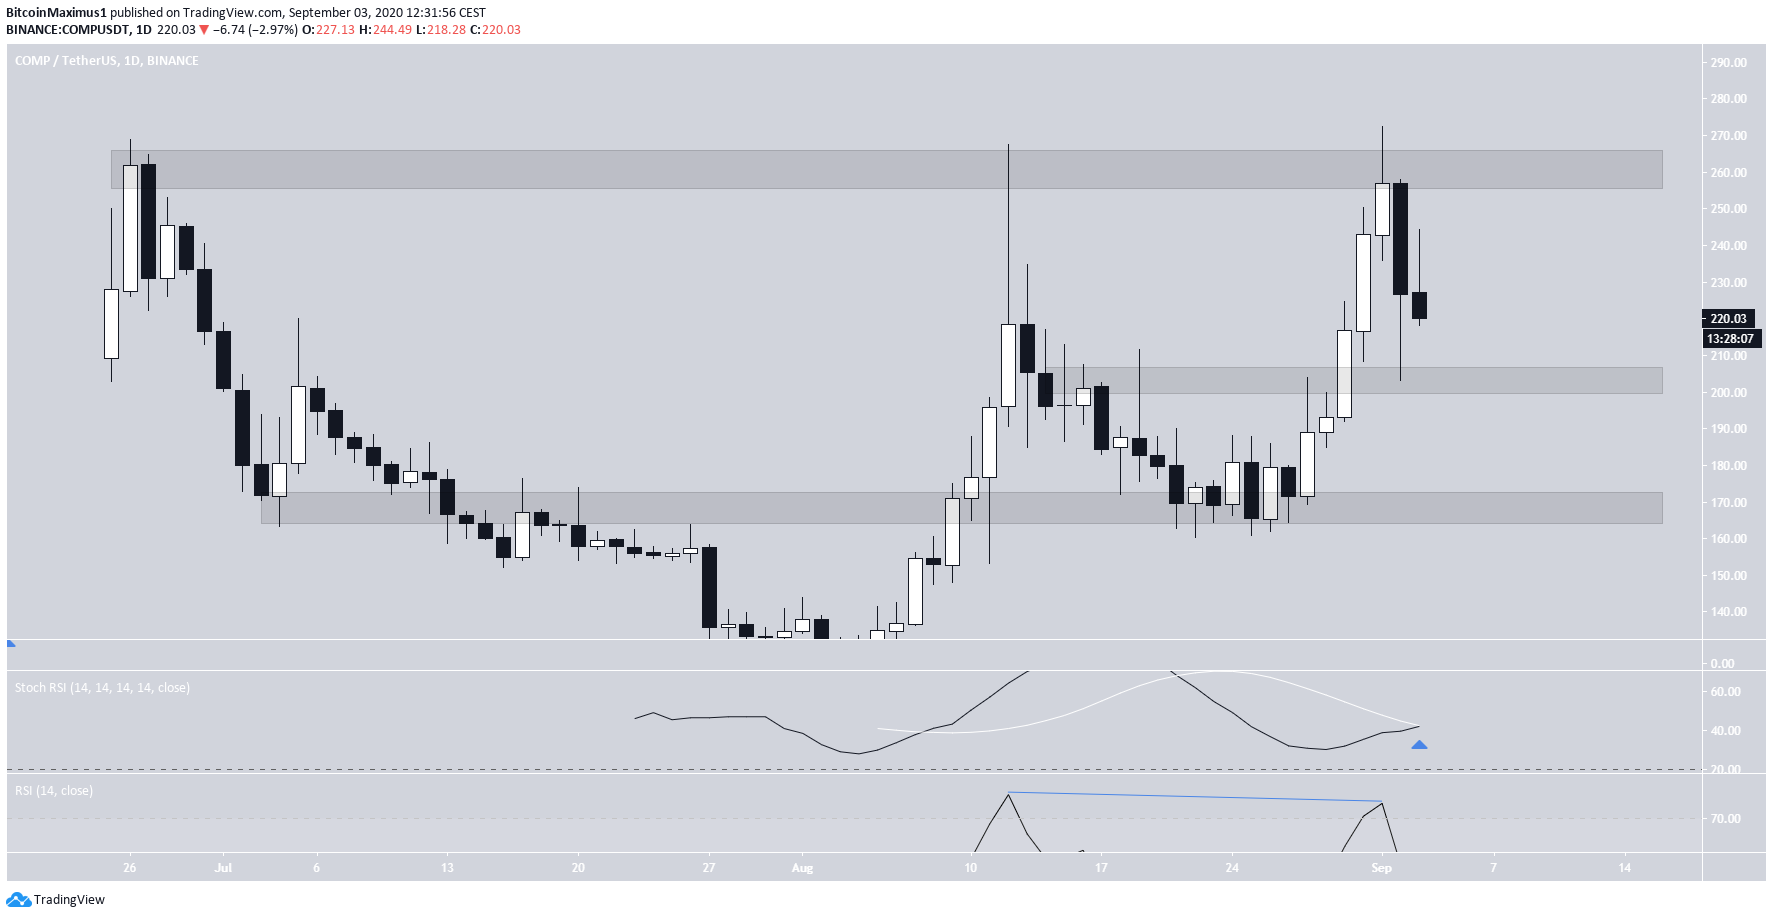
COMP Long-Term Trading Range
The COMP price has been increasing at an accelerated rate since Aug 25 when it reached a low of $161. The increase continued until Sept 1 where COMP reached an all-time high of $272.61.
The price dropped sharply the next day and is now nearing the minor support area of $205. If this level fails, the next support would likely be found at $160.
Technical indicators provide a mixed outlook. The Stochastic RSI is in the process of making a bullish cross but has yet to confirm it. While there is a bearish divergence in the RSI, a drop has already occurred as a result of it.
However, as long as the minor $205 support area holds, COMP is expected to continue moving upwards.
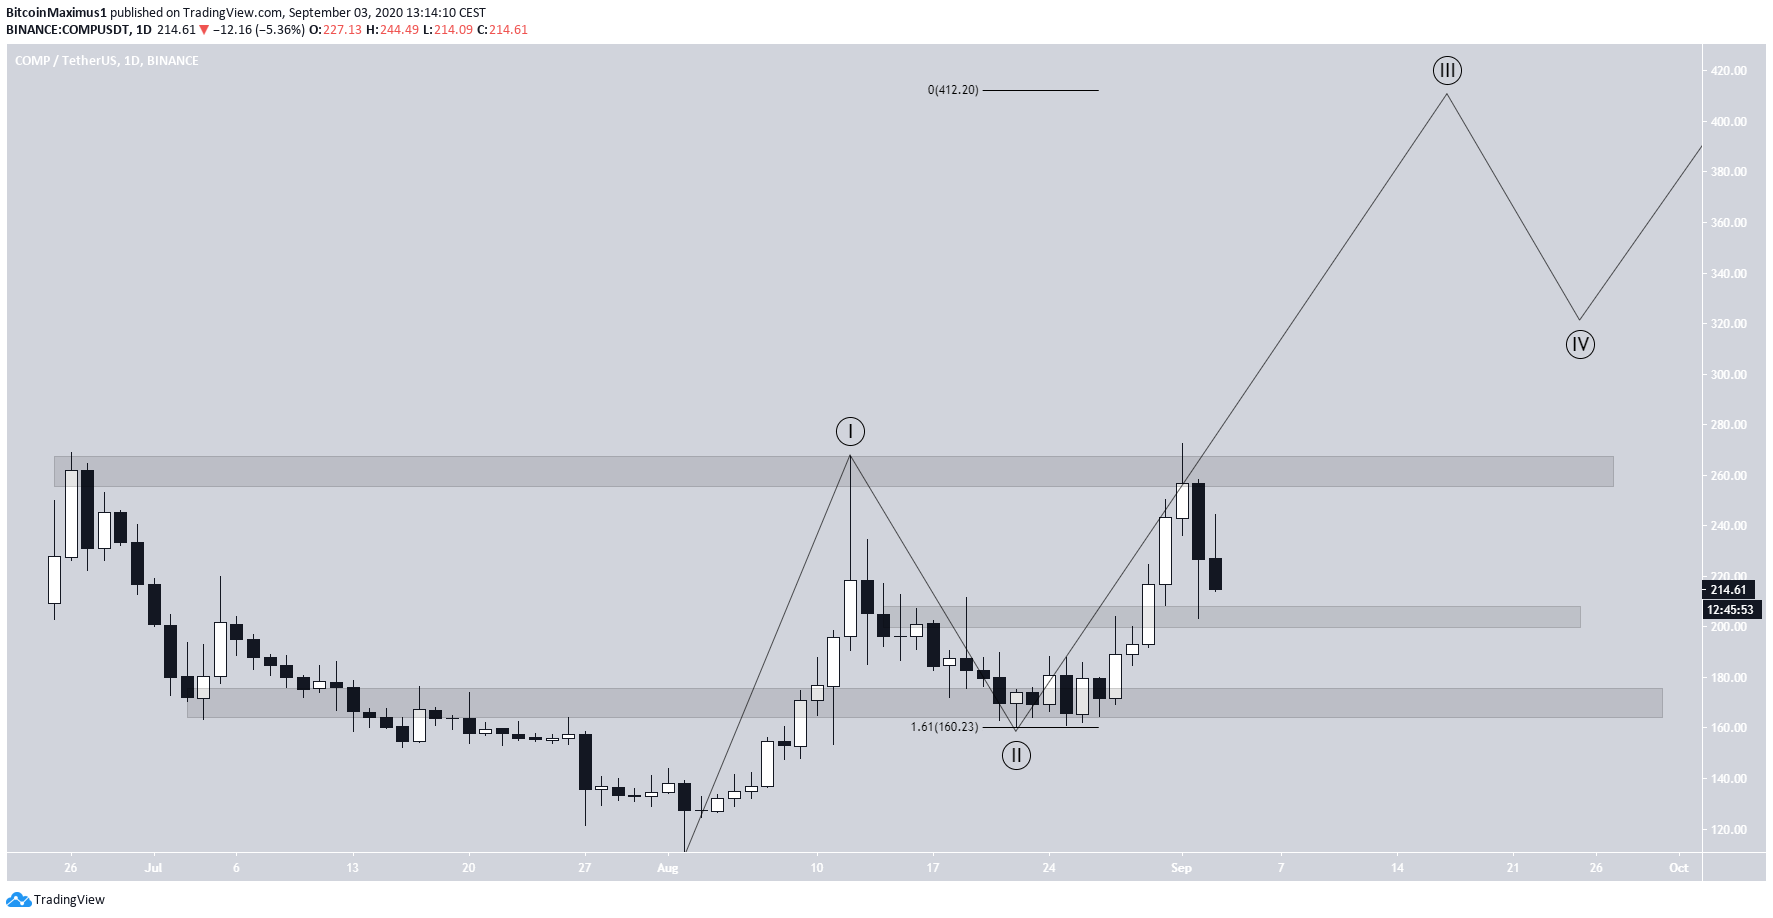
Wave Count
Cryptocurrency trader @damskotrades previously outlined a COMP chart before the breakdown which showed that the price had breached its previous all-time high but gave no targets if the upward move continued.
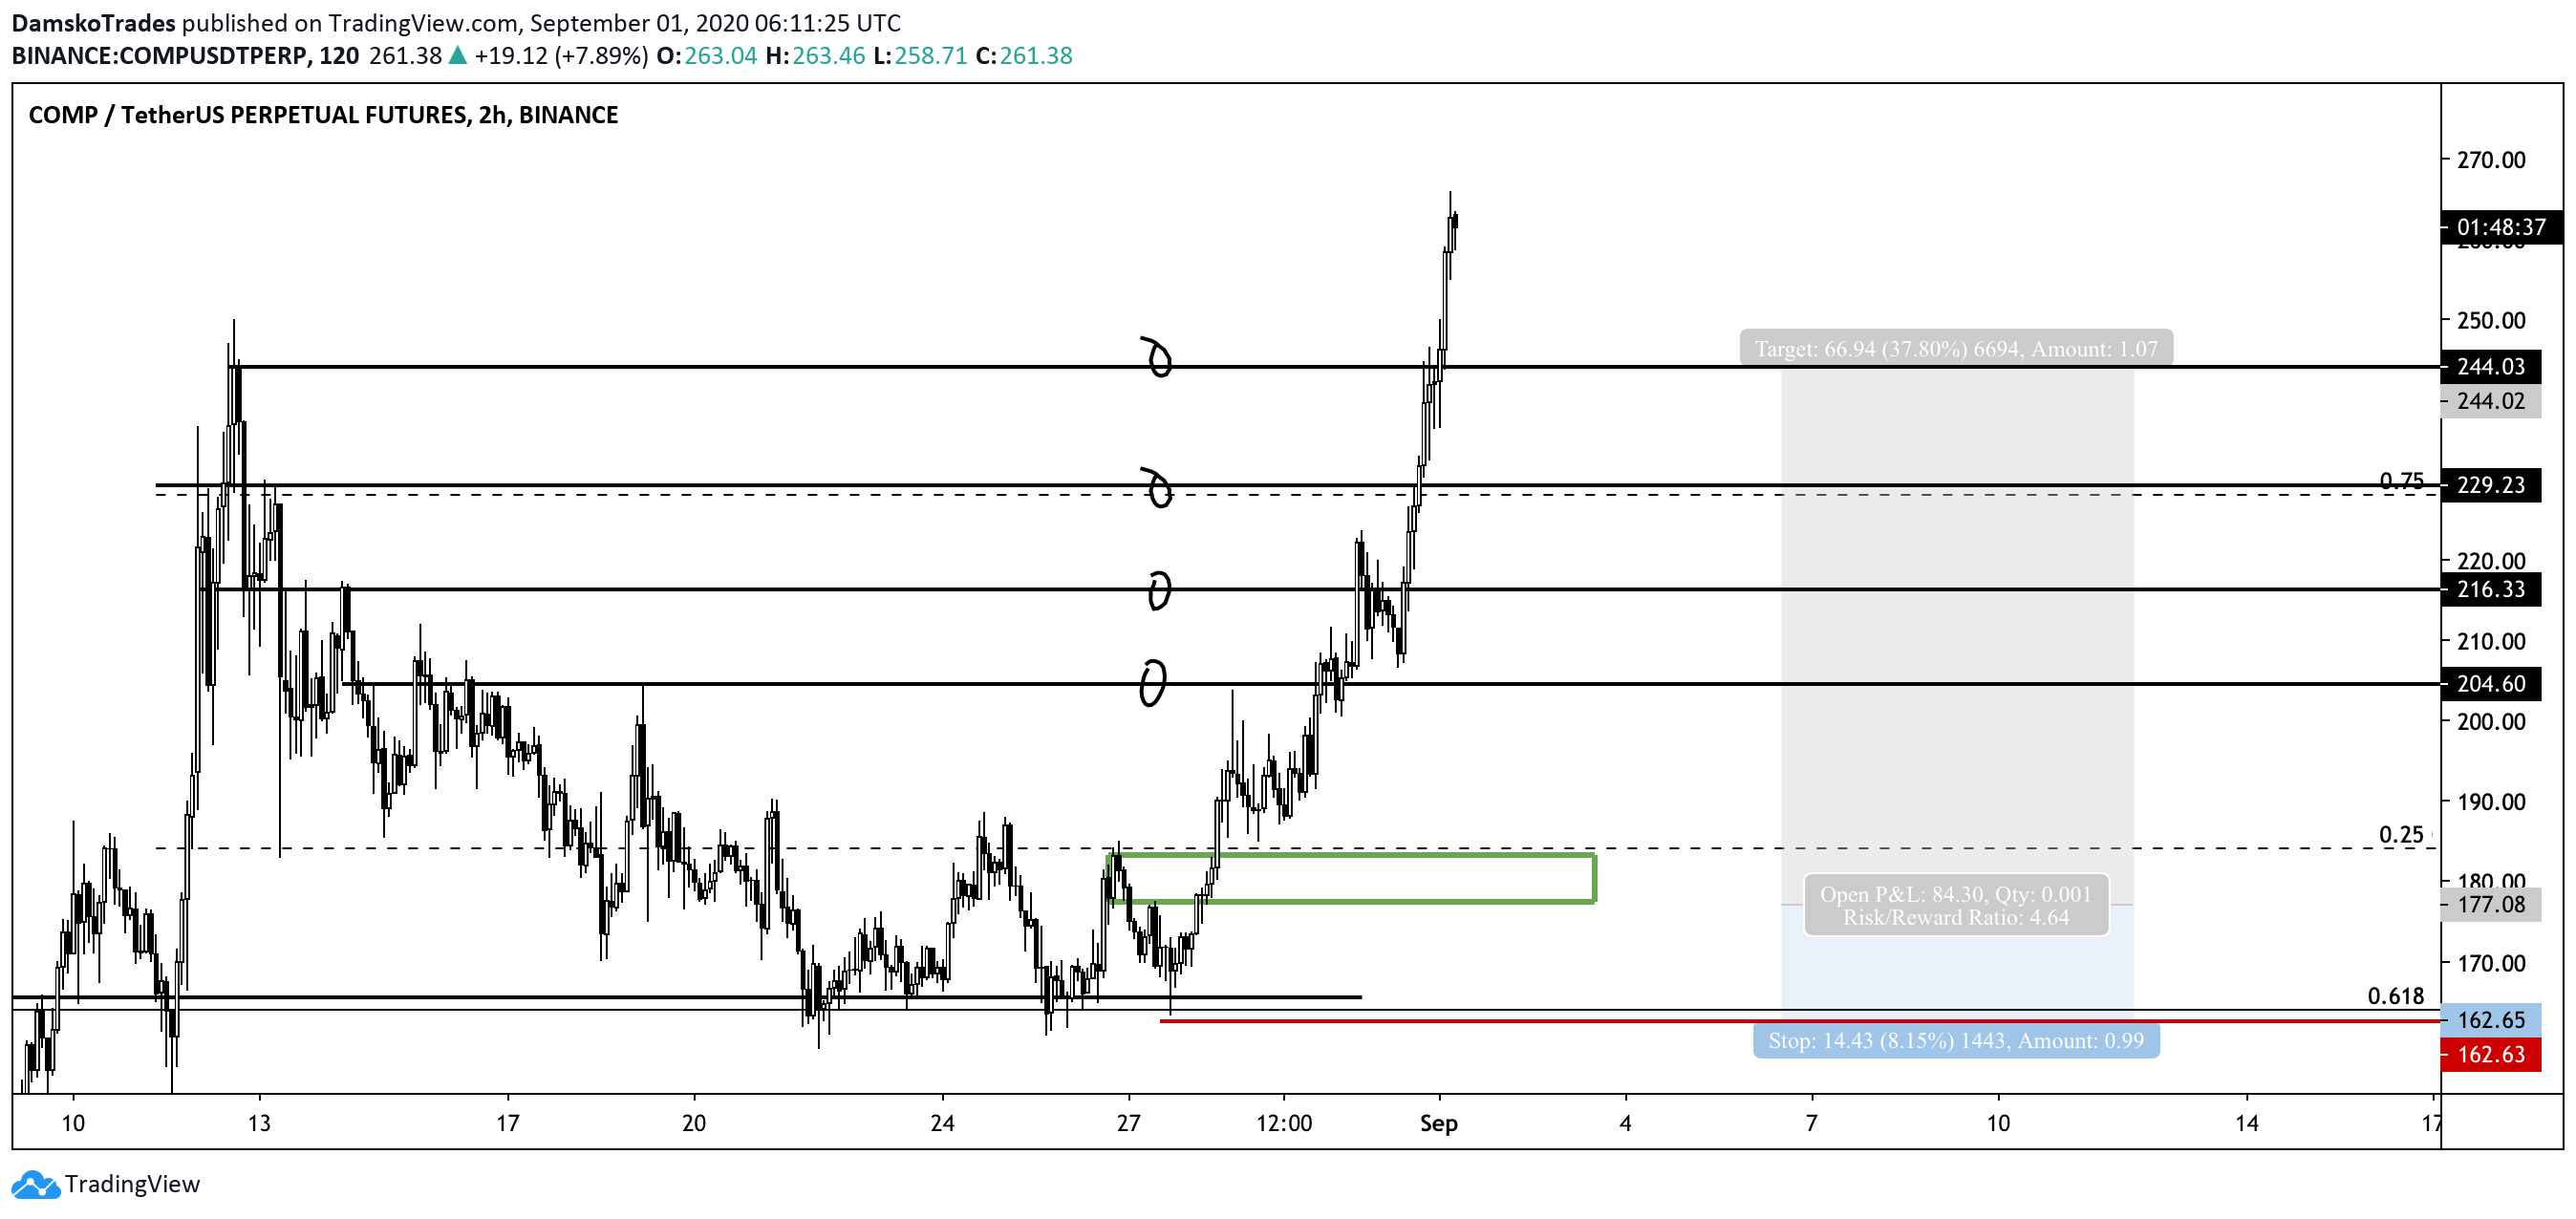
Since the tweet, the price made a new all-time high but dropped sharply afterward. Currently, it is attempting to find support at the minor $405 support area.
If the price bounces and makes another attempt at breaking the all-time high, the lack of overhead resistance afterward would take it into price discovery mode. Therefore, we need to use Fib levels in order to determine the next high.
The price has likely begun wave 3 of a bullish five-wave impulsive formation, the top of which could come at $412. The target is found by using the 1.618 Fib level of wave 1.
A decrease below the wave 2 low of $160 would invalidate this wave count.
Wave 3 is likely transpiring inside five sub-waves, and the price is currently in the fourth.
A decrease below the sub-wave 1 high at $190 prior to completing sub-wave 5 would invalidate this count.
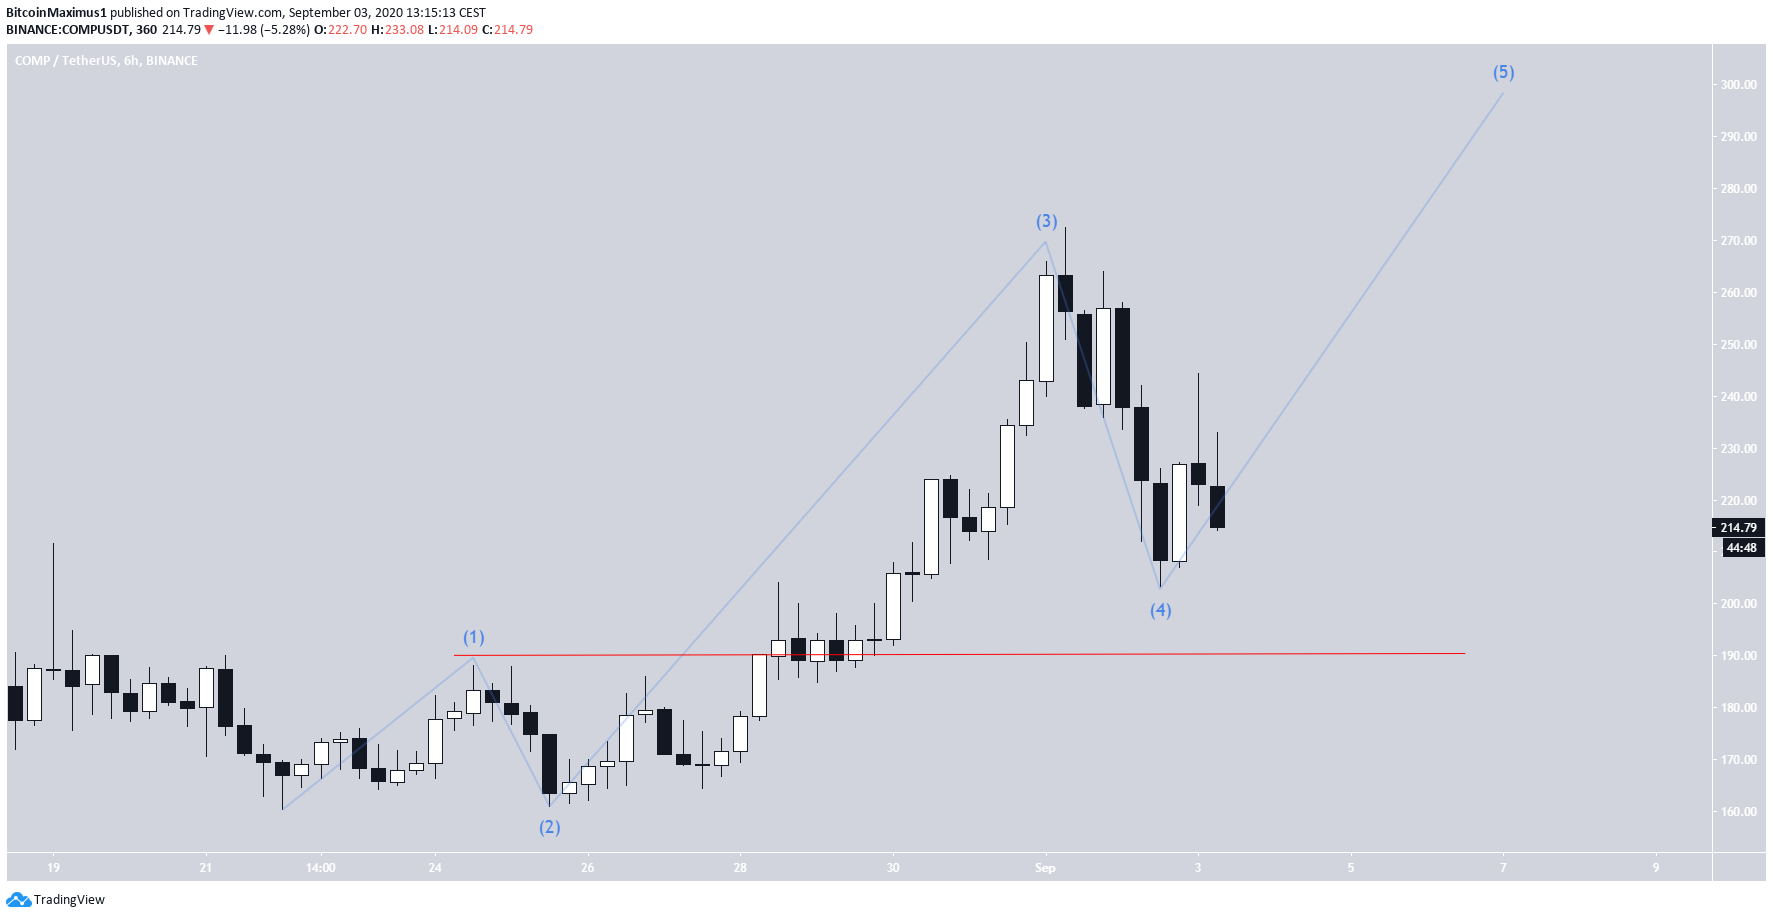
To conclude, the COMP price is expected to eventually break out above the $260 resistance area and continue reaching new highs, with the first target being $412.
To read BeInCrypto’s Bitcoin analysis for Sept 3, click here!


