


The Compound (COMP) price fell below the $128 area at the beginning of October and has been trading below it since.
However, the price seems to have reversed its trend and is likely to reach that area once more.
Breakdown From Support
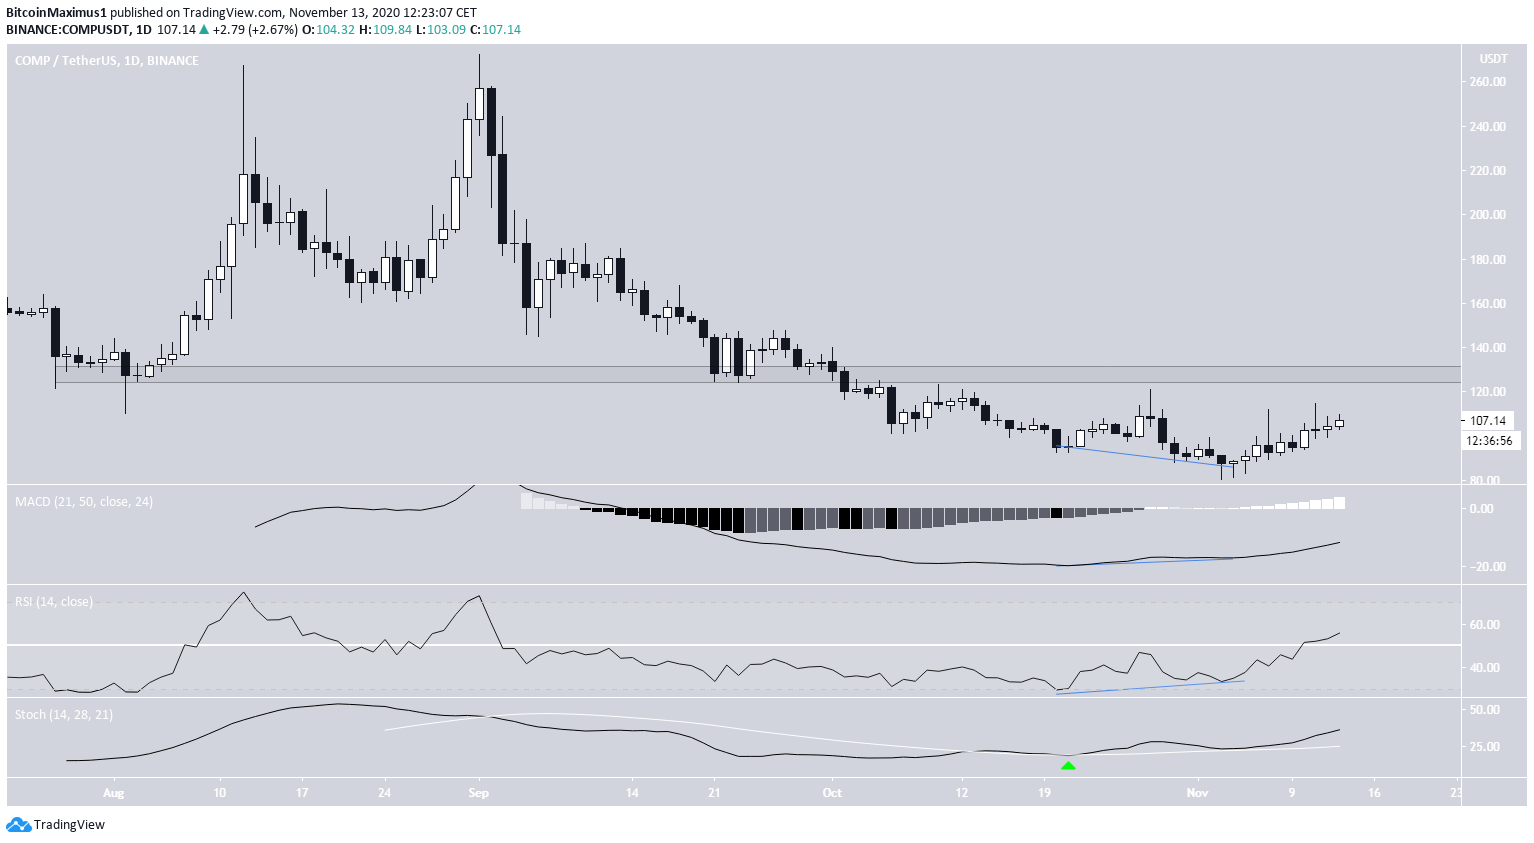
The COMP price has been declining since it reached a high of $272.61 on Sept 1. The fall briefly paused at the end of Sept, with the price seemingly finding support above $130, but COMP broke down shortly afterward and proceeded to reach an all-time low of $80.62 on Nov 3.
However, the previous all-time low included bullish divergence on the RSI and the MACD, both of which are moving upwards. Furthermore, the Stochastic Oscillator has made a bullish cross, confirming the upward trend.
Therefore, the COMP price should reach the $130 area.
Cryptocurrency trader @VentureCoinist stated that since other DeFi coins are pumping, COMP could be the next one in line, targeting the $150 area for the next upward move.
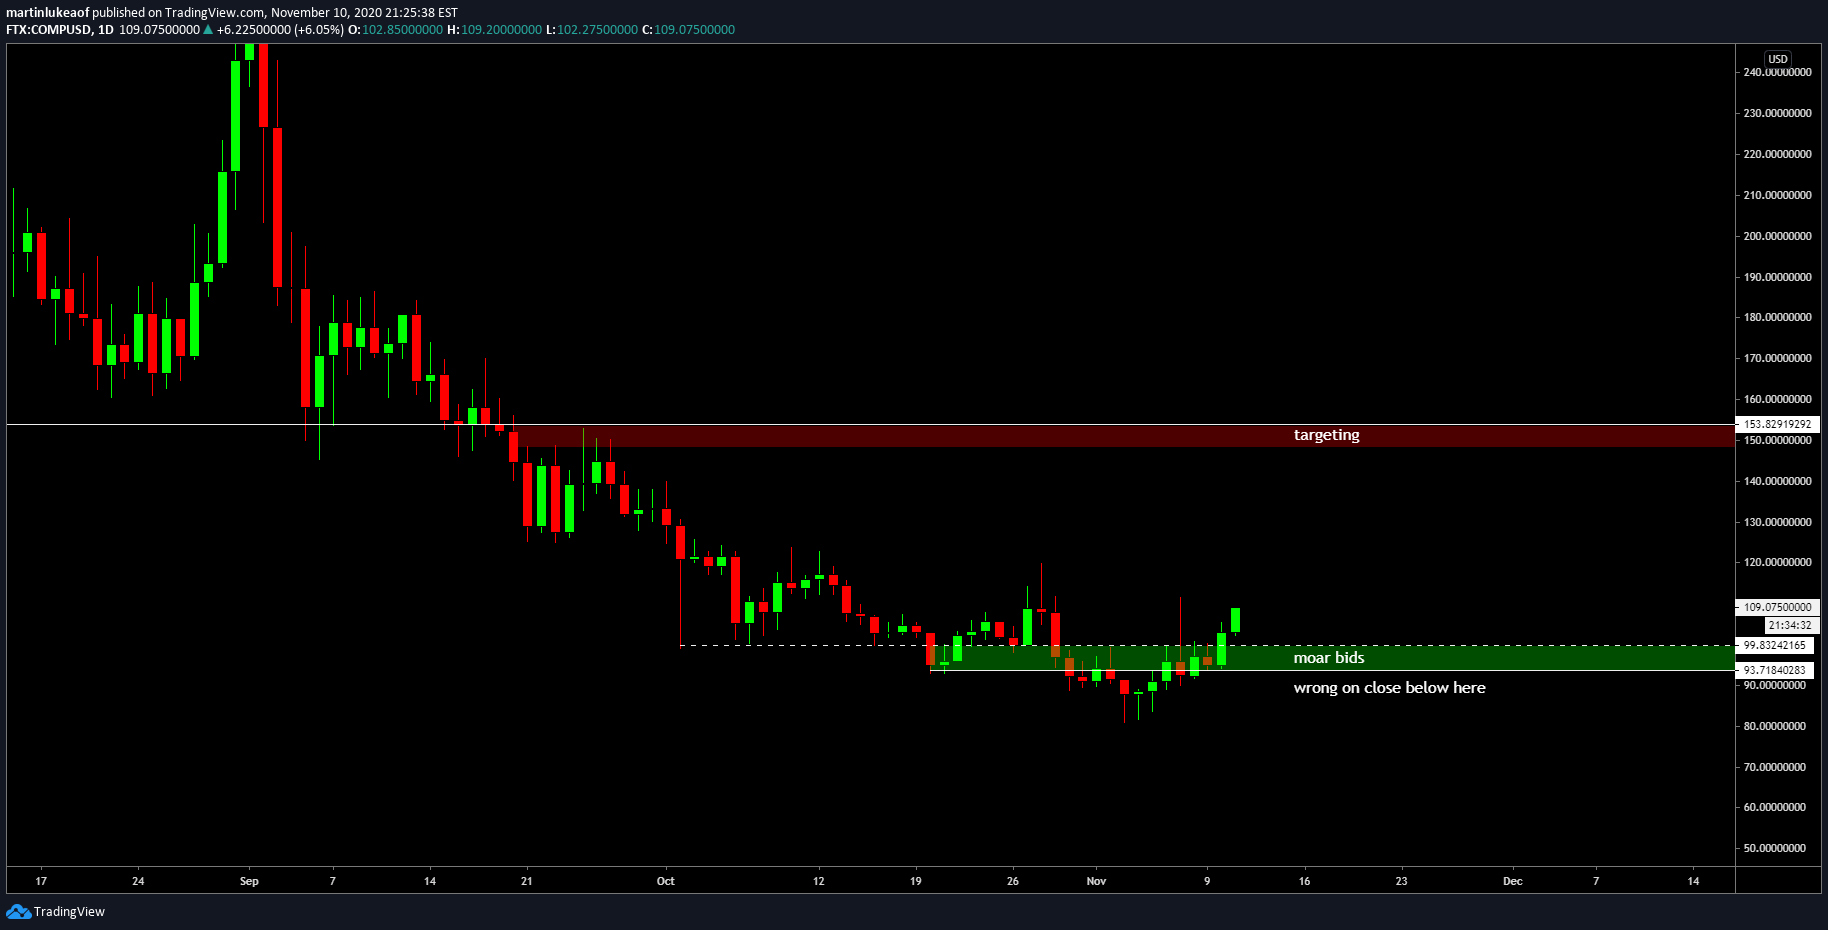
If the price successfully moves above $130, the next resistance area would be at $150. However, at the current time, we cannot confidently state that the price will break out successfully. Some patience is required until the price trades close to that area.
Short-Term Movement
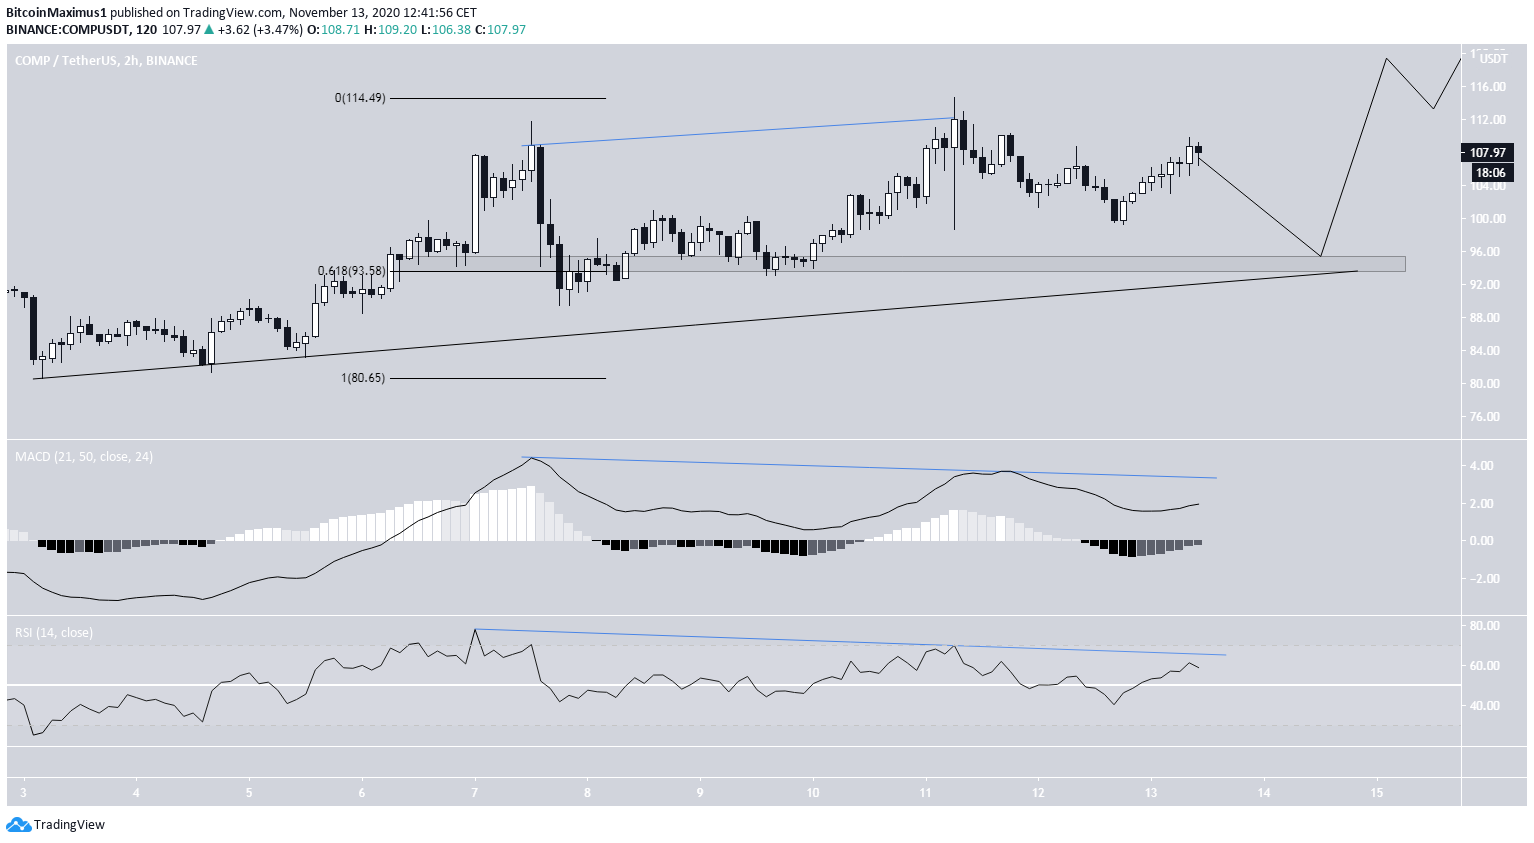
The shorter-term two-hour chart shows that the price is following an ascending support line, having done so since it reached the previously-mentioned all-time low. The line is currently near $94.
While the price has created a series of higher lows, there is significant bearish divergence developing on both the RSI and the MACD, whose trend-line has yet to be broken.
Unless the trend-line is broken, COMP will likely drop towards the $94 area, which is both the 0.618 Fib level of the upward move and coincides with the ascending support line, before eventually moving towards the $130 resistance area.
Conclusion
To conclude, the COMP price could potentially drop in the short-term, before moving higher towards the $130 resistance area. At the time of writing, we cannot determine whether the price will break out or get rejected at $130.
For BeInCrypto’s previous Bitcoin analysis, click here!
Disclaimer: Cryptocurrency trading carries a high level of risk and may not be suitable for all investors. The views expressed in this article do not reflect those of BeInCrypto


