


The Bitcoin price decreased rapidly from March 11-13. Since then, it has been on a gradual upward trend, recouping the majority of its losses.
The same cannot be said about the stock market, even though the federal reserve has taken drastic measures, conducting cash injections of more than Bitcoin’s entire market cap. Cryptocurrency trader and analyst @Josh_Rager tweeted a chart comparing the movement of the BTC price and that of the S&P 500 on March 23. While not a perfect correlation, he argues that there are many similarities between the two.
https://twitter.com/Josh_Rager/status/1242117208786034688
Previously, we did a long-term comparison of the correlation between the two. In today’s article, we will compare their movement since the March 13 rapid decrease.
Bitcoin
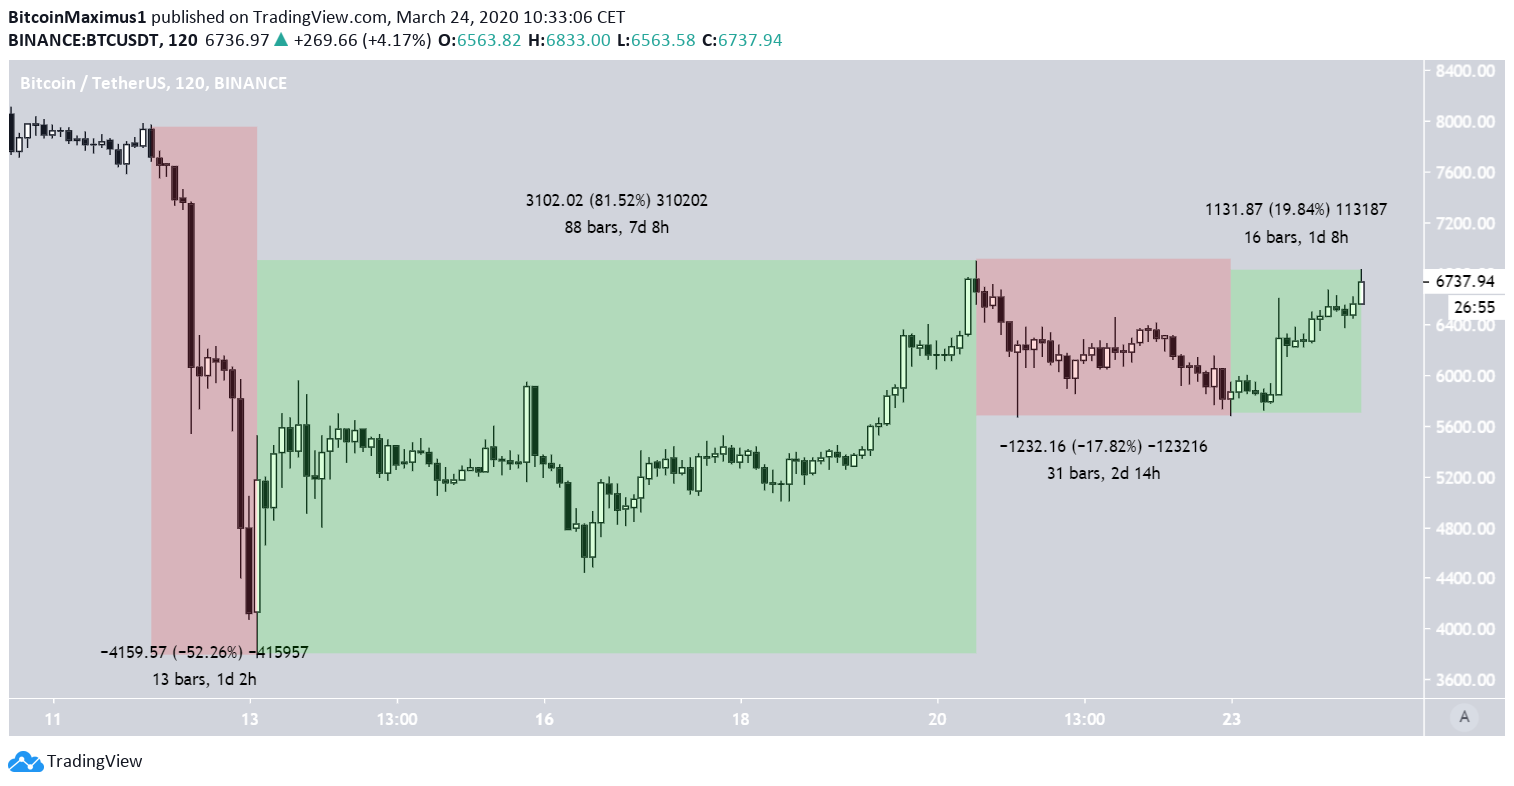
The Bitcoin decrease began near the end of March 11. The price decreased by a massive 52% in a span of slightly more than one day. This was followed by an upward move that lasted for more than seven days. During it, the price increased by 81%, almost recouping all of the previous losses. This was followed by a shorter correction and an upward move, which cancelled each other out.
All in all, the BTC price has recouped the majority of its losses from March 11-13, currently being only 15% below the price on March 11.
S&P 500
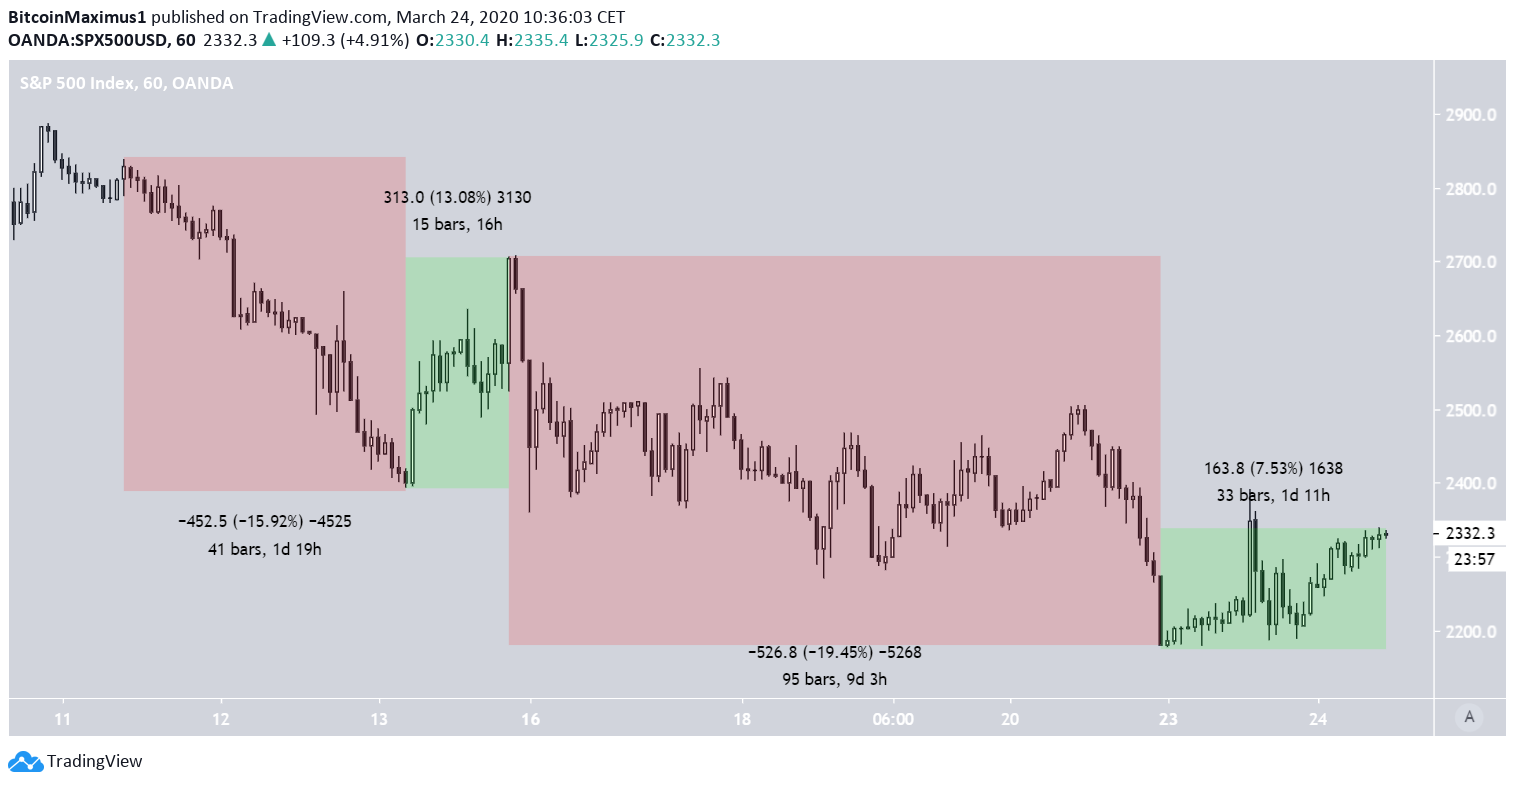
A glance at the S&P 500 chart shows that the downward moves have been much stronger relative to their upward moves and have lasted a lot longer.
The first decrease took one day and 19 hours, causing the price to drop by 16%. This was followed by a sharp upward move of 13% in less than a day, which could have occurred as a result of the operations of the Federal Reserve. However, that was futile, since the price went down by 20% in the next nine days. It has been increasing ever since.
Relative to the price on March 11, the S&P 500 has decreased by 18%. While this is only a fraction higher than the decrease for BTC, it is worth mentioning that the BTC moves are much more volatile in both directions. Therefore, if in absolute terms the decrease/increase is bigger, it means that the asset has under/over-performed by a lot.
Conclusion
To conclude, the rapid decrease beginning on March 11 has been drastic for both stocks and cryptocurrencies. However, the stock market has fared much worse, both in absolute and relative terms, despite the ongoing attempts by the federal reserve to halt the bleeding.


