
The Bitcoin price movement since reaching an all-time high in December 2017 has led many to dismiss the asset as merely a financial bubble.
There have been numerous bubbles throughout financial history. Even after popping, the asset has usually stabilized afterward and, eventually, reached a higher high.
Bitcoin (BTC) Price Highlights
- The current Bitcoin price movement shares numerous similarities with that of NASDAQ after 2000.
- The price could still be in its “disbelief” phase.
- A breakdown below $3200 would invalidate this possibility.
One such event has been the NASDAQ price during the dot-com bubble. The price movement in NASDAQ shares numerous similarities to that of Bitcoin since the price reached an all-time high in December 2017. If the similarities continue, the current decrease will be the final low prior to a multi-year upward trend.
Trader @BTC_JackSparrow presented a bullish case for BTC, stating that the price has made the final low in its disbelief phase prior to moving upward. He used a chart of NASDAQ from the dot-com bubble in order to make his point.
Maybe you missed it but I think this thread makes a compelling bull case
I could be wrong (invalidation W1 <$3850) and being wrong would hurt since I am taking significantly more risk than I generally accept
I am putting my money where my mouth is
Chart by @kenzboard https://t.co/qXqFLkjMg4 pic.twitter.com/shIOWRJGC0
— //Bitcoin 𝕵ack 🐐 (@BTC_JackSparrow) March 15, 2020
Let’s compare these two movements and determine if there is any truth to this comparison.
NASDAQ
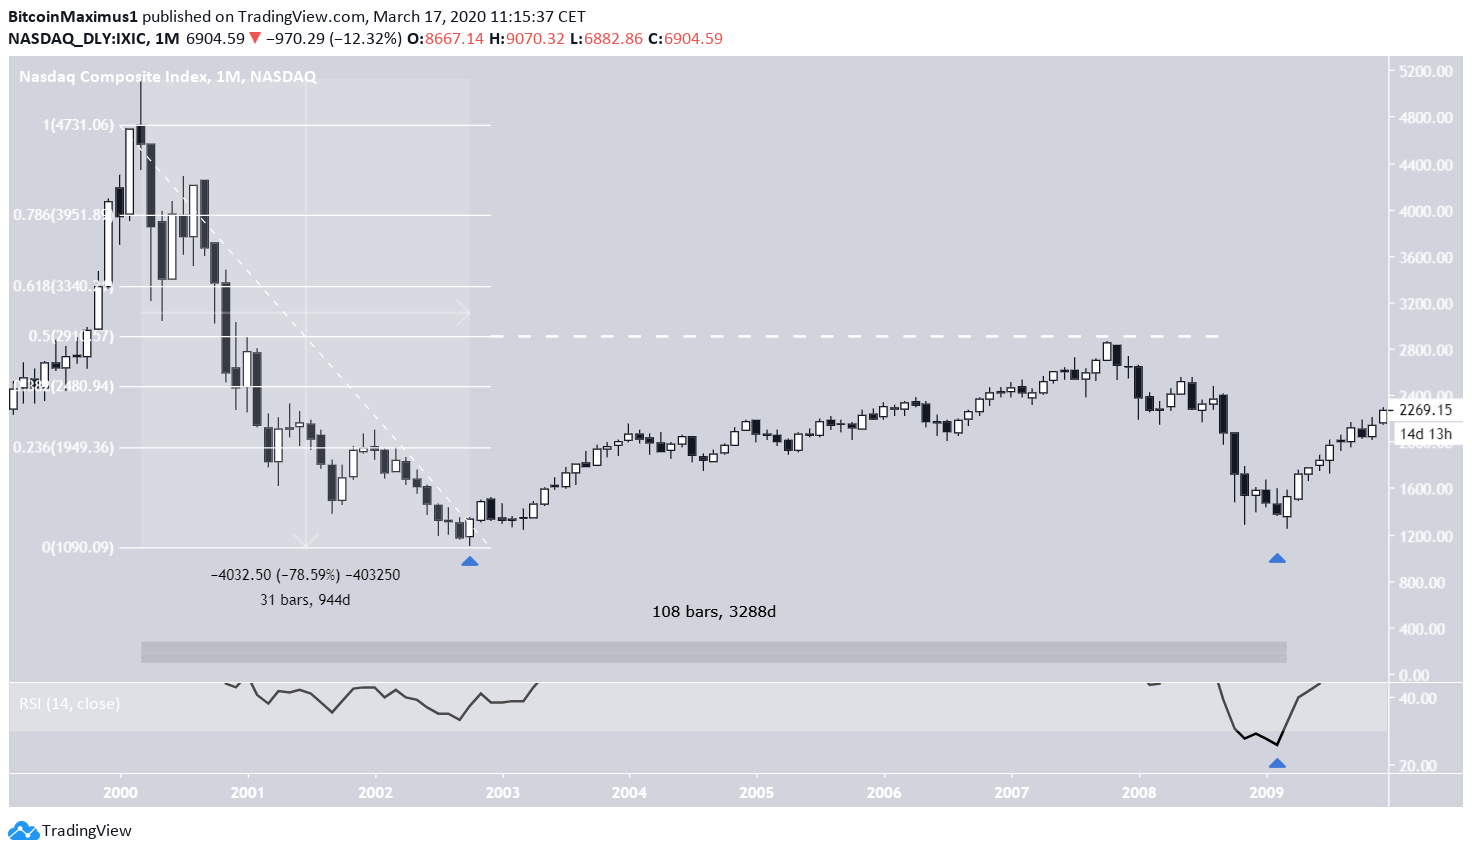
The NASDAQ index reached a high of $5132 in March 2000. What ensued was a 3288-day downward trend. During the first phase, the price decreased by 78.59 percent, culminating with a low of $1108 reached in October 2002.
Afterward, the price began an upward move that reached the 0.5 Fib level of the entire previous decrease. The final low was reached in March 2009 at $1265 and the price has been increasing since — currently being at $6904.
An interesting observation is that the lowest monthly RSI ever recorded was in March 2009, even though the price was higher than the low in October 2002.
The tweet assumes that the March 2009 low is the one coming after the disbelief phase.
Bitcoin
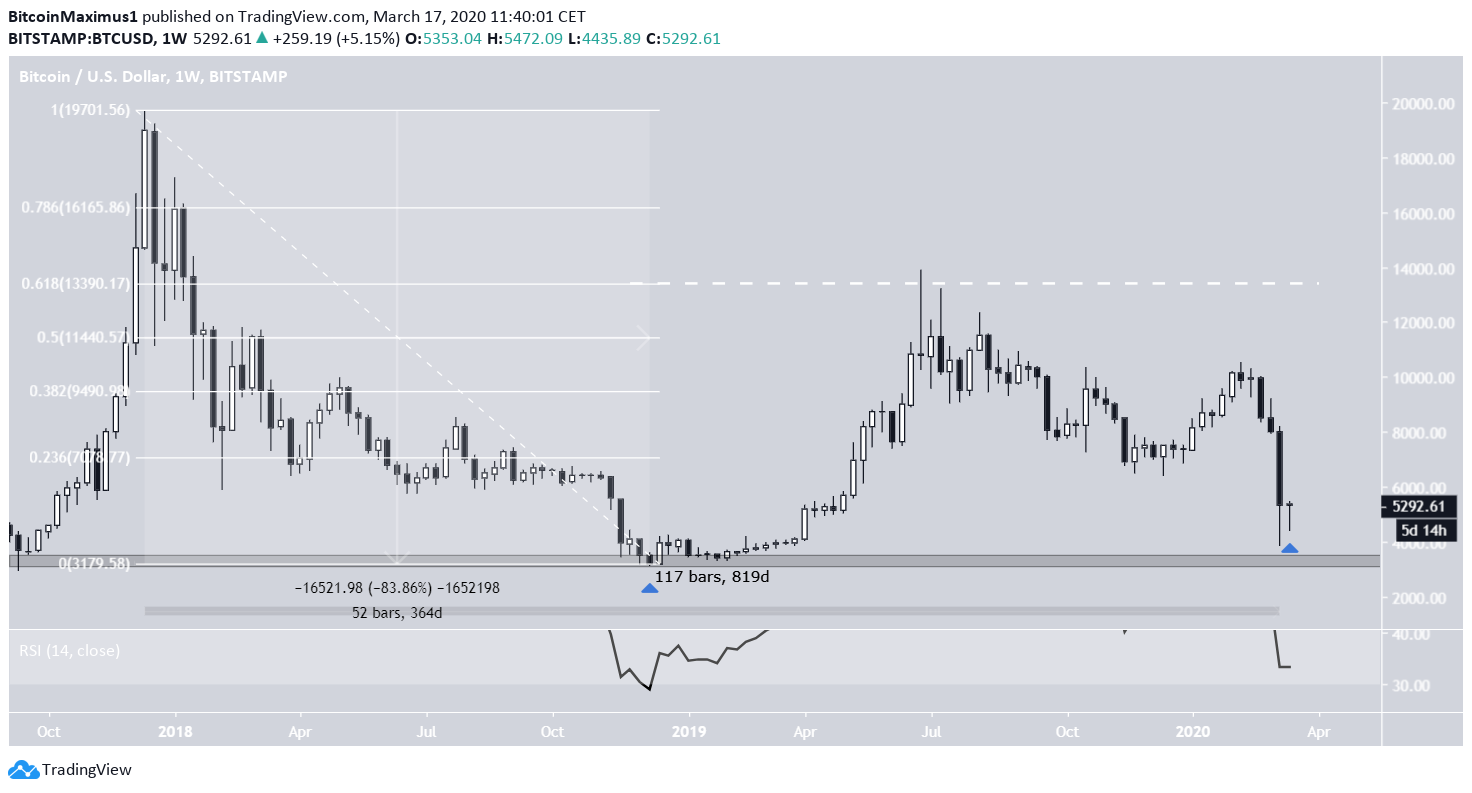
The Bitcoin price reached a high of $19,666 in December 2017. It proceeded to decrease for 364 days until December 2018, when it reached a low of $3122. This was a decrease of 83.86 percent and is very similar to that of NASDAQ.
Afterward, the price rallied and increased all the way to the 0.618 Fib level of the previous decrease. The next low is the current one, being reached near $4000 in March 2020.
Unlike NASDAQ, while the weekly RSI is oversold, it is not the lowest ever recorded. It is slightly higher than that reached in December 2018.
In order for this low to be the “disbelief” one, it has to be a higher low in relation to that reached in December 2018. A price close below $3200 would invalidate this possibility.
Conclusion
To conclude, the current Bitcoin price movement and that of NASDAQ after the year 2000 share numerous similarities — more specifically, the rate of decrease since the first all-time high and the ensuing retracement. If the fractal is not invalidated, this could be the final low prior to a long upward trend.
A price breakdown below the December 2017 low of $3200 would invalidate this possibility.
