Bitcoin (BTC) Price Highlights
- The price has bounced on its 200-week moving average (MA).
- BTC has decreased by 43% measuring from its local high.
- The prior accumulation phase lasted for 126 days.
Will the BTC price ever reach $10,000 again? If yes, when will it do so? Continue reading below if you are interested in finding out.It might be a while before we see 5 digits again for $BTC.
— Nik Patel (@cointradernik) March 12, 2020
Wouldn't be surprised to see 3-4 months of accumulation down here sub-capitulation, similar to the original bottom.
If liquidity gets pumped into the system, that might speed up the process. pic.twitter.com/vZlBMNmhec
Accumulation Phase
The previous accumulation phase occurred in December 2018 and lasted for 126 days. Assuming that the current accumulation phase lasts for the same amount of time, it will be completed on July 20, 2020. An interesting observation is the fact that the drop prior to that accumulation phase and the current drop have an almost identical rate of decrease of 43%. Furthermore, both of them touched the 200-week moving average (MA) prior to moving upward. If the fractal continues to hold, the BTC price will trade around this range next week before making a slightly lower low and initiating the accumulation period.
Comparing The Movements
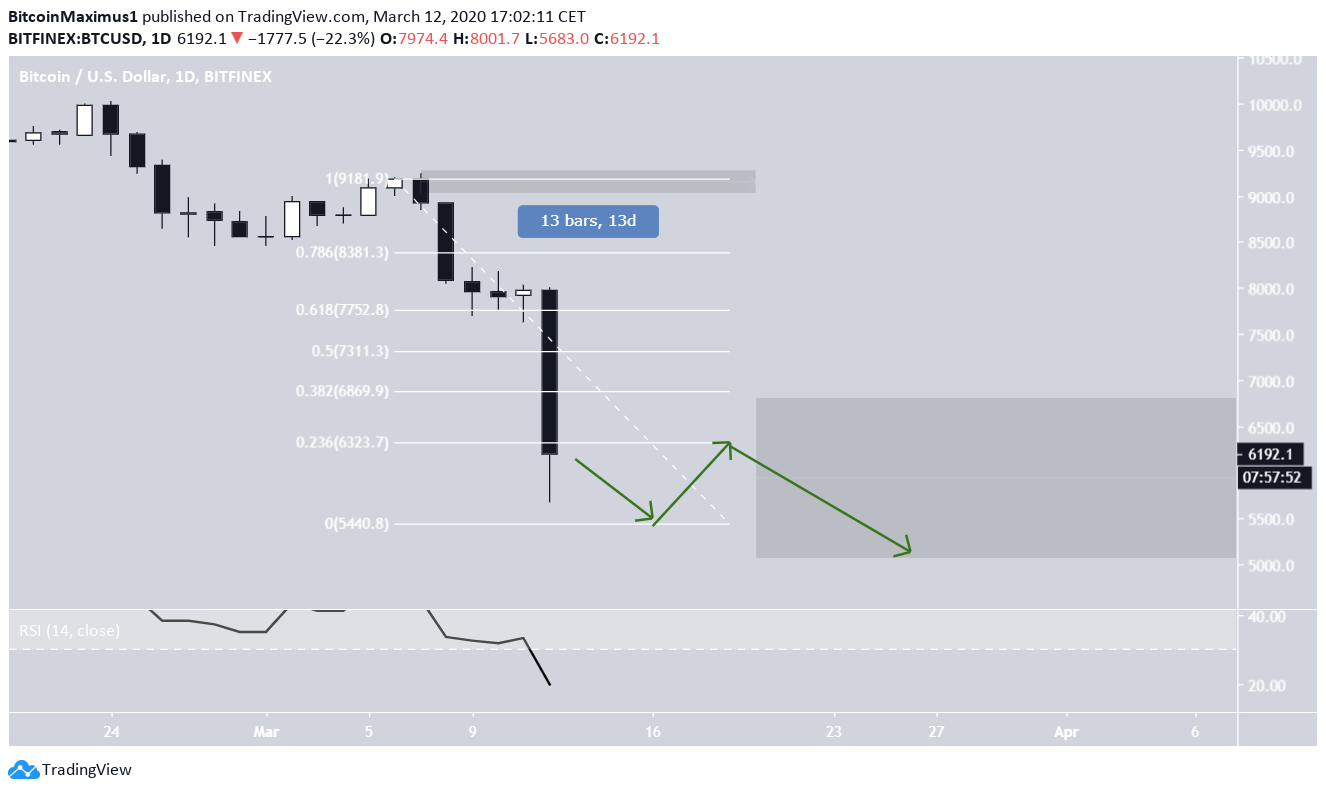
In the 2018 movement, the decrease lasted for a total of 13 days. The price initially bounced all the way to the 0.236 Fib level before making a slightly lower low inside the accumulation phase. The current decrease has been sharper, currently being on its sixth day. If it lasts for the same amount of time, it will continue until March 19.
A possible outline of this movement would be a decrease to touch the 200-week MA at $5,500 before a slight bounce to the 0.236 Fib level at $6,200. This would be succeeded by a lower low that would begin the accumulation phase.
 To conclude, the BTC price initiated a very rapid price decrease on March 11. The move is reminiscent of the decrease of November 2018, which eventually led to the December low of $3,281. If the price continues following this fractal, it will consolidate between the $5,000-$6,000 area until July 2020 before breaking out.
Disclaimer
In line with the Trust Project guidelines, this price analysis article is for informational purposes only and should not be considered financial or investment advice. BeInCrypto is committed to accurate, unbiased reporting, but market conditions are subject to change without notice. Always conduct your own research and consult with a professional before making any financial decisions. Please note that our Terms and Conditions, Privacy Policy, and Disclaimers have been updated.

