


Compound (COMP) is trading inside a descending parallel channel and bounced at its support line yesterday.
Kava.io (KAVA) has bounced at the $4.80 horizontal area after a sharp fall.
Near Protocol (NEAR) has broken down from a parabolic ascending support line.
COMP
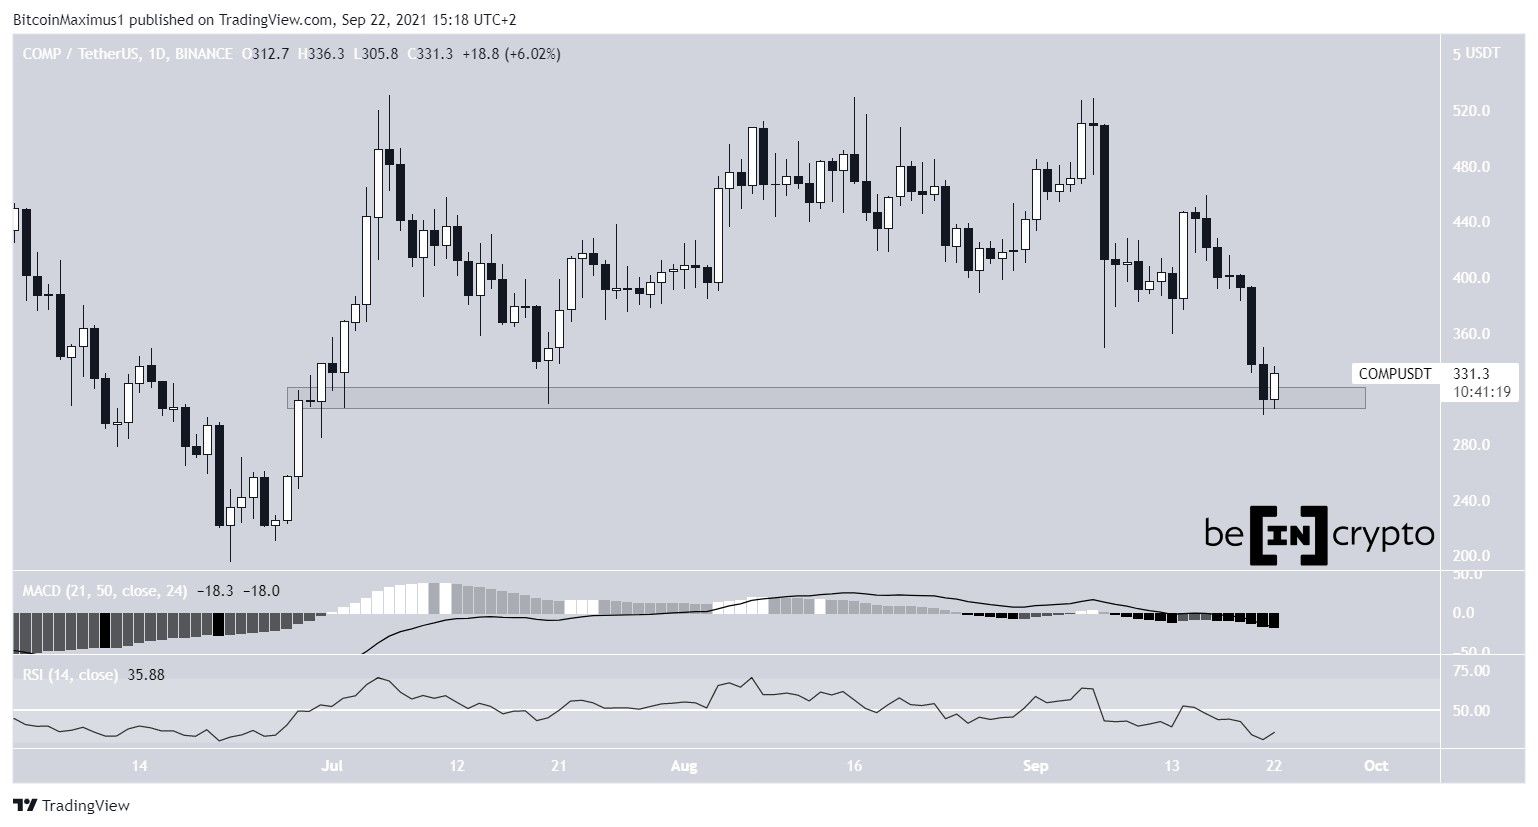
COMP has been moving upwards since June 22. Initially, the movement was quick, leading to a high of $531 on July 6.
However, the token has been moving downwards since. On Sept 21, it reached a low of $301. The ensuing bounce validated the $305 area as support.
However, despite the bounce, technical indicators are bearish. The MACD and RSI are both decreasing, the former being below 0 while the latter being below 50.
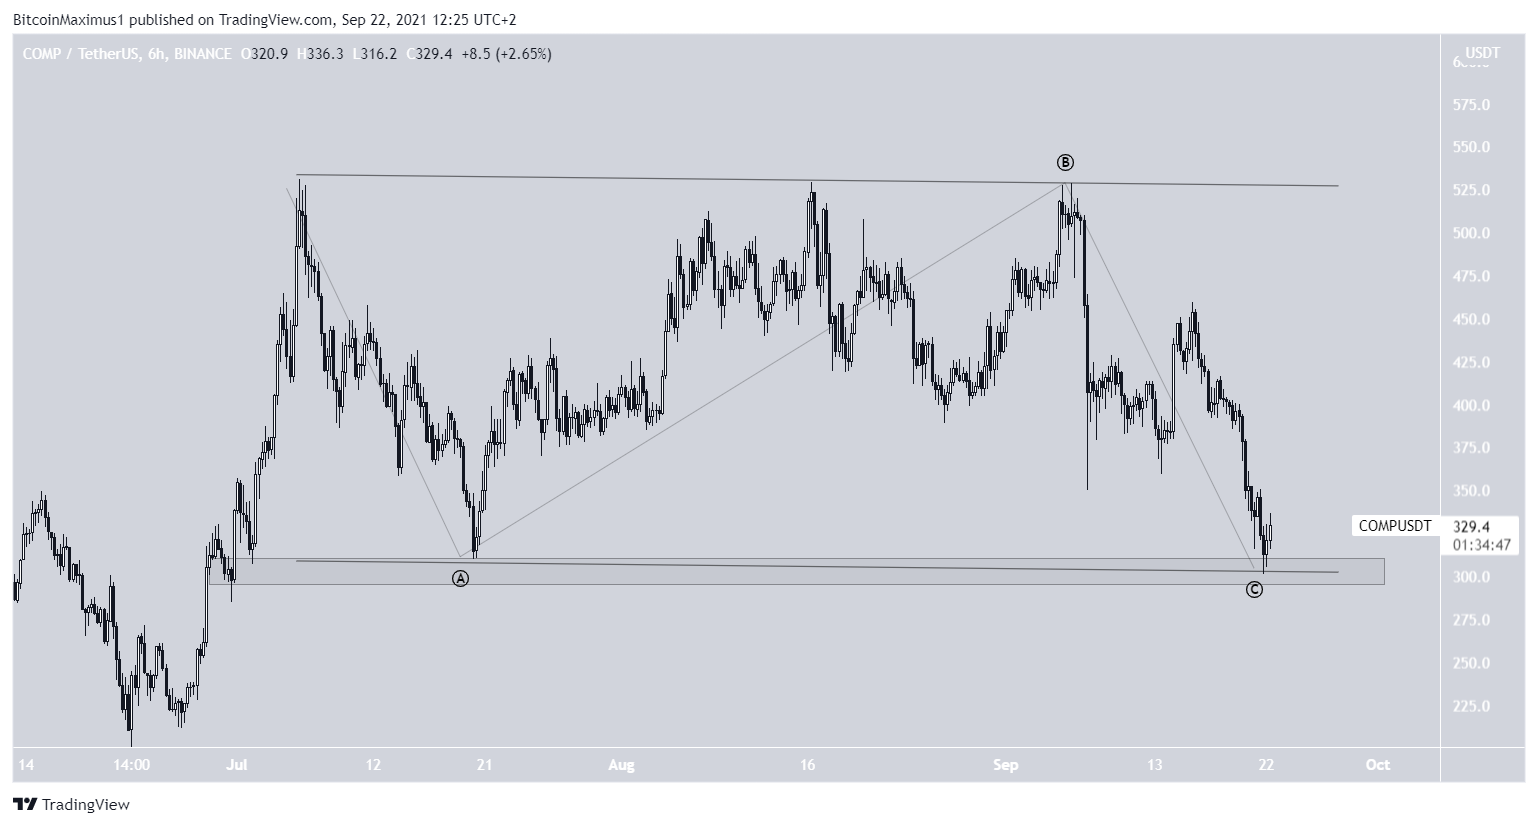
While the daily chart does not provide any bullish signs, the six-hour one does. The token seems to be trading inside a descending parallel channel, a structure that usually contains corrective movements.
Furthermore, the aforementioned Sept 21 low was made right at the support line of the channel. Additionally, it gave waves A:C a 1:1 ratio.
If COMP manages to reclaim the middle of the channel, it would likely mean that the decrease was corrective and a breakout will eventually follow.
Highlights
- COMP is trading inside a descending parallel channel.
- There is support at $315.
KAVA
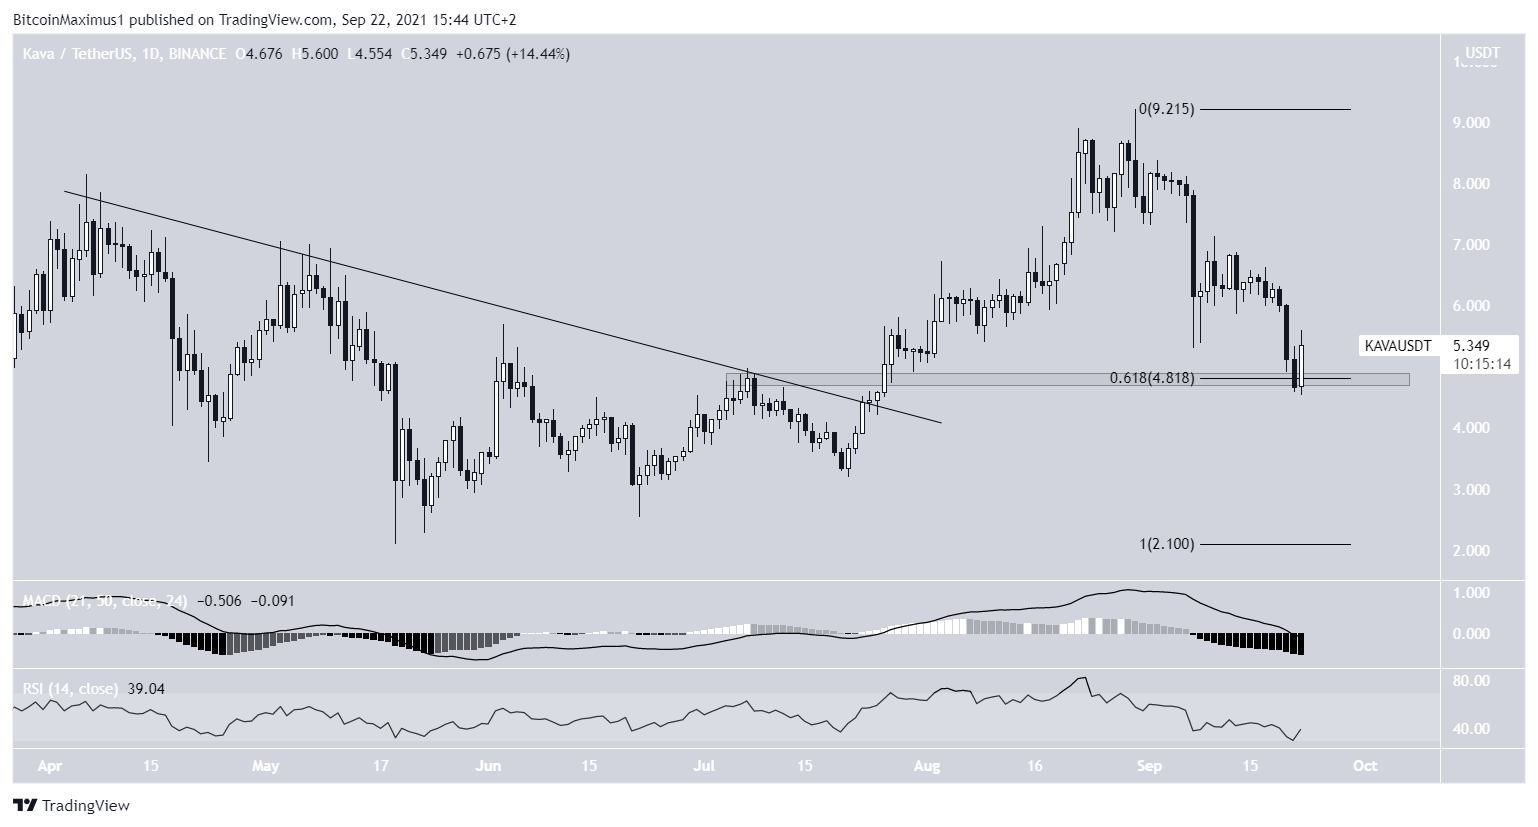
On July 24, KAVA broke out and proceeded to reach a new all-time high price of $9.21 on Aug 30. However, it failed to sustain the higher prices and has been moving downwards since.
So far, it has reached a low of $4.55, doing so on Sept 22. The ensuing bounce helped validate the $4.80 area as support. This is both a horizontal support area and the 0.618 Fib retracement support level.
Currently, KAVA is in the process of creating a bullish engulfing candlestick.
However, technical indicators are still bearish. The MACD and RSI are both decreasing. The MACD is already into negative territory while the RSI is below 50.
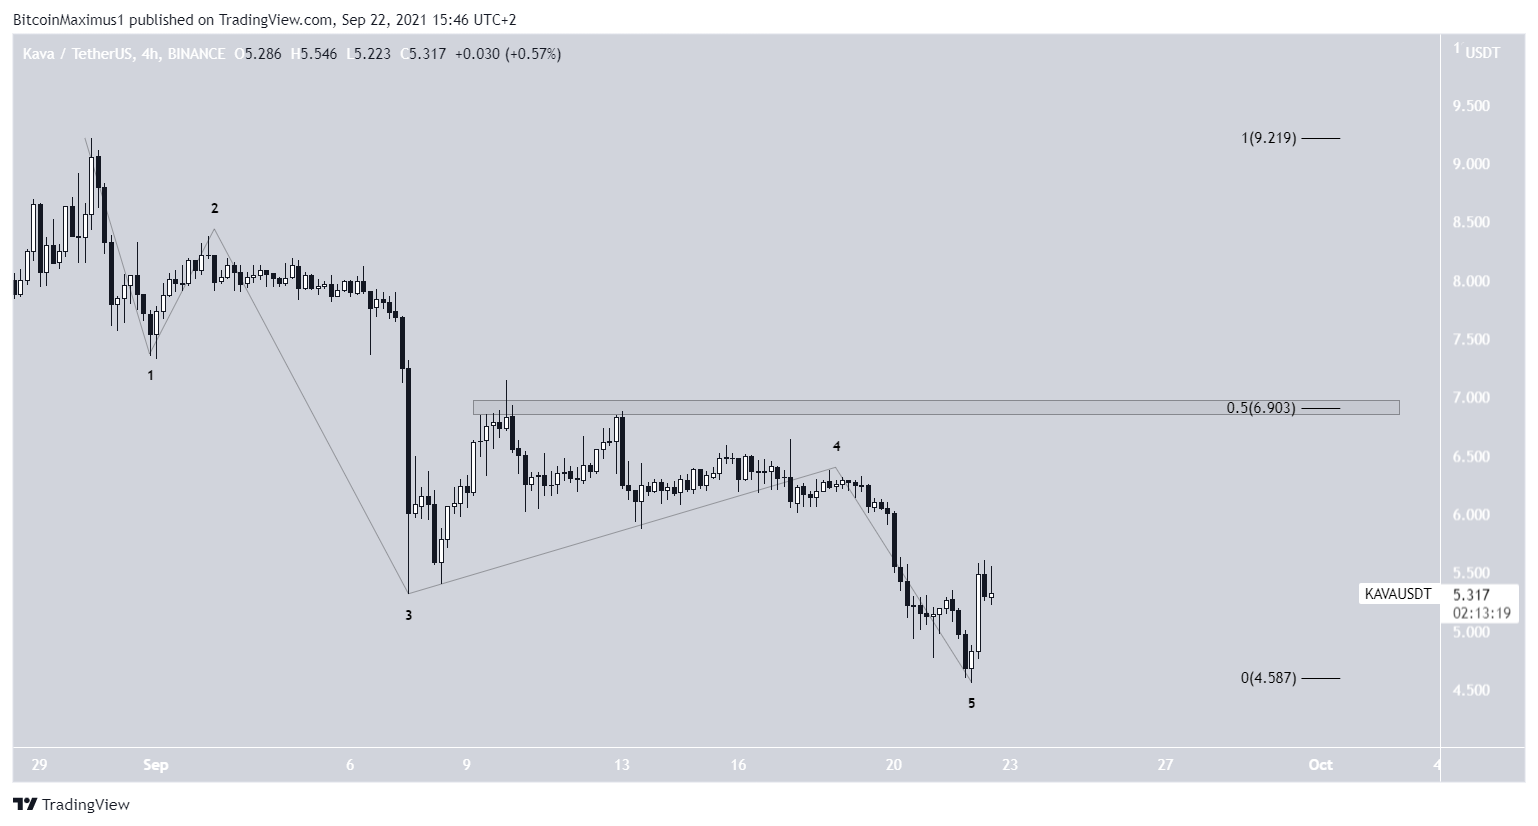
A look at the shorter-term six-hour chart shows that the decrease was a five wave bearish impulse. This fits with the idea that the short/medium-term trend is bearish.
However, since the impulse is now complete, a significant bounce is likely.
The first resistance area is at $6.90, the 0.5 Fib retracement resistance level and a horizontal resistance area.
Highlights
- KAVA has broken out from a descending resistance line.
- There is support at $4.80.
NEAR
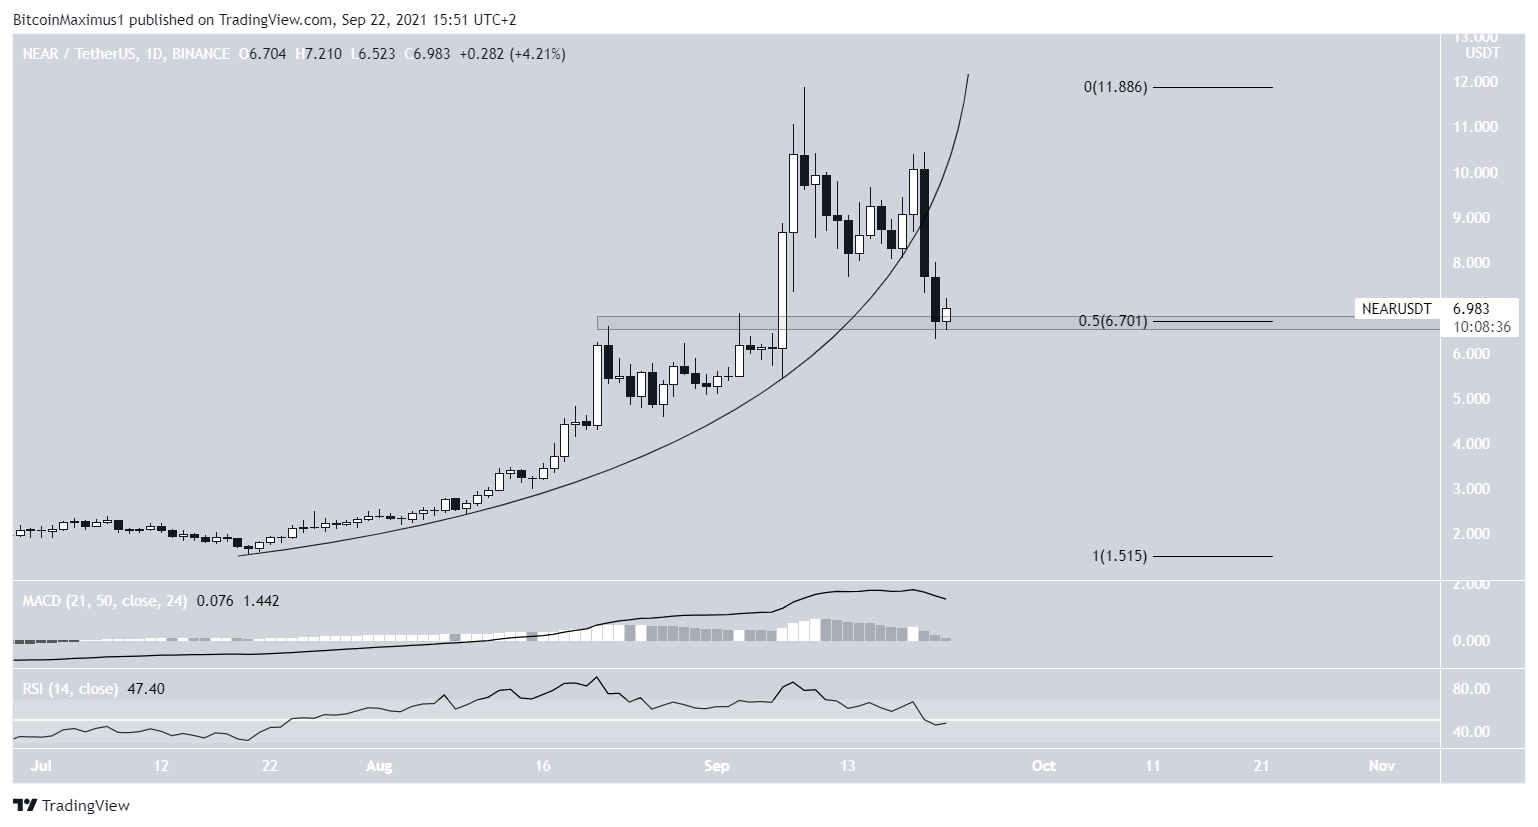
NEAR had been increasing alongside a parabolic ascending support line since July 20. This led to a new all-time high price of $11.88 on Sept 9.
However, the token has been falling since.
It broke down from the parabolic support line on Sept 20 and reached a low of $6.33 the next day. The ensuing bounce validated the $6.70 area as support. This is both a horizontal support area and the 0.5 Fib retracement support level.
Even though NEAR has bounced, technical indicators provide mixed readings. Both the MACD and RSI are falling, but the former is still positive, and the latter is right at the 50 line.
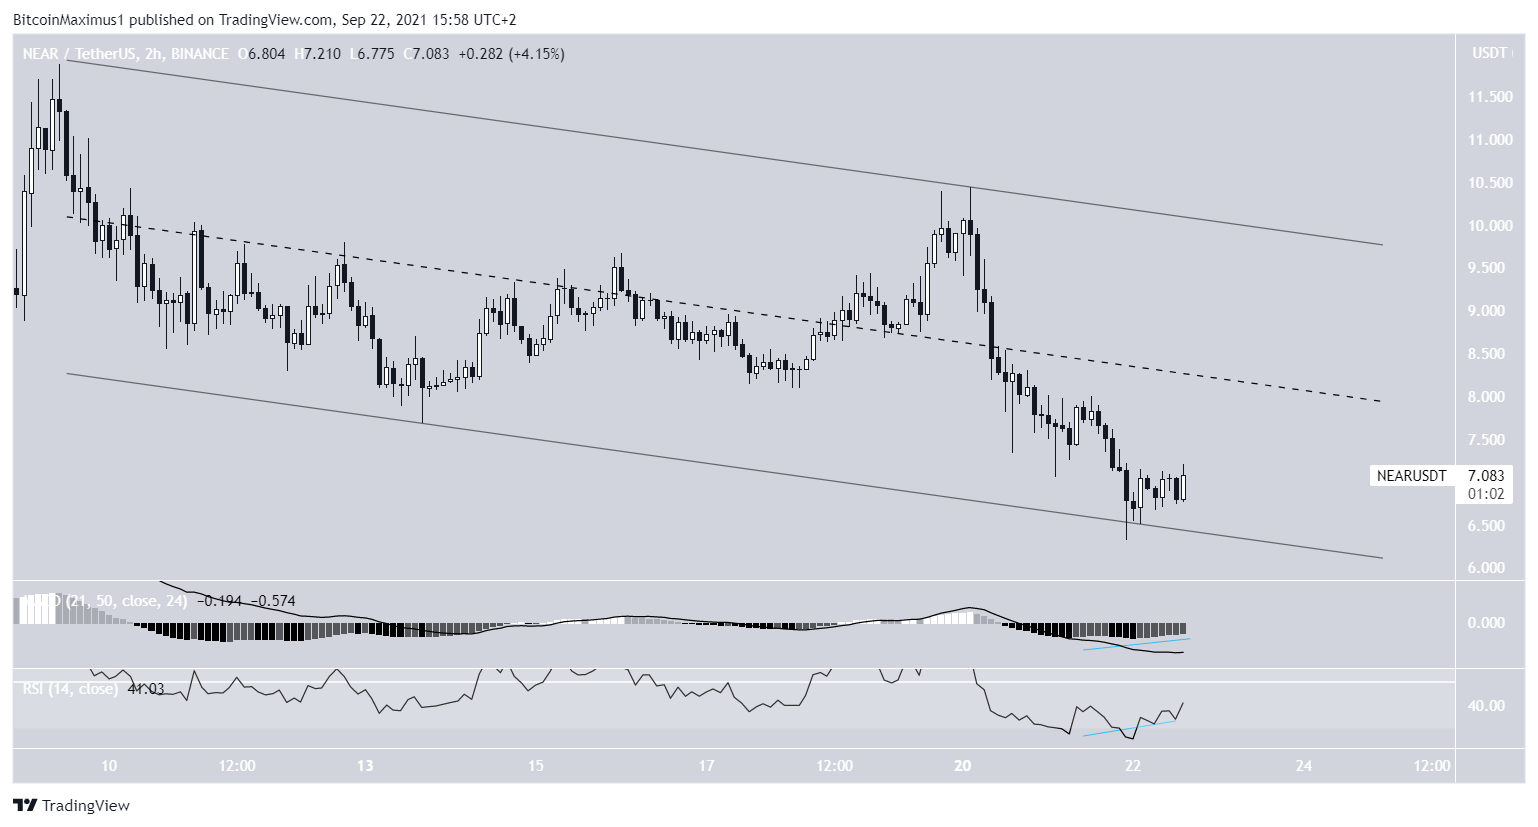
However, the shorter-term two-hour chart is more bullish.
Similarly to COMP, NEAR is trading inside a descending parallel channel. On Sept 21, it bounced at its support line. Furthermore, both the RSI and MACD have generated bullish divergences.
If the token manages to reclaim the middle of the channel, it would increase the chances of a breakout transpiring.
Highlights
- NEAR has broken down from a parabolic ascending support line.
- There is support at $6.70.
For BeInCrypto’s latest Bitcoin (BTC) analysis, click here.
What do you think about this subject? Write to us and tell us!


