


Both Compound (COMP) and Near (NEAR) have been decreasing since reaching their all-time highs at the beginning of February.
However, they have bounced at their respective support areas and created long lower wicks, a sign of buying pressure.
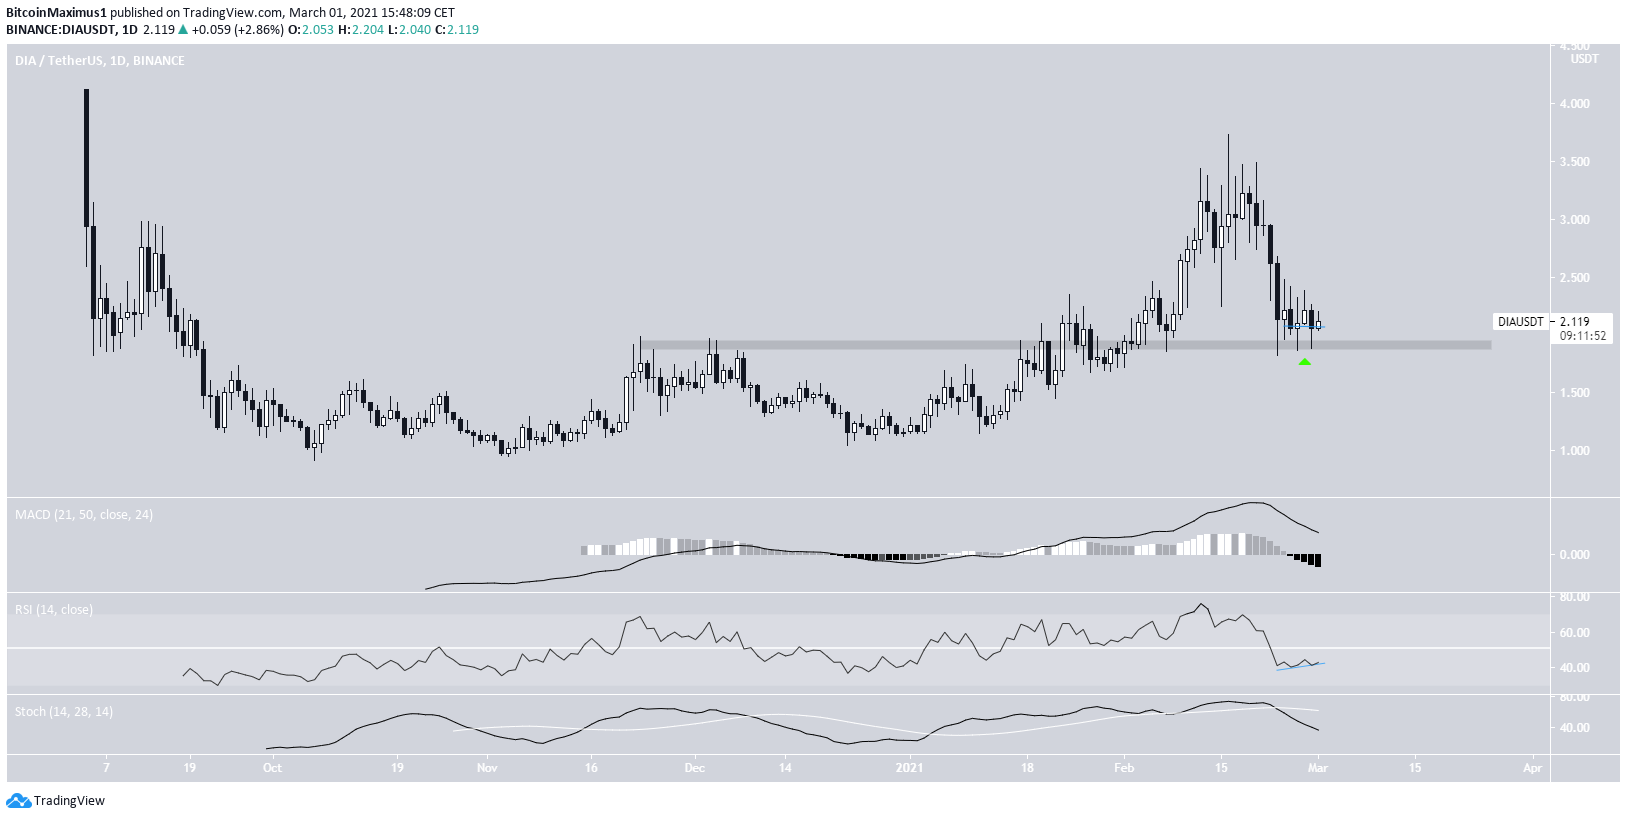
DIA (DIA) is trading above support but has failed to show any bullish reversal signs.
Compound (COMP)
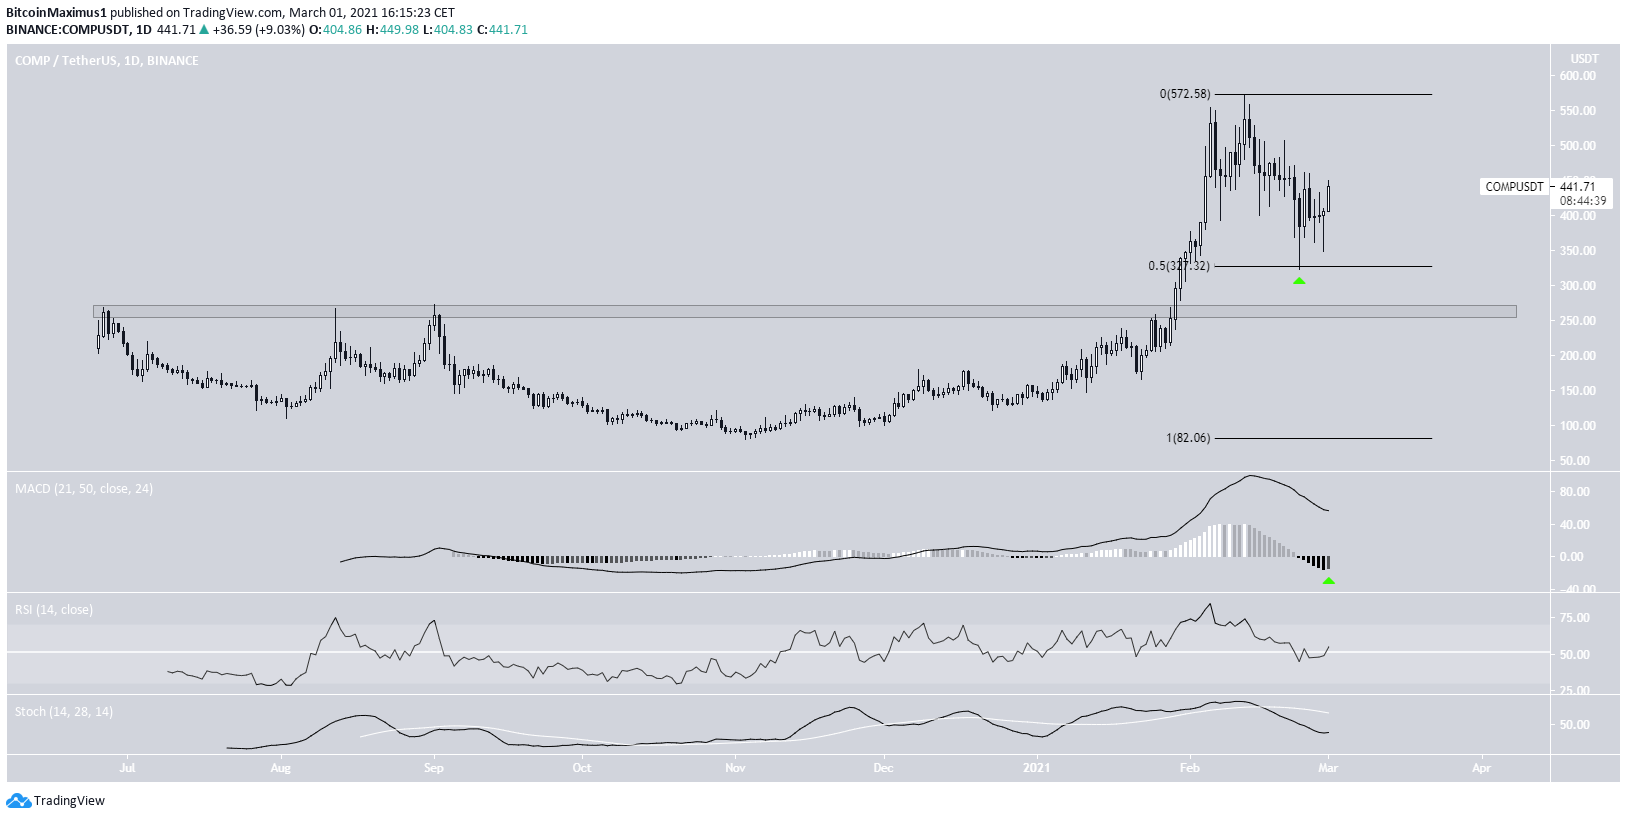
COMP has been moving downwards since reaching an all-time high price of $572.58. The decrease continued until COMP reached a low of $323, right at the 0.5 Fib retracement level of the most recent upward movement, creating a long lower wick and bouncing considerably.
Technical indicators are neutral, leaning on bullish, since the MACD and Stochastic oscillator are gradually picking up and the RSI has crossed above 50. This suggests that COMP is close to reversing its short-term bearish trend.
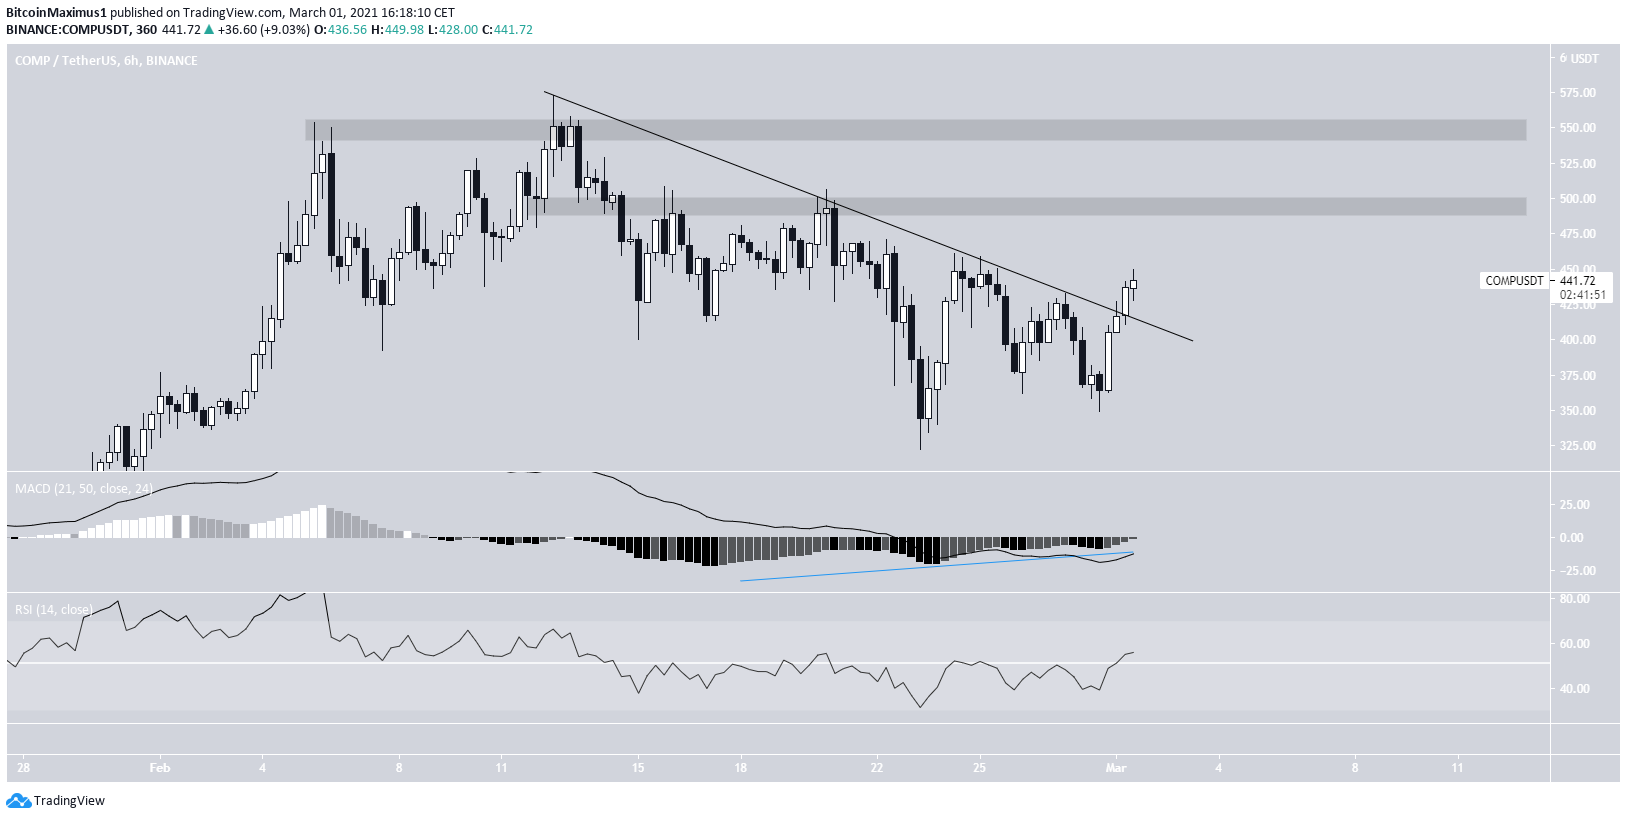
The shorter-term six-hour chart is more bullish, since it shows a breakout from a descending resistance line, which suggests COMP is heading higher.
Furthermore, both the RSI and MACD are bullish, indicating that COMP is expected to continue increasing.
While there is minor resistance at $495, COMP is expected to reach the main resistance area at $550.
Highlights
- COMP has bounced at the 0.5 Fib retracement level.
- It has broken out from a short-term descending resistance line.
Near (NEAR)
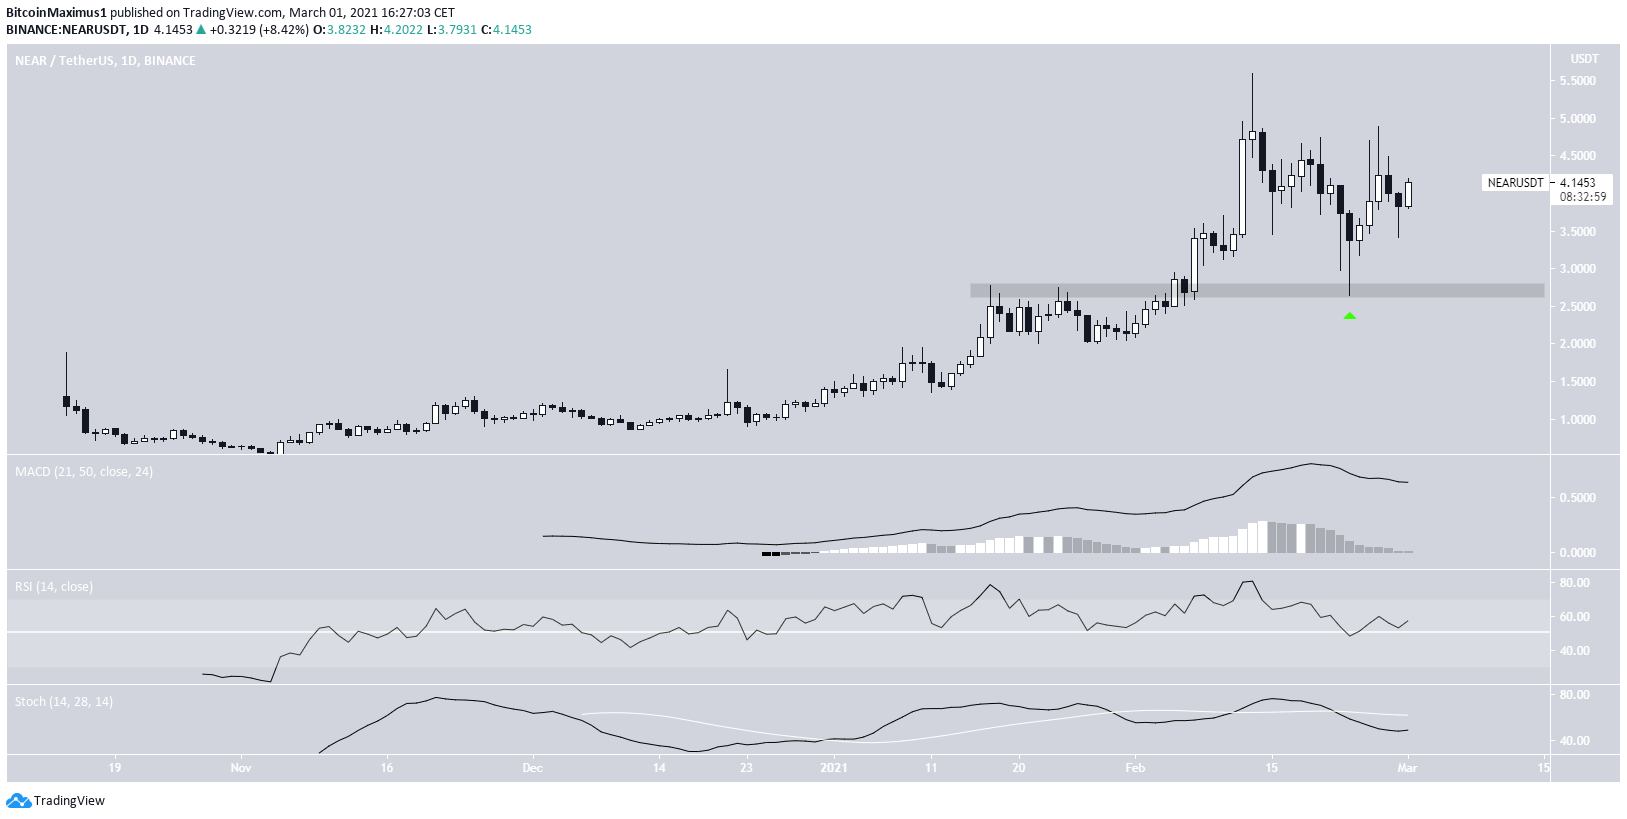
NEAR has been decreasing since reaching an all-time high price of $5.59 on Feb. 13. The decrease continued until NEAR reached a low of $2.64 on Feb. 23.
The drop ended at the previous resistance area at $2.60, validating it as support and creating a long lower wick, a sign of buying pressure.
Technical indicators are neutral/bullish, suggesting that the price is likely to go higher. A bullish cross in the Stochastic oscillator would confirm this.
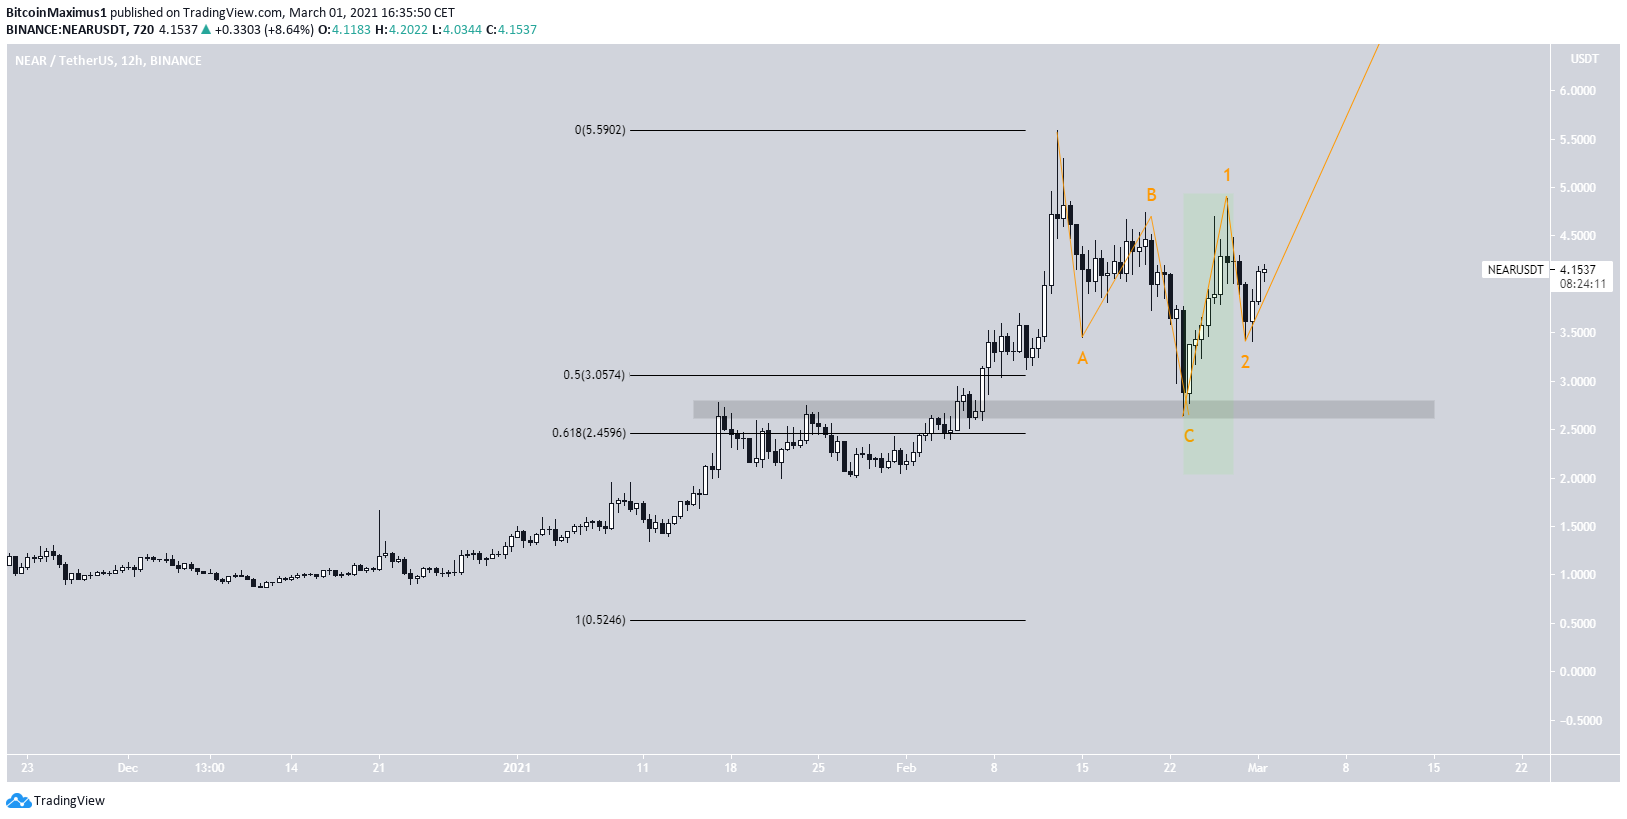
The wave count suggests a completed A-B-C corrective structure (orange), which ended between the 0.5- 0.618 Fib retracement levels when measuring from the entire upward movement.
The ensuing portion of the increase looks impulsive (outlined in green), so it is possible that NEAR has begun a new bullish impulse that will take it well into price discovery.
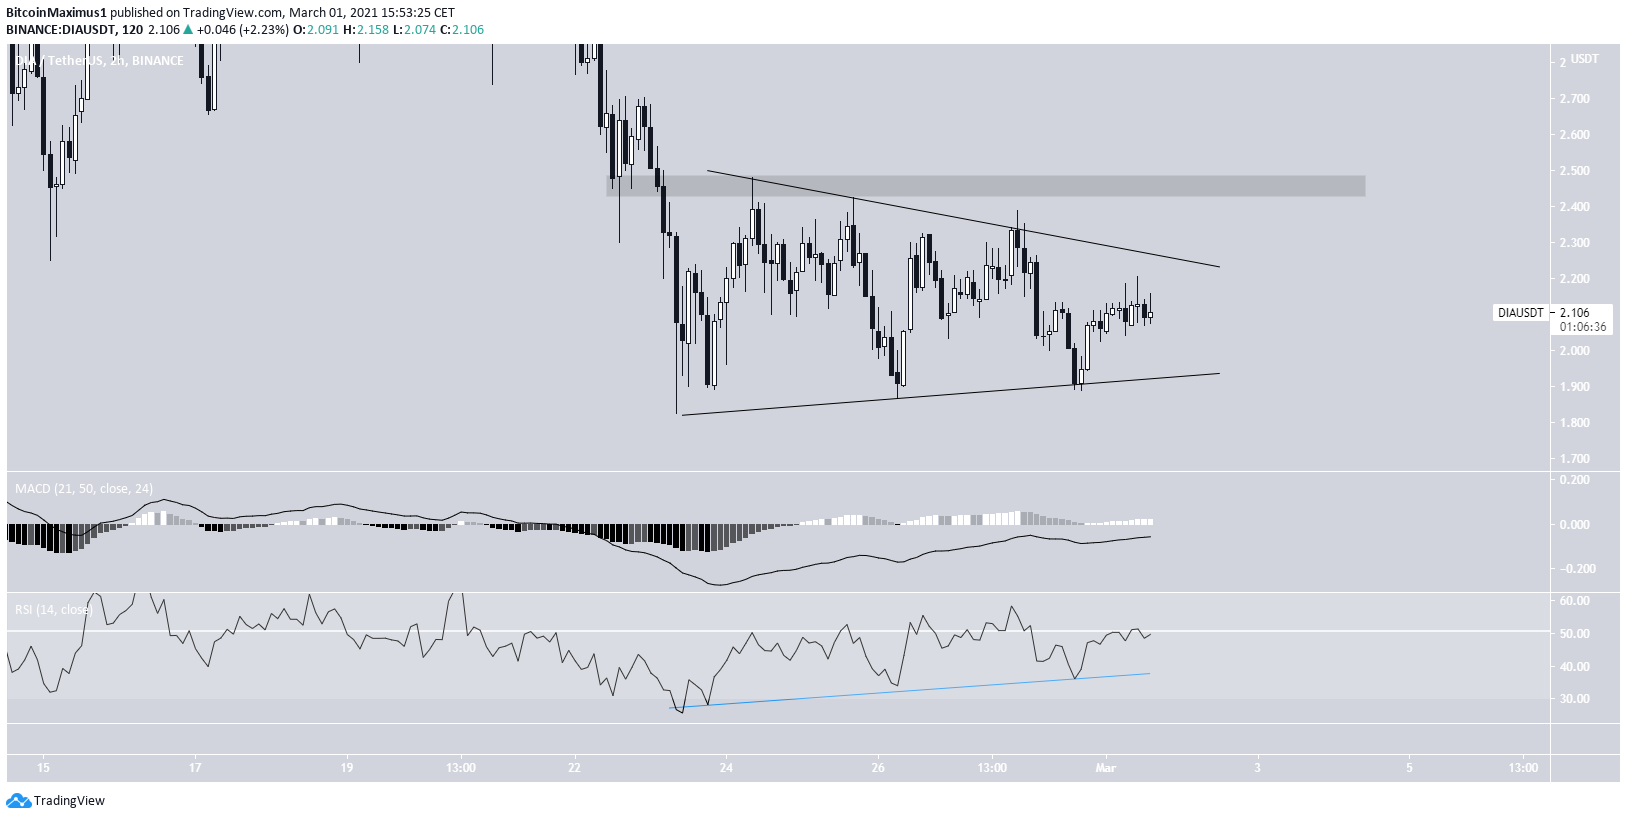
DIA (DIA)
DIA has been decreasing since reaching a high of $3.73 on Feb. 16. The decrease has taken it to the $1.90 level, which previously acted as resistance but has since turned to support.
Technical indicators are mixed, since the MACD and Stochastic oscillator are bearish but the RSI has generated bearish divergence.
Therefore, while some type of bounce would be expected, considering the price is at a strong support area and the RSI has generated bullish divergence, we cannot yet determine the direction of the longer-term trend.
The shorter-term two-hour chart shows that DIA is trading inside a symmetrical triangle.
While this is a neutral pattern, it is transpiring after a downward movement, so a breakdown would be expected. Furthermore, it is possible that DIA is in a bearish impulse and this is a 4th wave triangle, supporting the possibility of a breakdown.
However, there is bullish divergence in the RSI, continuing the trend of mixed signals from the daily chart.
Highlights
- DIA is trading above support at $1.90.
- It is trading inside a symmetrical triangle.
For BeInCrypto’s latest Bitcoin (BTC) analysis, click here.


