


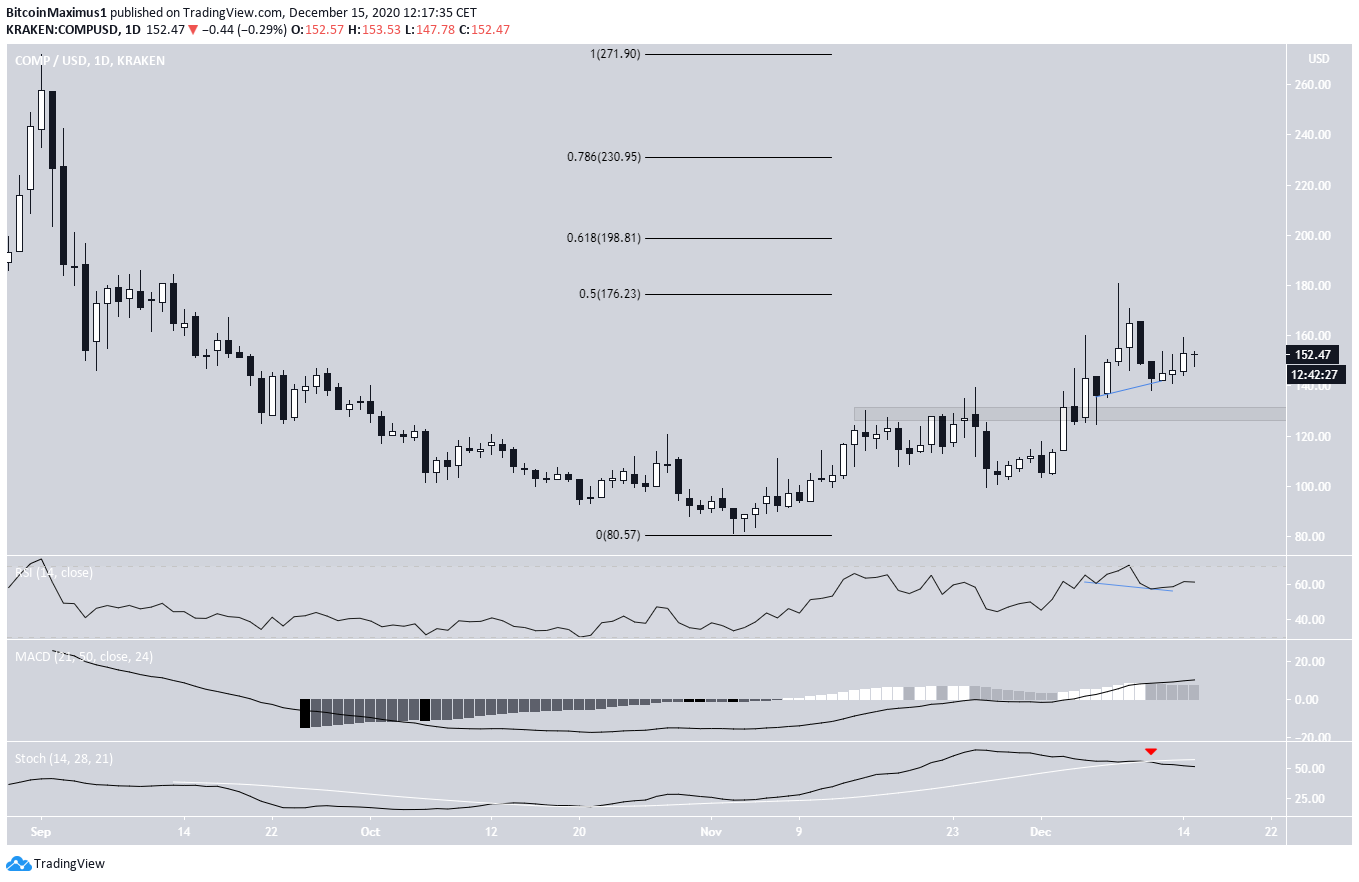
The Compound (COMP) price has been falling since the 0.5 Fib retracement level rejected it on Dec. 8. However, it seems to have halted its decline and should continue moving upwards towards the targets given in the article.
Breakout Leads to Rejection
The COMP price has been increasing since it reached an all-time low of $80.62 on Nov. 3. On Dec. 5, COMP broke out above the previous resistance at $130, validated it as support, and has been moving upwards since. However, COMP was rejected by the 0.5 Fib retracement level at $176.
Technical indicators are neutral, leaning bullish. While the Stochastic Oscillator has made a bearish cross, the MACD and the RSI are increasing, the latter having also generated significant hidden bullish divergence.
If COMP breaks out, the next closest resistance areas would be at $200 and $230, the 0.618 and 0.786 Fib retracement levels, respectively.
Ascending Support Line
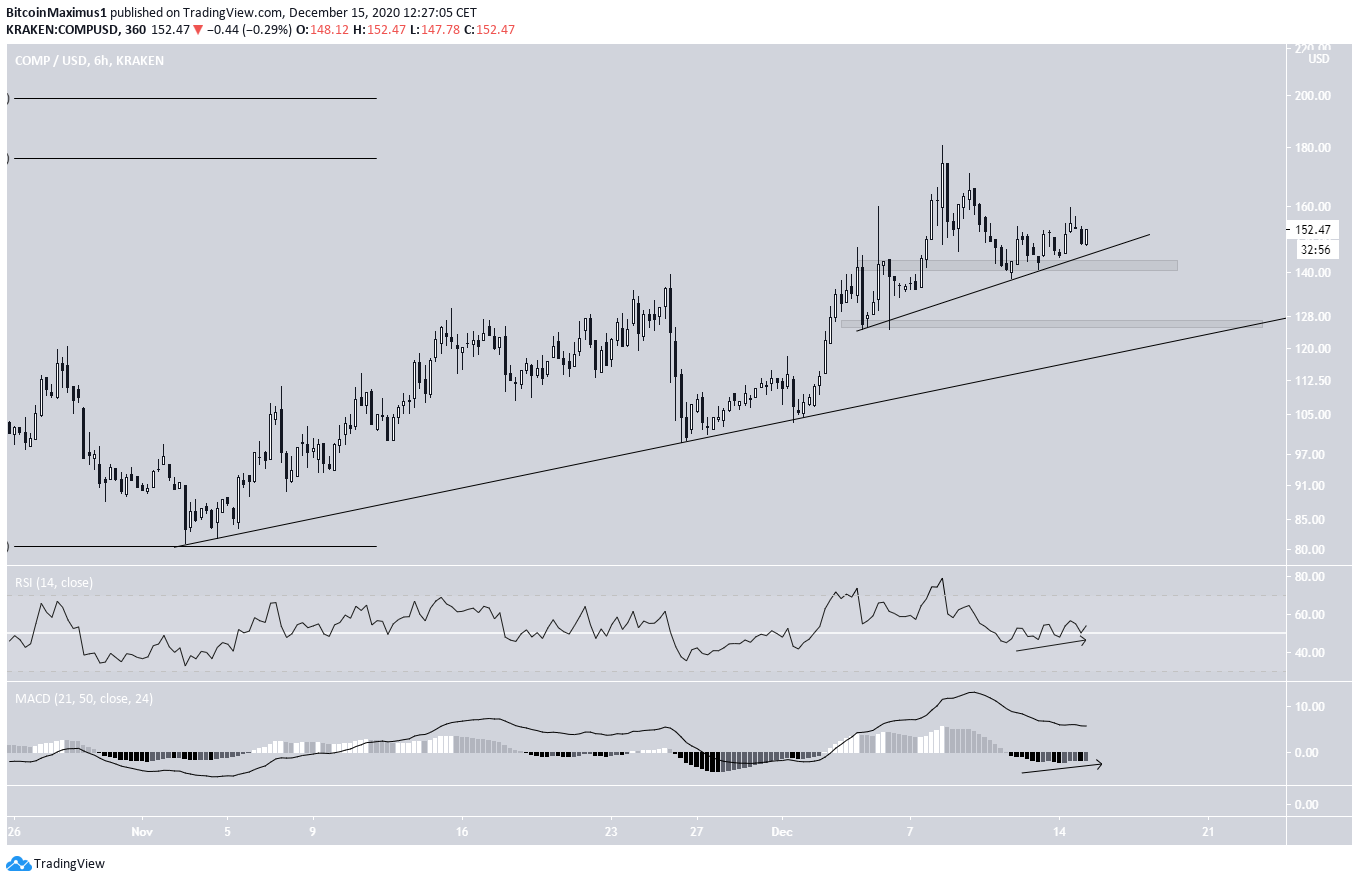
The six-hour chart shows that COMP is following two ascending support lines, the first, a long-term one in place since the previous low on Nov. 3. The second is a shorter-term one in place since Dec. 6.
At the time of writing, COMP was trading above the shorter-term line and the minor support at $140, an area which has just been reclaimed.
If COMP were to break down below this line and $140, the next closest support area would be $128, coinciding with the longer-term ascending support line.
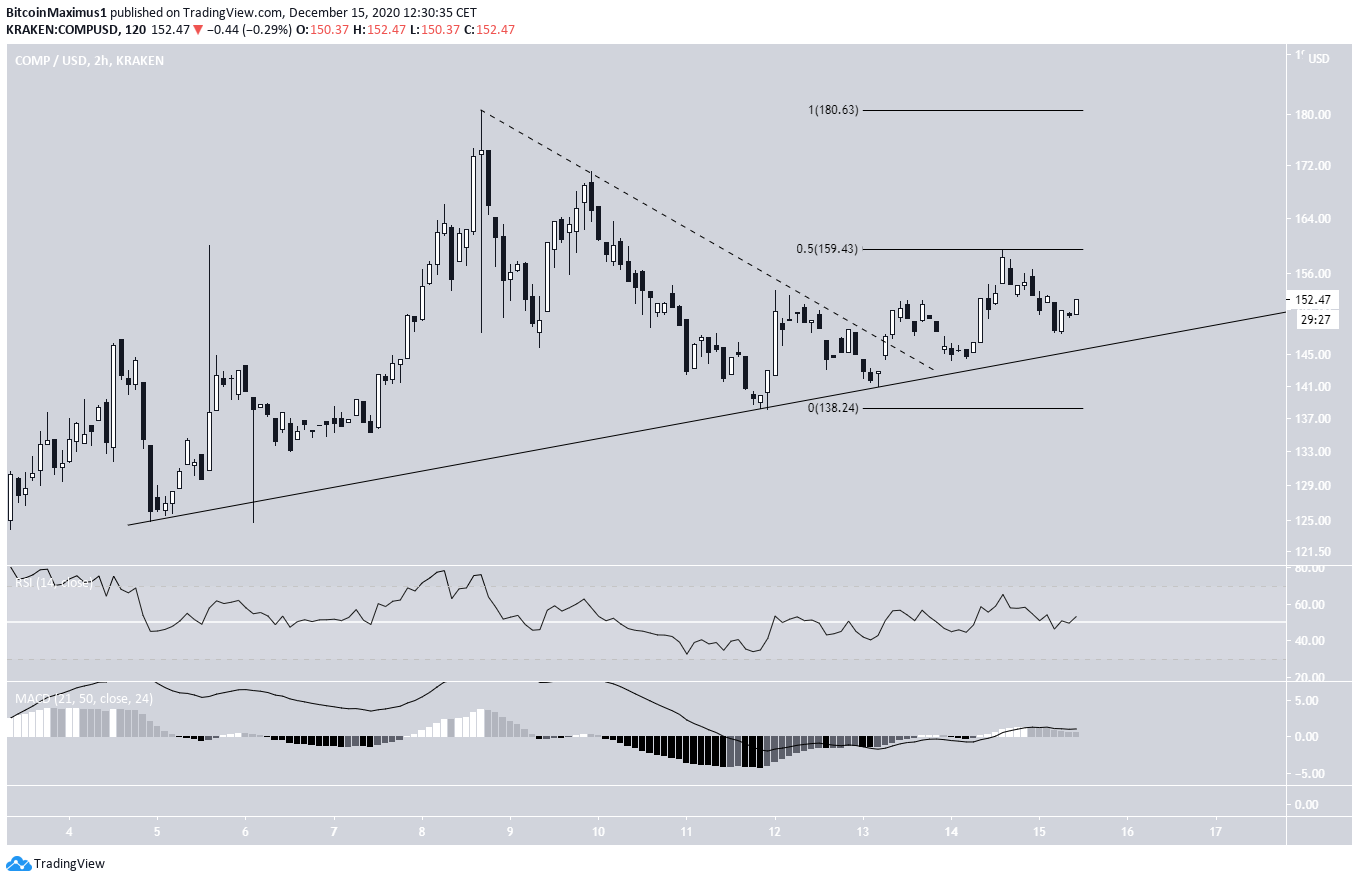
The shorter-term two-hour chart shows a breakout from a descending resistance line (dashed) in addition to the support levels previously outlined.
Once COMP successfully breaks out above $159, the 0.5 Fib retracement of the previous decline, it’s likely to continue moving upwards at an accelerated rate.
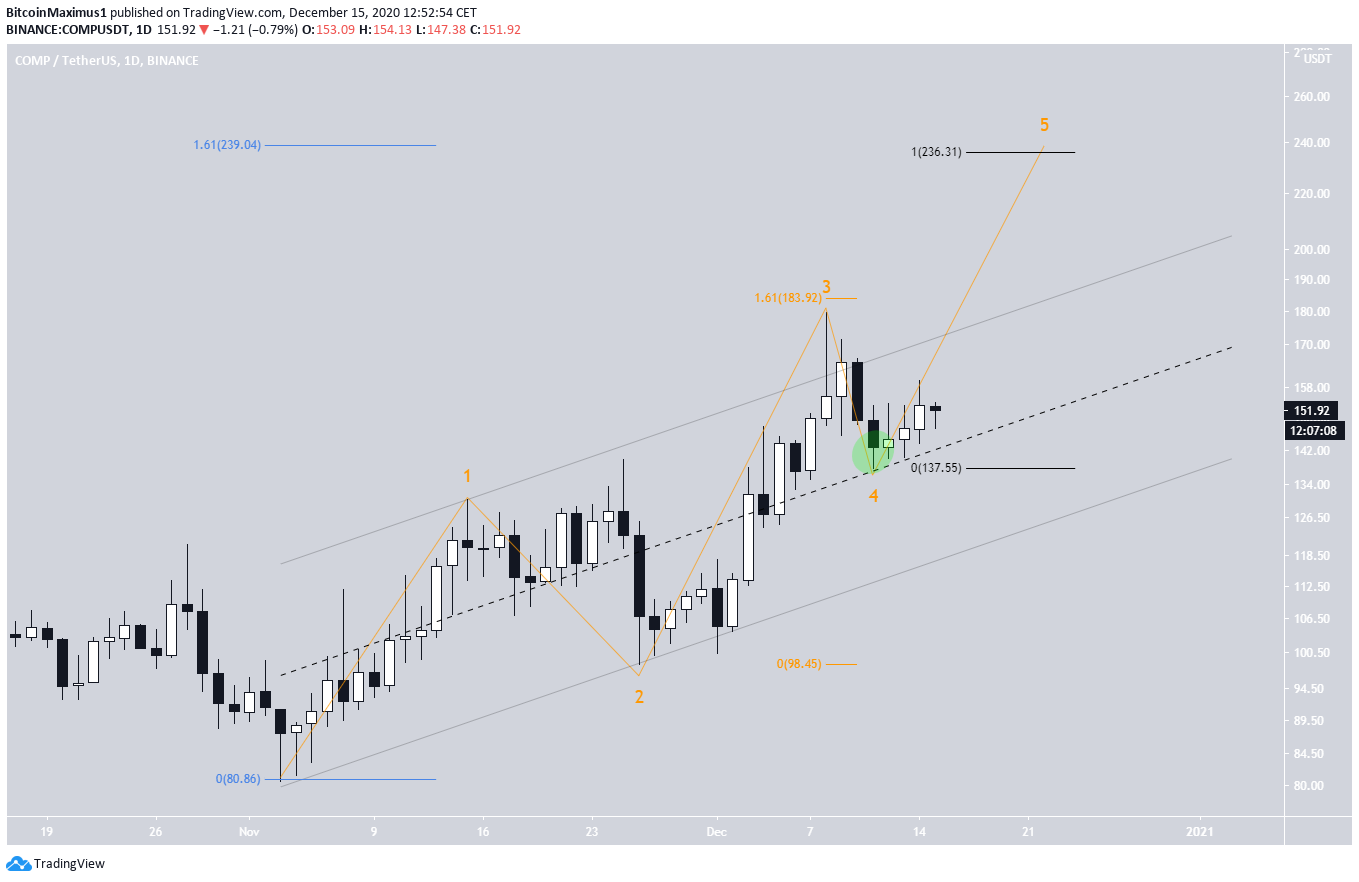
Wave Count
Cryptocurrency trader @CryptoTony_ outlined a COMP chart, stating that the price has one more corrective rally before it eventually falls.
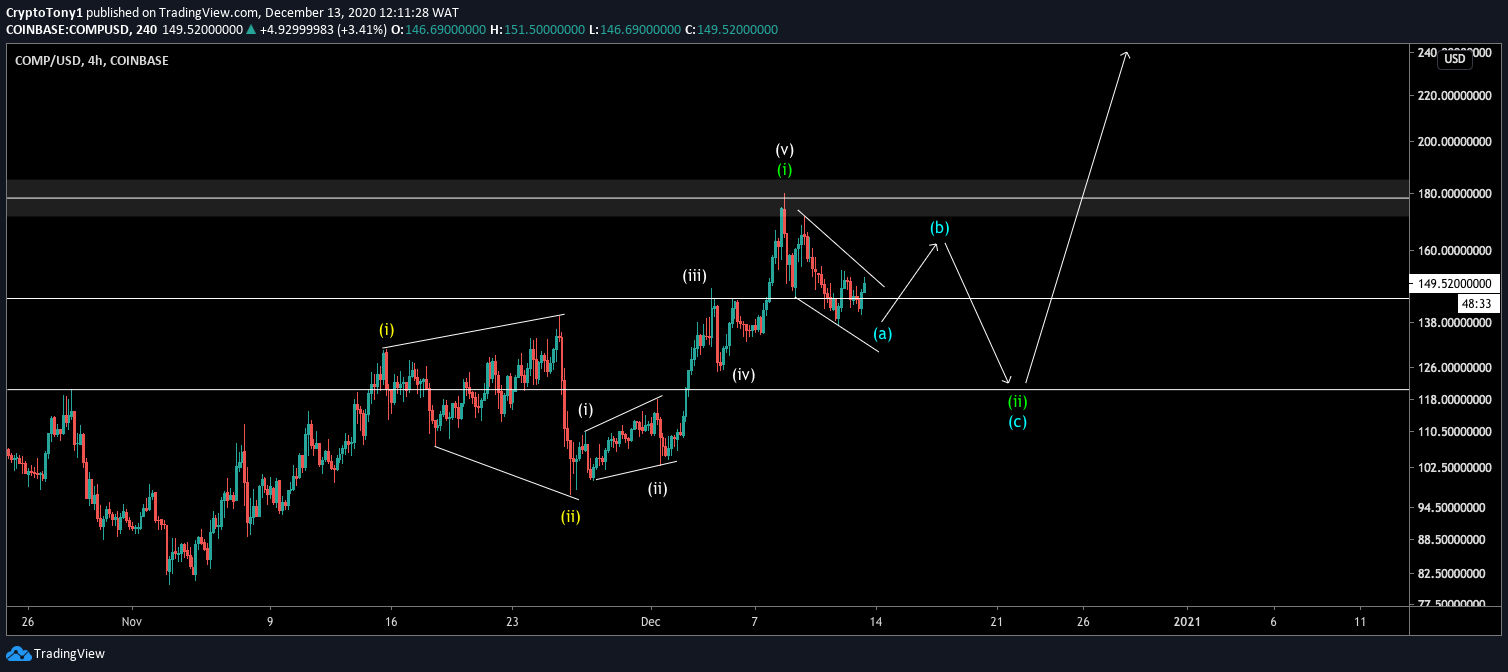
However, since the decline has yet to reach wave 1 territory, it feels too early to call this a 1-2/1-2 wave formation. A more likely option seems to be that COMP has already completed wave 4, and is currently in wave 5.
There are two reasons why we think it’s more likely that COMP is now in wave 5:
- Wave 4 ended right at the middle of a parallel channel connecting waves 1 and 2, in what is possibly a 4th wave pullback.
- Wave 3 was almost exactly 1.61 times the length of wave 1 (orange Fib), a common ratio in bullish impulses.
The most likely target for the top of wave 5 is between $236 and $239, the 1.61 Fib extension of waves 1 – 3 (blue) and the length of waves 1 – 3 projected to the bottom of wave 4 (black).
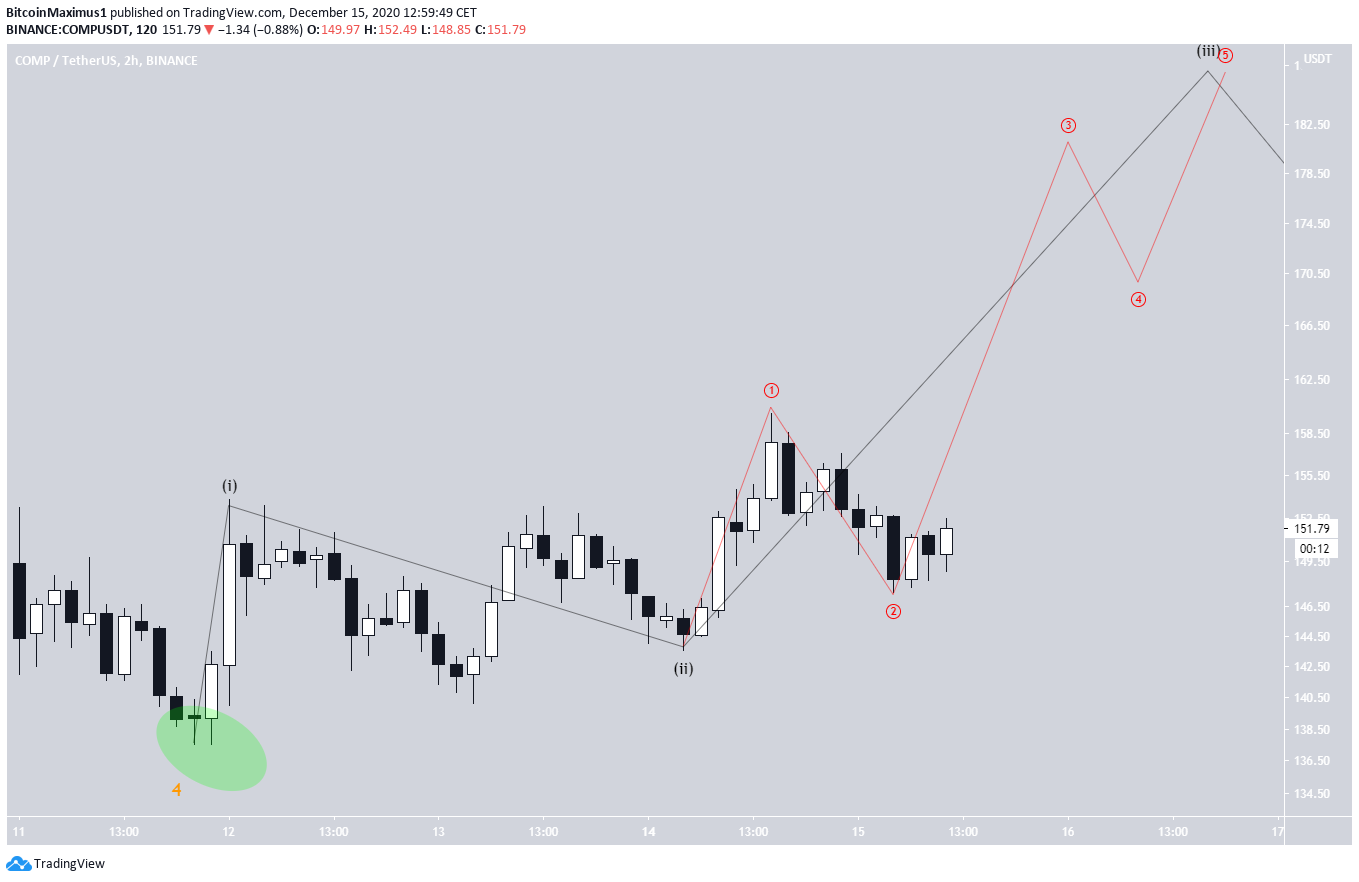
A closer look at the movement since wave 4 terminated shows a possible short-term 1-2/1-2 structure, which would suggest that COMP will soon begin an extended upward movement.
A decline below the sub-wave 2 low at $143.54 would invalidate this particular wave count.
In that case, the scenario proposed in the tweet would likely take place. COMP would decline towards $128, the long-term ascending support line and a minor support area.
Conclusion
To conclude, the COMP price is likely to continue moving upwards and eventually break out above $200. A fall below $143.54 would invalidate this possibility.
For BeInCrypto’s latest Bitcoin (BTC) analysis, click here!
Disclaimer: Cryptocurrency trading carries a high level of risk and may not be suitable for all investors. The views expressed in this article do not reflect those of BeInCrypto


