


On July 23, 2019, the Chainlink (LINK) price reached a low of 22,581 satoshis. A gradual upward move ensued and LINK reached a high of 24,505 satoshis the next day. It has been decreasing since.
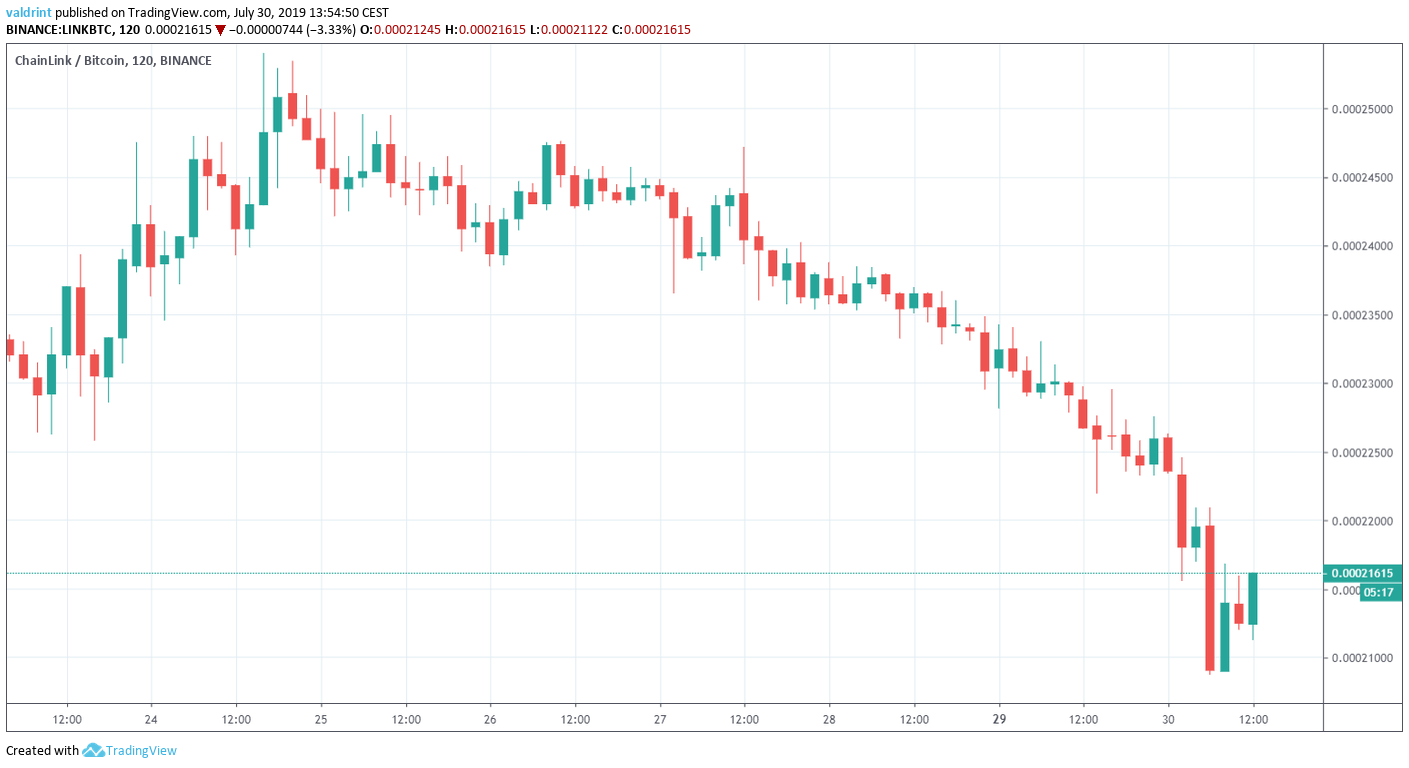
At the time of writing, it was trading near 21,500 satoshis.
How long will the LINK price continue to decrease? Keep reading below in order to find out.
For our previous analysis, click here.
If you are interested in trading cryptocurrencies with a multiplier of up to 100x on our new partner exchange with the lowest fees, follow this link to get a free StormGain account!
Chainlink Price: Trends and Highlights for July 30
- LINK/BTC recently broke down from a descending triangle.
- It is following an ascending support line.
- Daily moving averages have made a bearish cross.
- There is resistance near 23,000 satoshis.
Previous Movement
In our previous analysis, we stated that:
we believe that the LINK price will soon break down from the triangle.
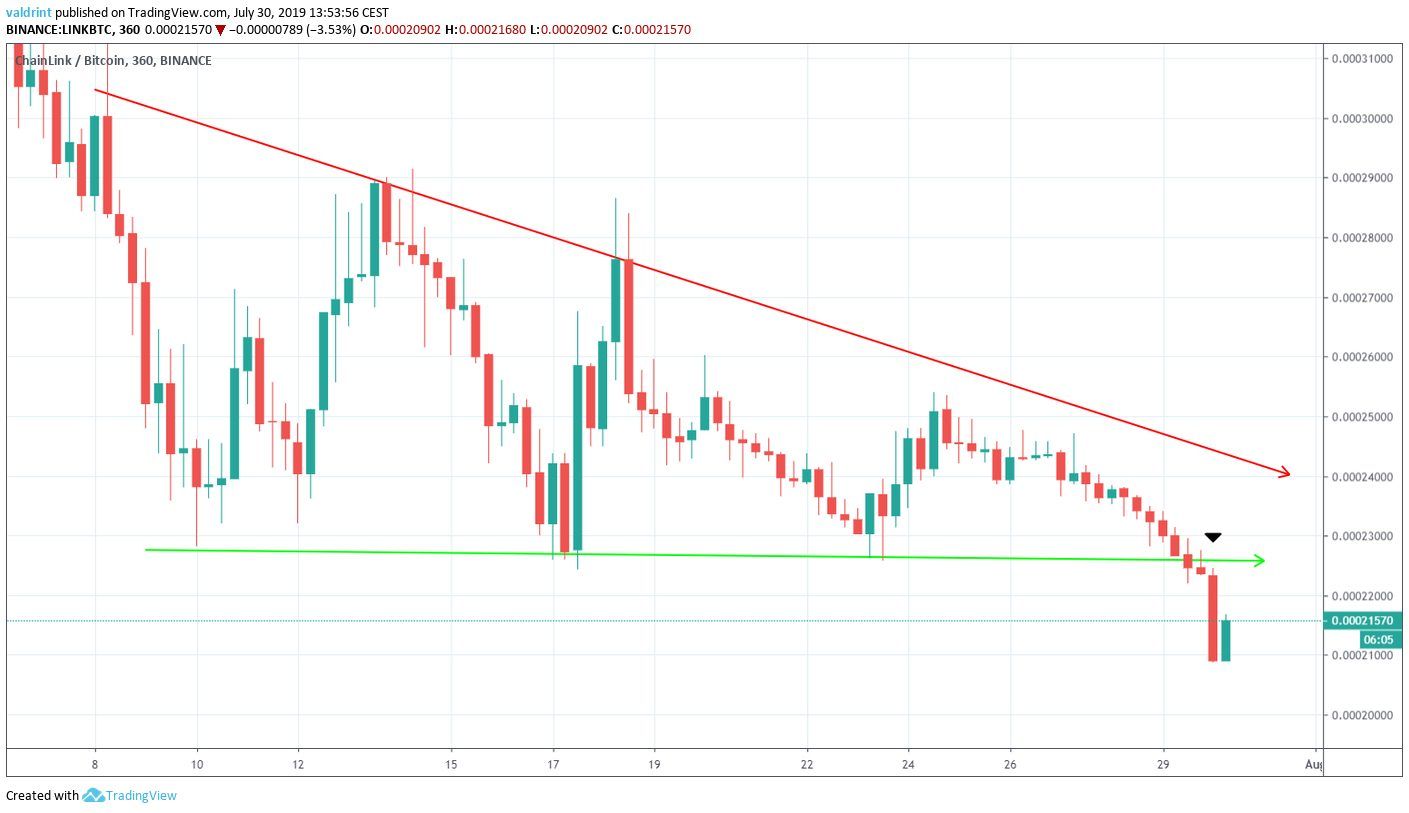
On July 29, the LINK price did so.
It reached lows of 20,900 satoshis before beginning to retrace.
Where will it go next?
Ascending Support Line
Looking at a longer-term time-frame, we can see that LINK has been following an ascending support line since reaching lows close to 8000 satoshis on May 13.
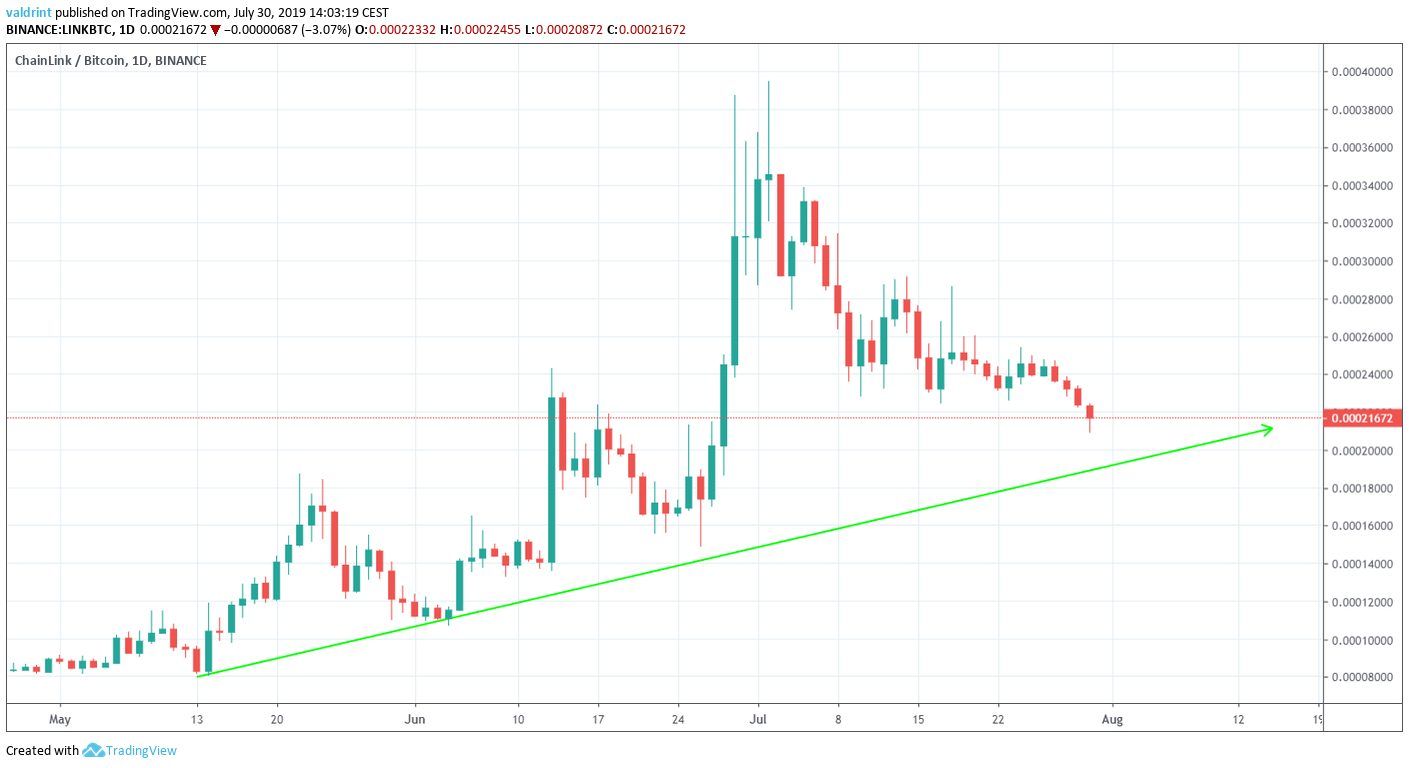
The increase intensified on June 26, and the price reached highs of close to 40,000 satoshis.
However, the recent breakdown has caused the Chainlink price to come closer to the support line.
At the time of writing, the line was slightly below 20,000 satoshis.
A look at the daily moving averages (MA) suggests that the price is likely to reach it.
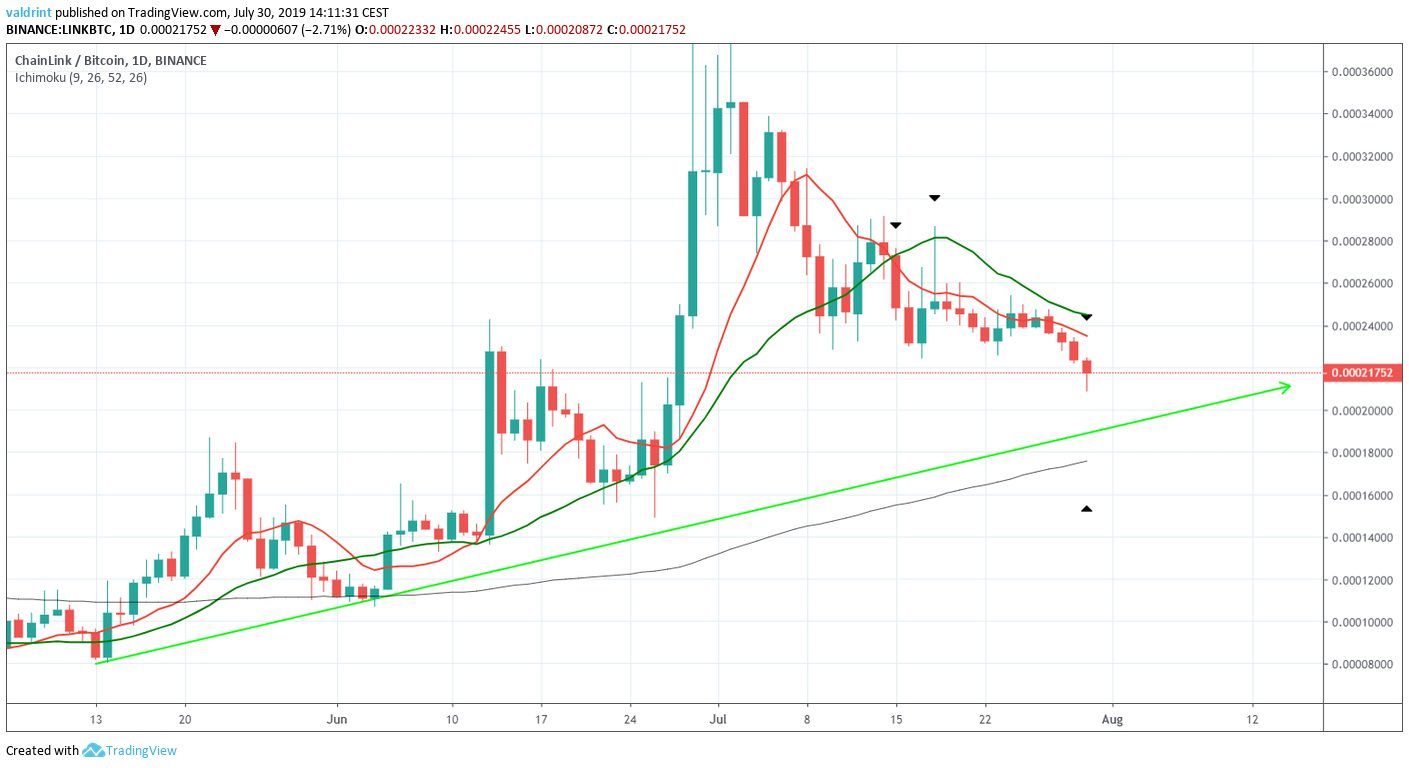
The 10- and 20-day MAs made a bearish cross on July 14.
The price has been trading below both MAs since, facing very close resistance from the 10-day one.
However, we can see that the 100-day MA is moving upward and approaching the ascending support line.
This further increases its significance and makes it very unlikely that the price will decrease below it.
Future Movement
However, the LINK price decrease will not necessarily follow a straight line.
In order to try and predict future movement, we have identified a possible descending support line that the price has been following since June 27.
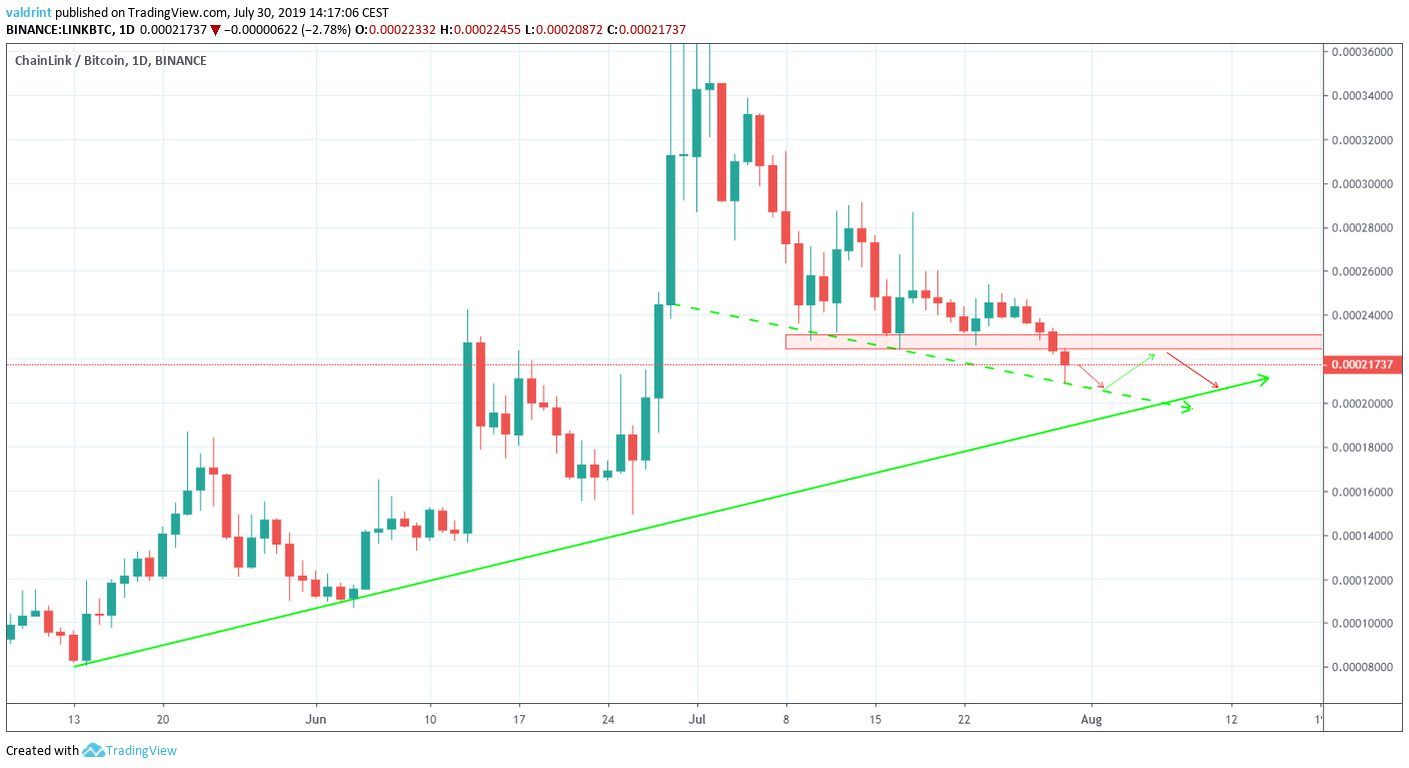
The price should decrease at the rate predicted by the new descending support (dashed line) until it reaches the long-term ascending support line.
If an upward move is initiated, it should stop short of the 23,000 satoshi level, where the breakdown from the triangle occurred.
Chainlink Price Summary
The LINK price recently broke down from a descending triangle.
According to our analysis, it is likely to continue decreasing until it reaches the support line outlined above.
Do you think LINK will reach the support line? Let us know in the comments below.
Disclaimer: This article is not trading advice and should not be construed as such. Always consult a trained financial professional before investing in cryptocurrencies, as the market is particularly volatile.
Images are courtesy of Shutterstock, TradingView.


