
On July 10, the Chainlink price reached a low of 22,824 satoshis. It began an upward move shortly after and reached a high of 29,000 satoshis on July 14. Another decrease began, and the LINK price again reached lows of 22,436 satoshis on July 17.
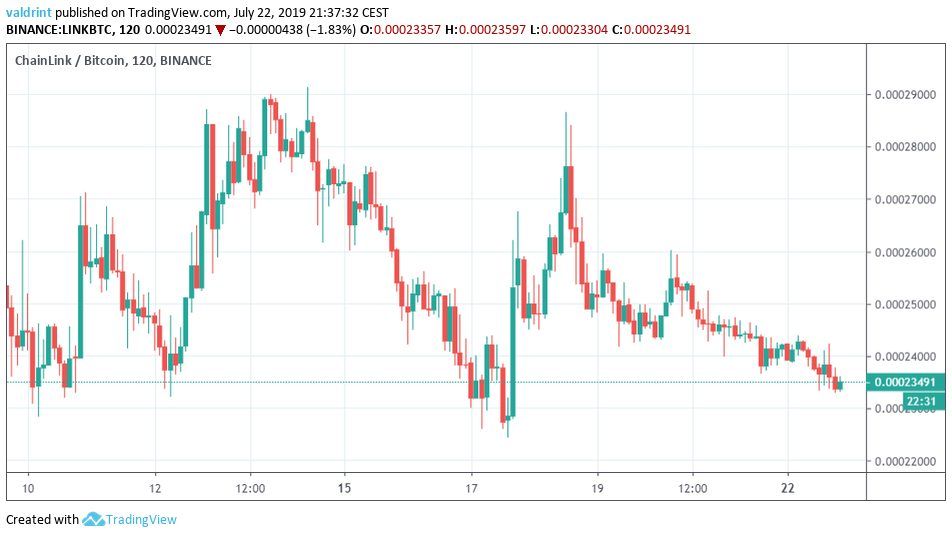
After another unsuccessful attempt at initiating an upward move, LINK began a decrease — which is still continuing.
At the time of writing, it was trading at 23,500 satoshis.
Where will LINK make a bottom? Keep reading below in order to find out.
For our previous analysis, click here.
If you are interested in trading cryptocurrencies with a multiplier of up to 100x on our new partner exchange with the lowest fees, follow this link to get a free StormGain account!
Chainlink Price: Trends and Highlights for July 23
- LINK/BTC is trading inside a descending triangle.
- It is following an ascending support line.
- Daily moving averages have made a bearish cross.
- There is support near 17,000 satoshis.
LINK Price in a Descending Triangle
Since reaching a high on July 8, the LINK price has been decreasing — trading inside the descending triangle outlined below.
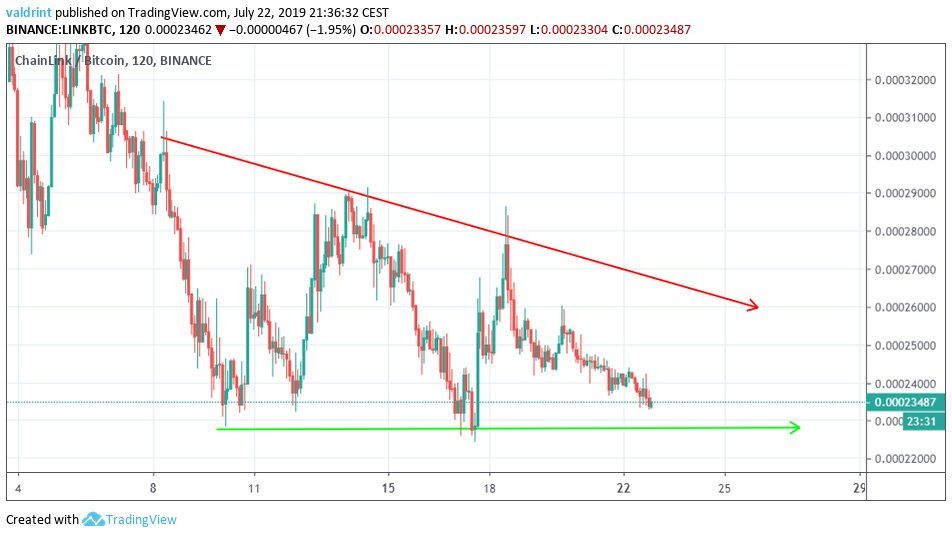
The descending triangle is a bearish pattern, making price decreases more likely.
At the time of writing, LINK was trading slightly above the support line of the triangle.
Will it break down?
Possible Breakdown
First, we will begin with a long-term view.
We can see that LINK has been following an ascending support line since May 13.
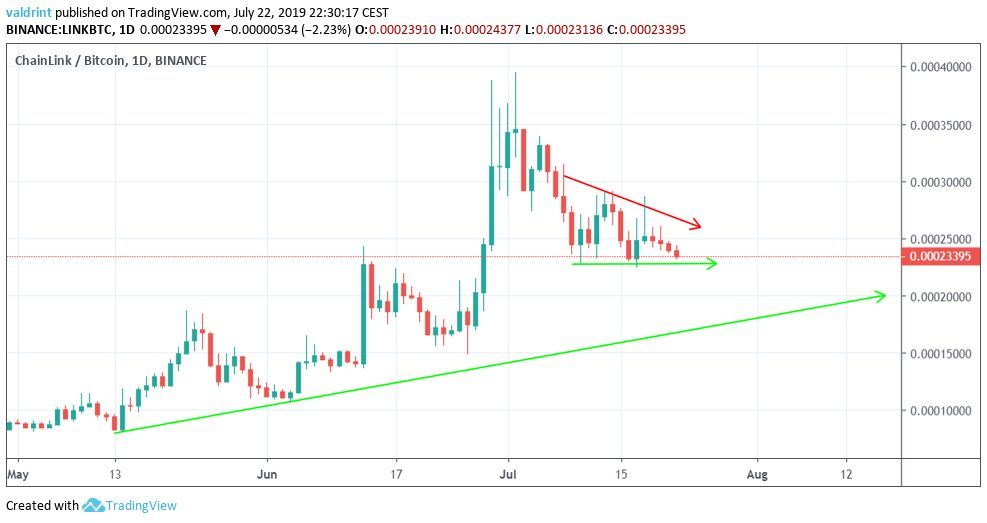
The triangle is significantly higher than the support line.
The lack of a meaningful support area combined with the fact that the descending triangle is a bearish pattern makes a LINK price breakdown more likely.
Furthermore, a look at the moving averages & the MACD supports this idea.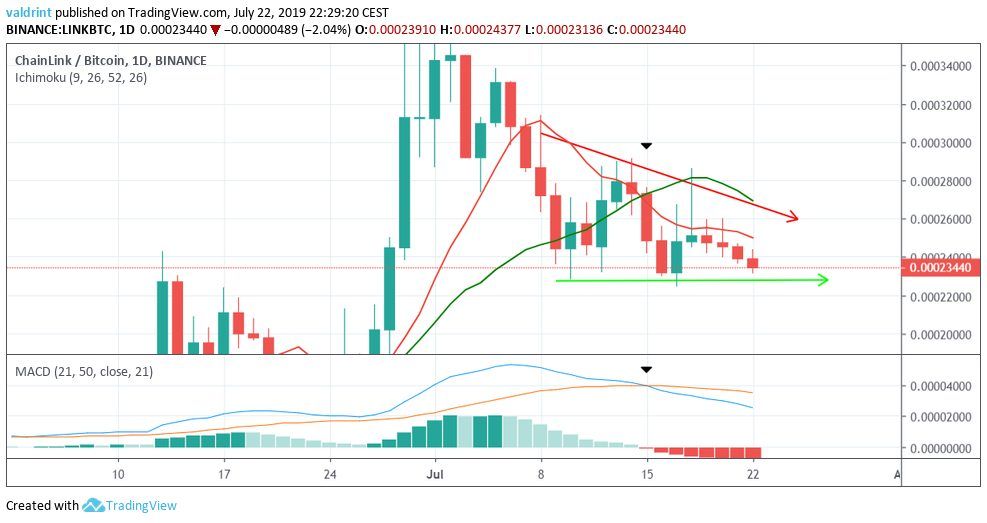
The MACD followed suit shortly after.
The Chainlink price has been facing very close resistance from the 10-day MA.
Also, the attempt at a breakout on July 17 was stopped once the price reached the 20-day MA.
To conclude, we believe that the LINK price will soon break down from the triangle.
If it does, where will it find support?
Support Area
In case a breakdown occurs, one support area is outlined below.
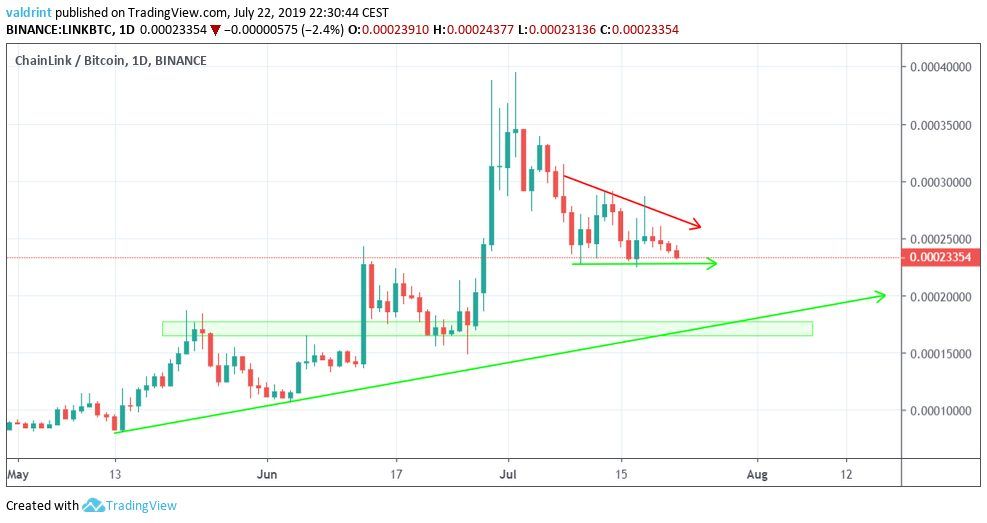
The closest support area is found near 17,000 satoshis.
If the LINK price breaks down from the triangle, it is likely to reach this area.
Afterward, this would be a suitable place for the beginning of a reversal.
Summary
After reaching a high in early July, the LINK price has been decreasing — trading inside a descending channel.
According to our analysis, it is likely to break down from it and reach the support area outlined above.
Do you think LINK will reach the support area outlined above? Let us know in the comments below.
