
The Chainlink (LINK) price has possibly begun a long-term bullish trend reversal. An increase above $9.10 would confirm it.
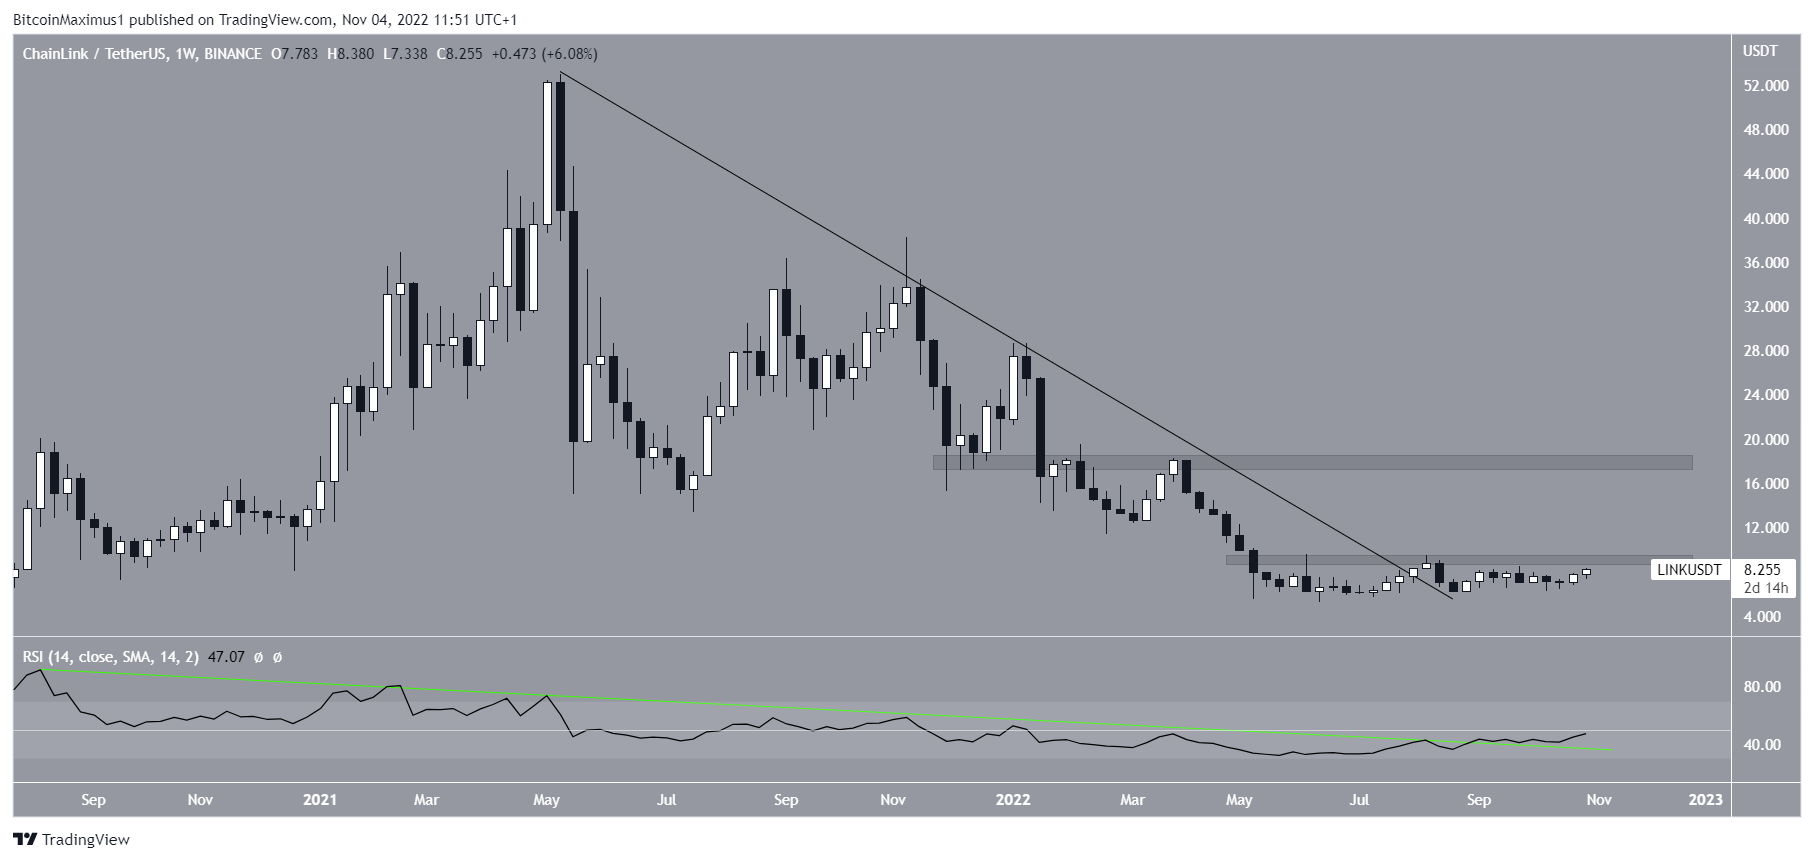
The LINK price had fallen below a descending resistance line since reaching an all-time high price of $53 in May 2021. The downward movement led to a low of $5.30 in June 2022.
Afterward, Chainlink began an upward movement and broke out from the line on Aug. 5. However, it failed to move above the $9.40 horizontal resistance area.
The RSI legitimizes the breakout, since it has also broken out from its bearish divergence trend line (green line). Currently, it is in the process of moving above 50.
An RSI breakout above 50 combined with a LINK price breakout above $9.10 would confirm the bullish reversal. In this case, the next resistance would be at $18.
Chainlink Price Prediction: Will Breakout Occur?
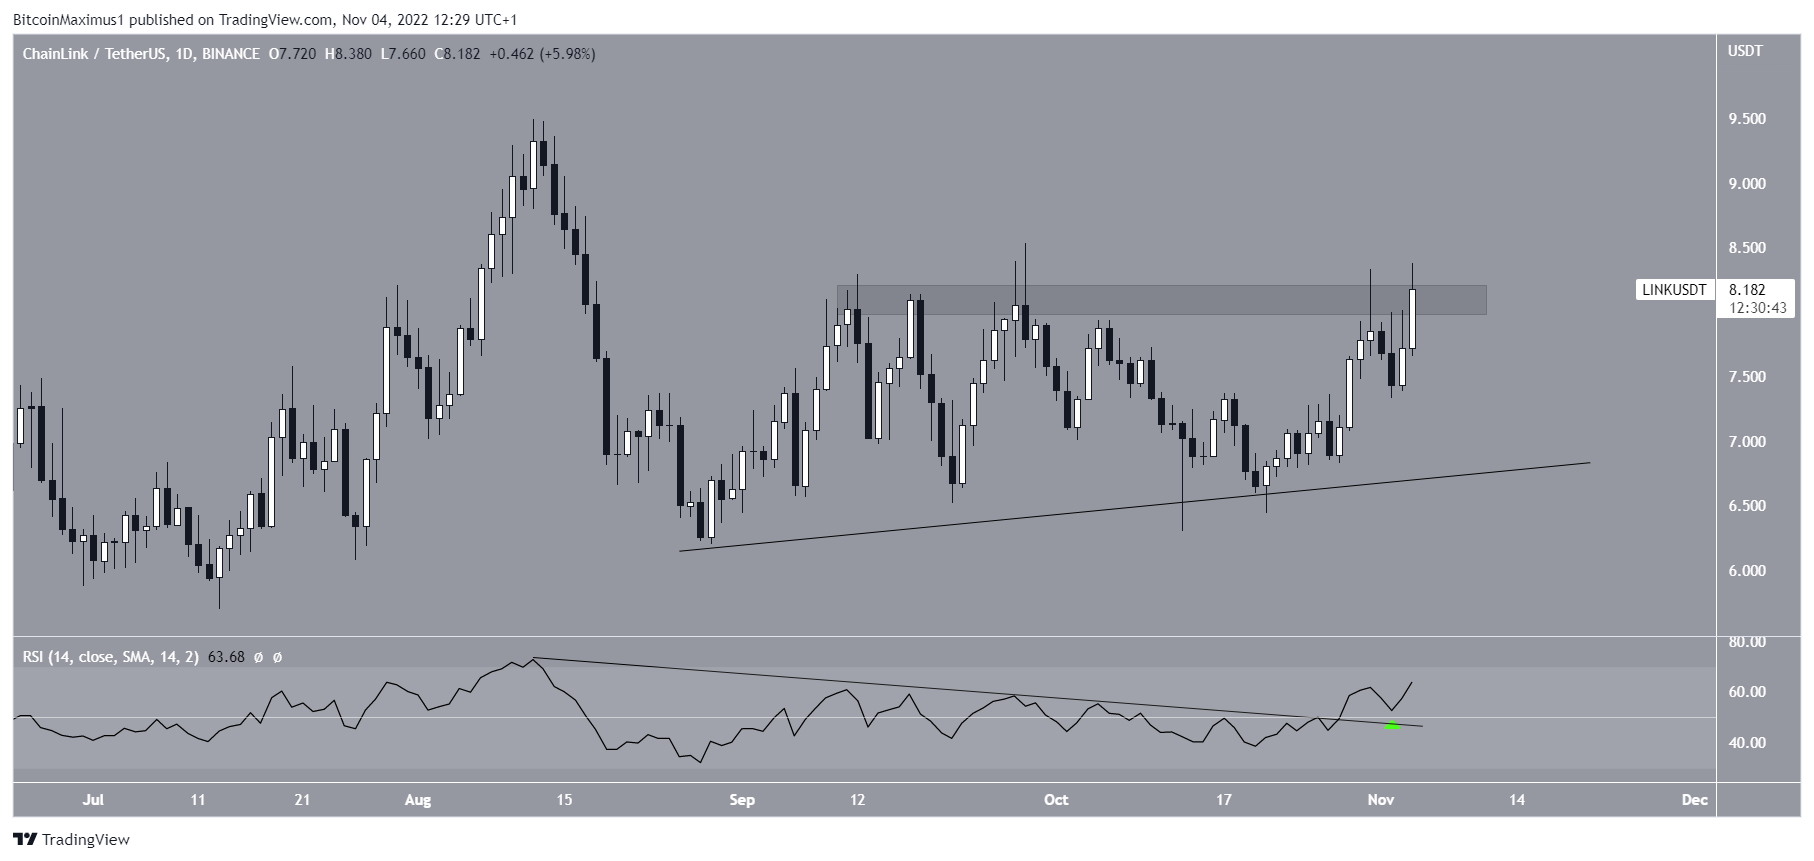
Technical analysis of the daily chart also supports the continuation of the upward movement. Chainlink has been following an ascending support line since Aug. 28 and bounced above it on Oct. 23.
The upward movement took it to the $8.10 horizontal resistance area. A breakout above it would take LINK to the previously mentioned $9.40 resistance. The price action has been especially bullish over the past 24 hours.
The RSI supports the breakout, since it has broken out from its own descending resistance line (black) and moved above 50 (green icon). Both of these are considered signs of a bullish trend and support the continuation of the upward price movement.
Conversely, a daily close below the ascending support line would invalidate the bullish Chainlink price prediction and suggest new lows are expected instead.
For the latest BeInCrypto Bitcoin (BTC) and crypto market analysis, click here
Disclaimer: BeInCrypto strives to provide accurate and up-to-date information, but it will not be responsible for any missing facts or inaccurate information. You comply and understand that you should use any of this information at your own risk. Cryptocurrencies are highly volatile financial assets, so research and make your own financial decisions.
