
Chainlink’s (LINK) price has lost 10% of its value in the last three days, falling from $13.76 to $12.44. This decrease comes at the expense of LINK holders, who saw the price rise to $15 on July 21.
As it stands, investors who have LINK in their portfolio will expect respite. However, data analyzed today shows that a bullish reversal may be off the table.
Chainlink Gives a Warning
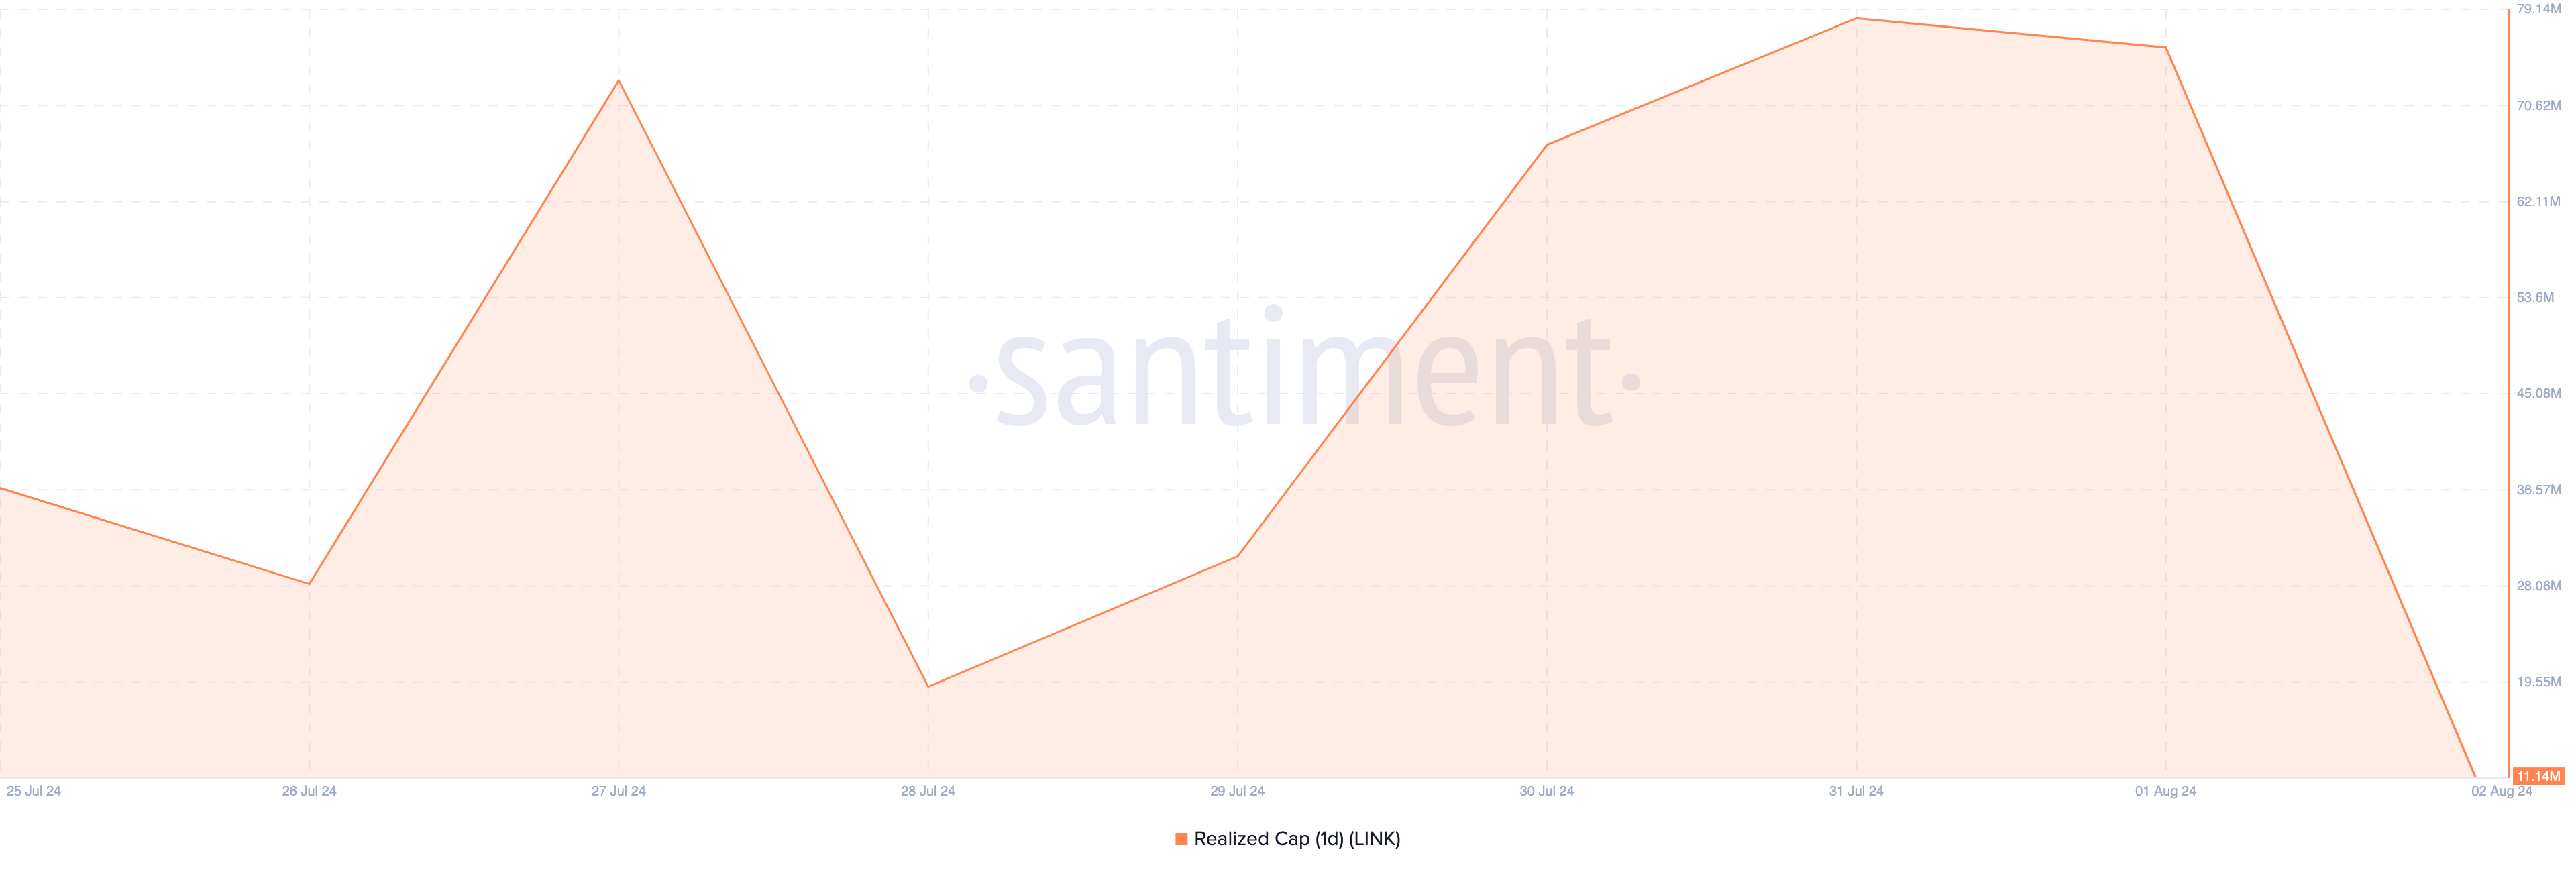
One of the reasons for this prediction is Chainlink’s Realized Capitalization, which had tumbled from 75.51 million to 11.14 million. As one of the most important on-chain metrics, Realized Cap shows the sum of all realized profits subtracted from realized losses.
An increase in the value indicates that investors accumulate tokens at low prices, which eventually precedes a price increase. However, the decline in LINK’s Realized Cap suggests that the cryptocurrency is being revalued, and it changed hands from short-term holders to those with high convictions.
Historically, the decline in the metric foreshadows a lengthy consolidation period or notable nosedive. Therefore, if the value continues to drop, then LINK, which trades at $12.49, may have to deal with another decrease.
Read more: How To Buy Chainlink (LINK) and Everything You Need To Know
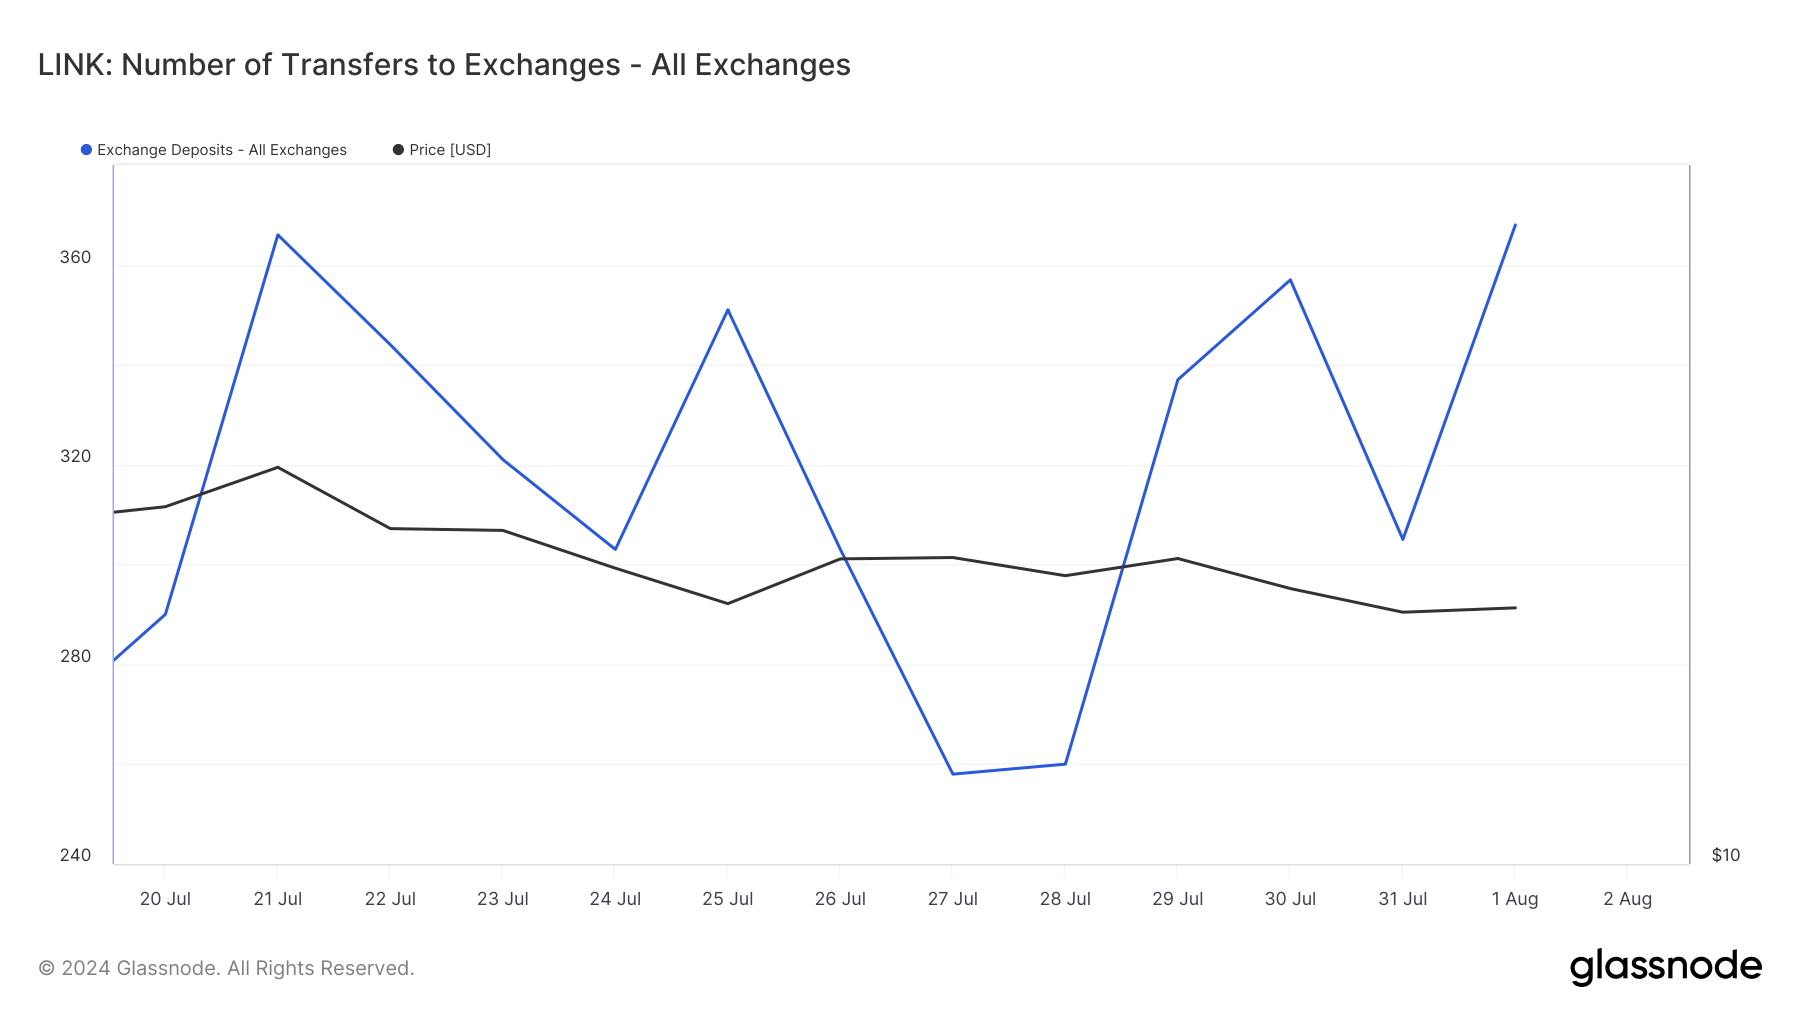
In addition, data from Glassnode shows an increase in the number of LINK tokens sent to exchanges. When exchange deposits surge, it means that market participants are willing to sell.
However, a decrease implies that holders refrain from sending tokens to exchanges. Instead, they prefer to keep them in self-custody.
The latter increases the chance of a price bounce. Thus, in LINK’s case, the rise in exchange deposits gives credence to further downward pressure.
LINK Price Prediction: More Downside
At $12.65, LINK trades within a symmetrical triangle on the daily chart. This pattern typically forms when two trendlines connecting a series of highs and lows converge. It often indicates a pause in the prevailing trend before it eventually resumes.
Since LINK has trended downward in the last three days, there is a chance that it will consolidate for the time being. Afterward, provided there is no sudden change in the market, the price may continue moving down.
If this happens, LINK’s price may drop below $12 and approach the underlying point of interest around $11.04.
Furthermore, the Moving Average Convergence Divergence (MACD) is negative, indicating bearish momentum around the token. If unchanged, the aforementioned prediction may come to pass.
Read more: Chainlink (LINK) Price Prediction 2024/2025/2030
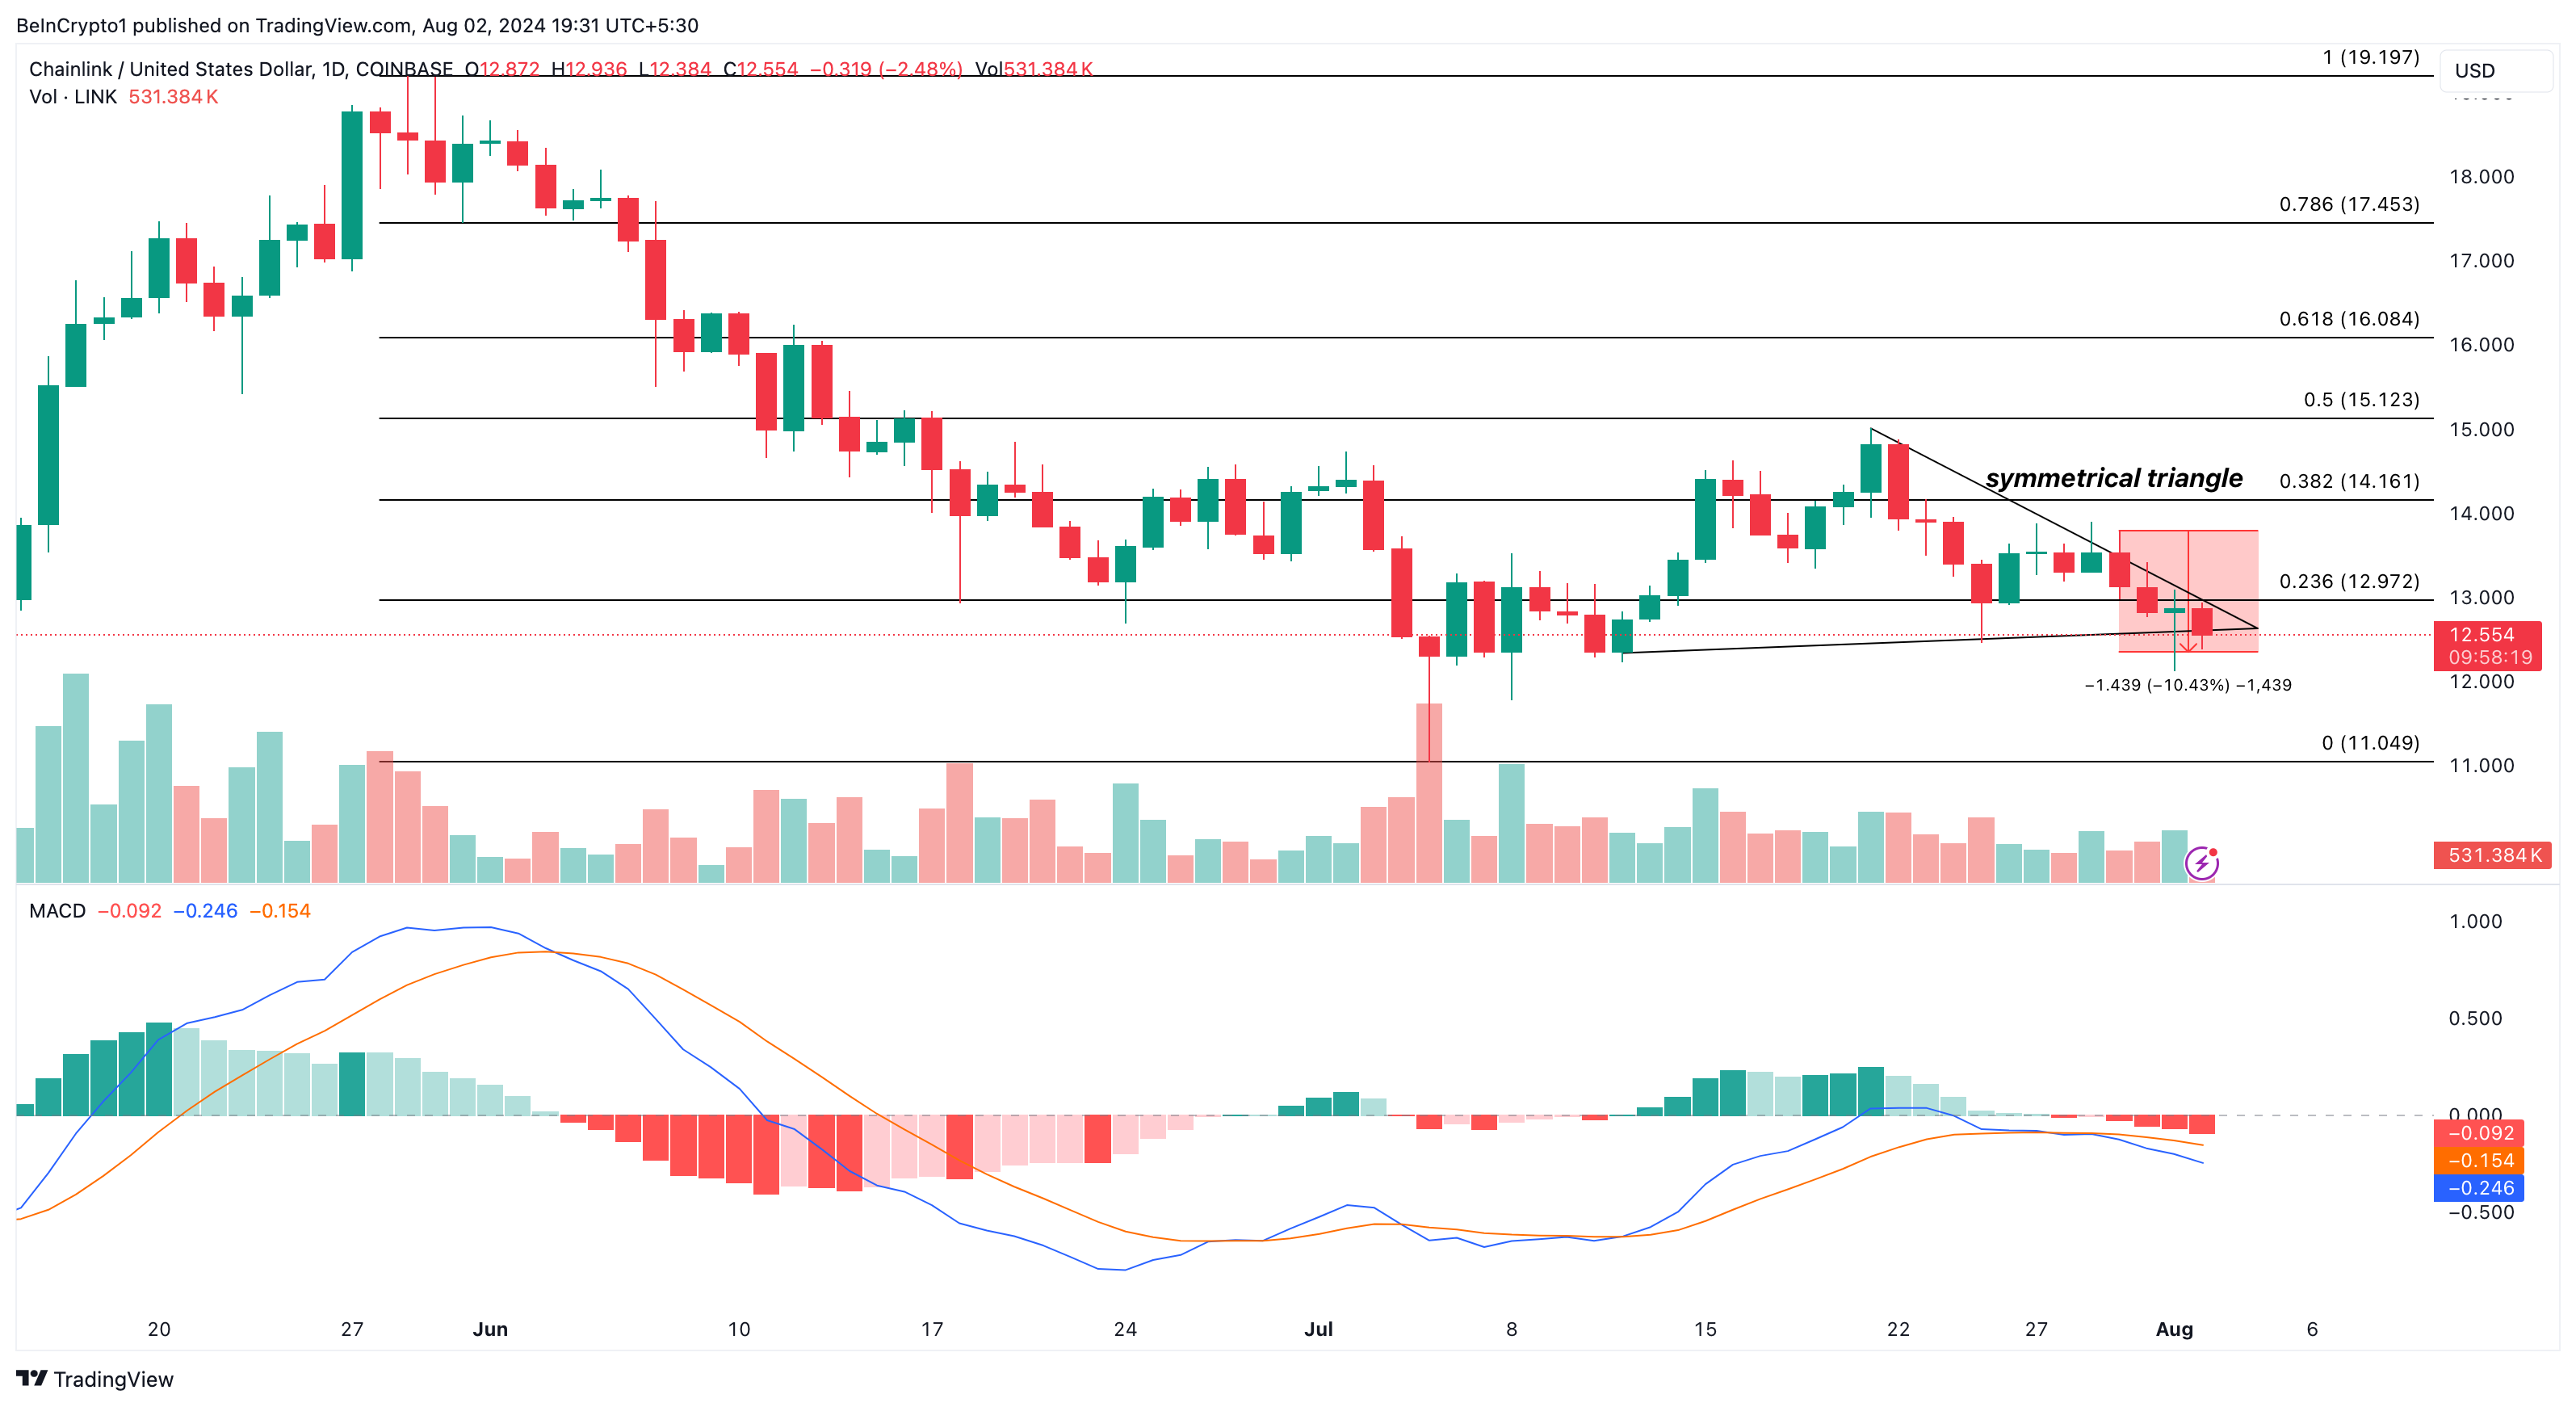
However, if bulls defend the LINK’s price from declining below $12, then a bounce may happen. If this occurs, the token’s price could reverse toward $14.16.
