


The Chainlink (LINK) price shows bullish signs in the weekly and daily time frame. It is approaching a key long-term resistance level.
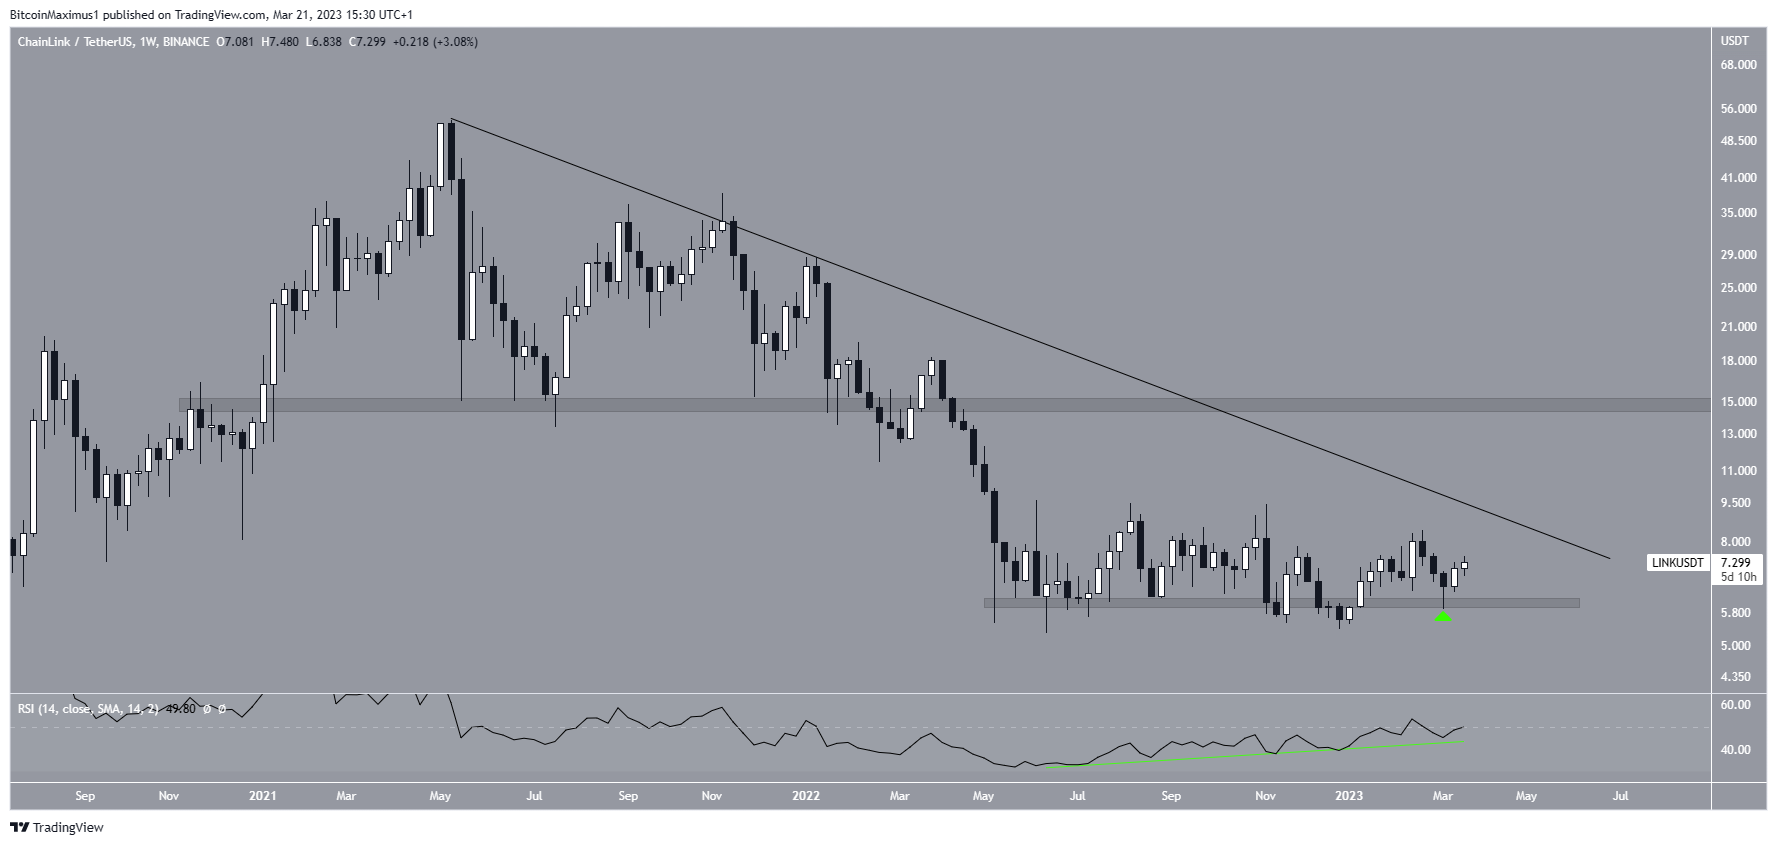
LINK is the native token of Chainlink, which uses a decentralized oracle network to allow blockchain networks to interact with external data feeds. It was created by Sergey Nazarov. The Chainlink price has fallen under a descending resistance line since reaching an all-time high price of $53 in May 2021.
The decrease culminated in a low of $5.30 in June 2022. Since then, the price has traded very close to the $6.10 horizontal support area. More recently, the LINK price created a long lower wick and a higher low (green icon), which can be considered the first step in a bullish structure.
Moreover, the weekly RSI has generated bullish divergence for the entire period. The indicator has now almost moved above 50.
If the increase continues, the resistance line at $8 is expected to provide resistance. A breakout from the line could take the price to the $14.90 resistance area.
Chainlink (LINK) Deviation and Reclaim Increase Bullish Sentiment
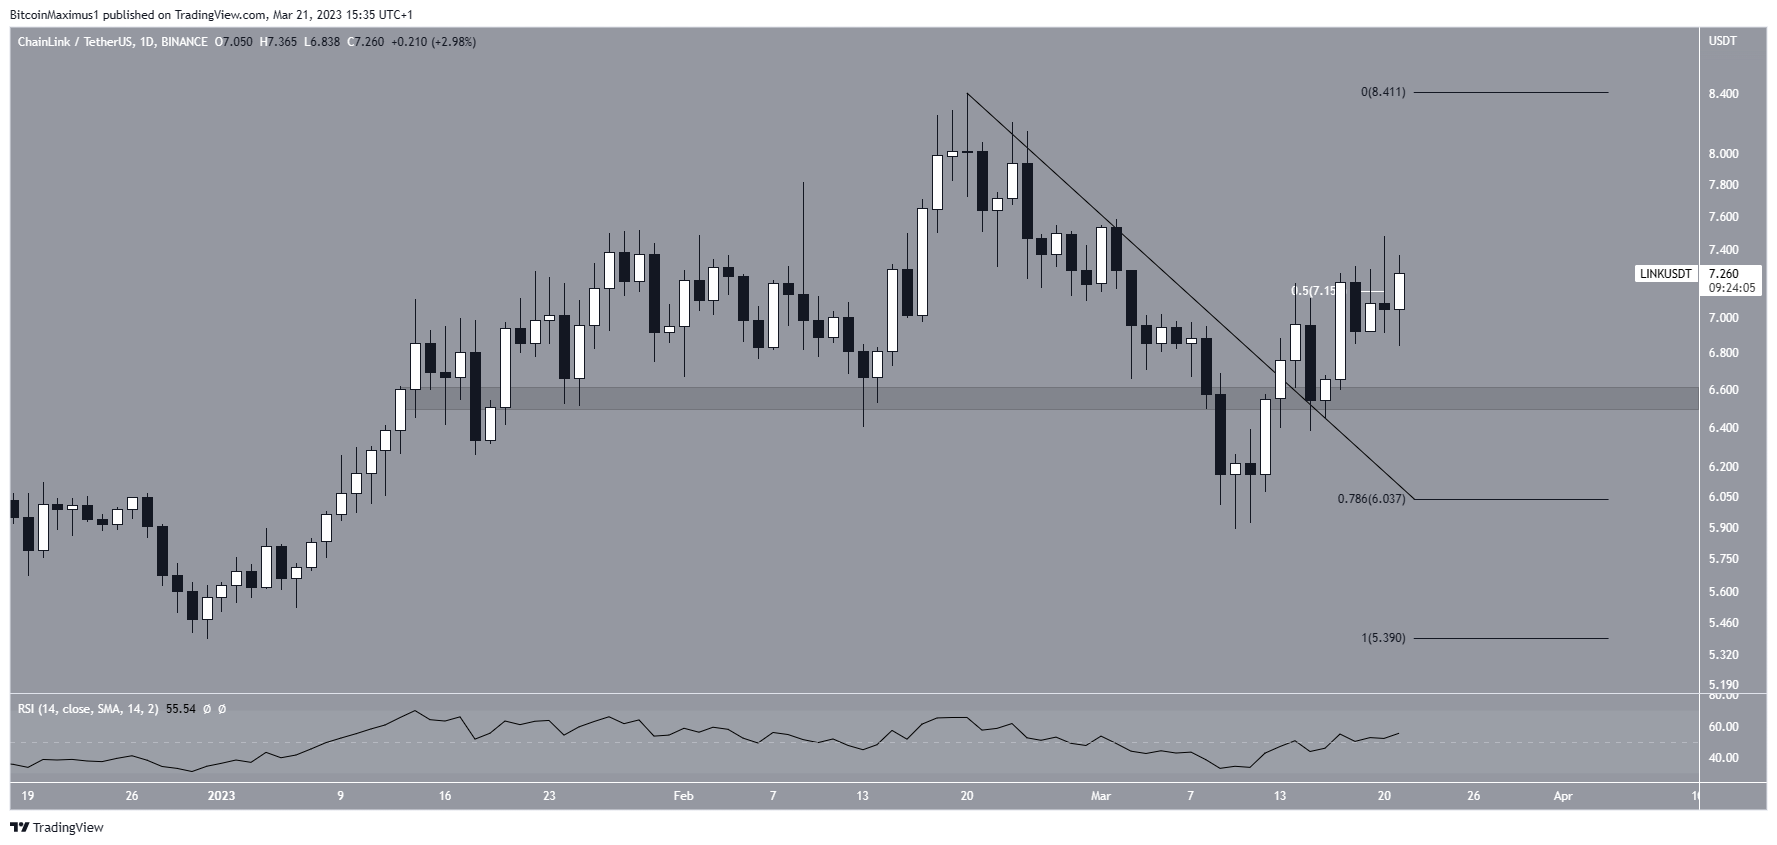
The technical analysis from the daily time frame provides a more bullish outlook. The price has increased since March 10 and broke out from a descending resistance line four days later. Then, it validated both the resistance line and the $6.55 area as support before moving upward. This entire movement occurred after the price deviated below the $6.55 area. Finally, the daily RSI has moved above 50.
There are all bullish signals that suggest the trend is bullish. Currently, the LINK price faces resistance from the 0.5 Fib retracement resistance level at $7.15 which caused a rejection over the past 24 hours. Once it manages to break out, it could reach the long-term resistance line at $8.
To conclude, the reading from the weekly and especially the daily time frame are bullish. They suggest an increase toward $8, and potential breakout are likely. If they materialize, the LINK token price could increase all the way to $14.90.
On the other hand, the price could fall back to the $6.10 support area is the rally loses momentum. A close below $6.55 would confirm this.


