The Chainlink (LINK) price reached a high of $20.09 on Aug 16 and has been decreasing since.
It is possible that the price has reached a top and has now begun a long-term corrective period.
LINK Makes an Evening Star Pattern
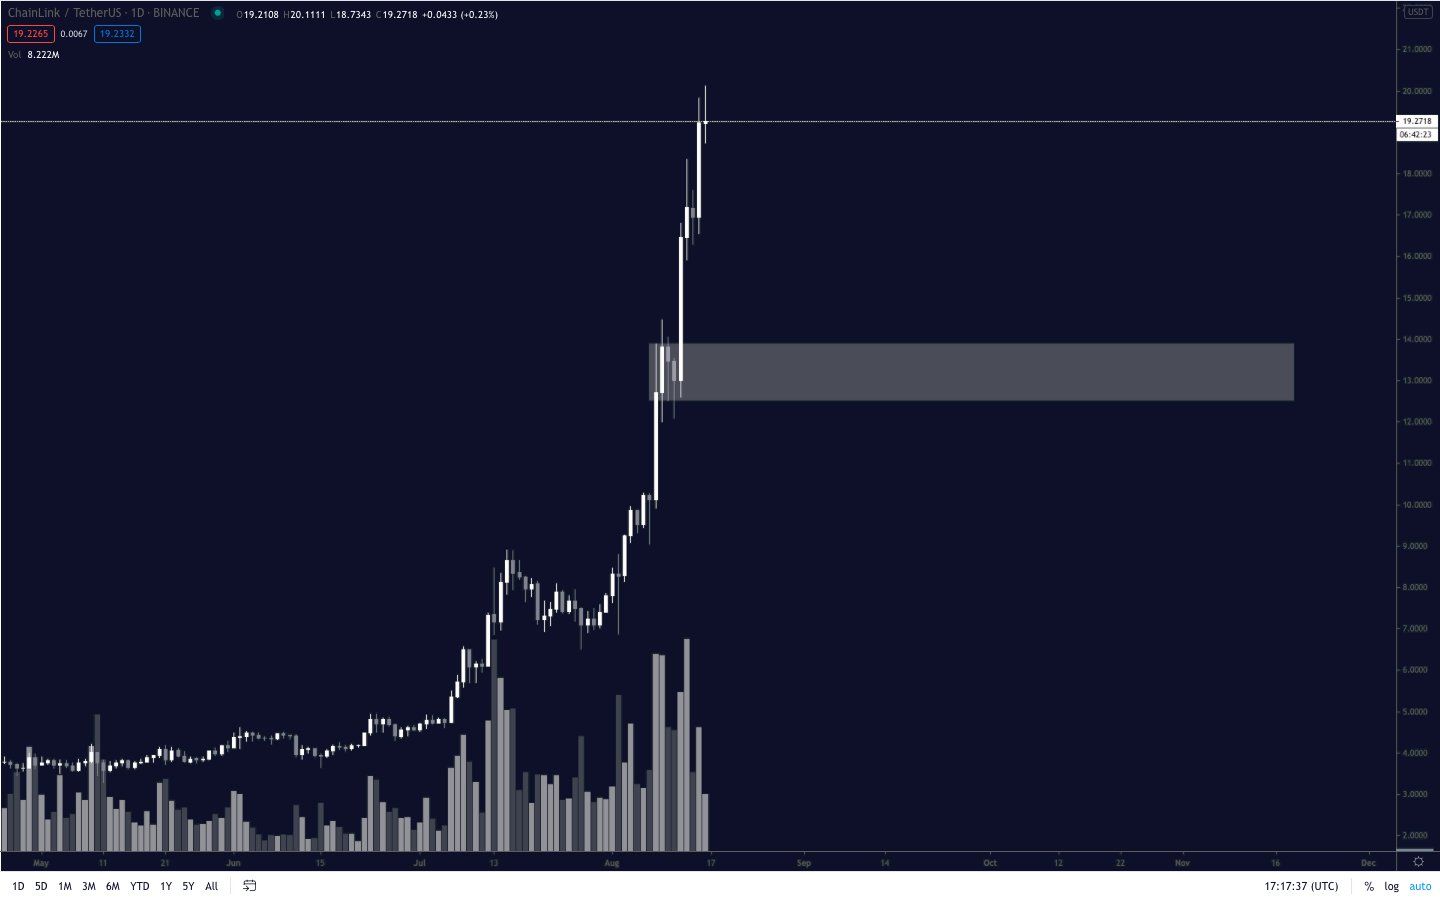
The LINK price has been on a tear since Aug 2 when the price created a Doji candlestick and bounced off of its 50-day moving average (MA). The upward move continued until Aug 16, when the price reached a high of $20.09 before tipping over.
During Aug 15-17, the price created an evening star pattern, which is normally considered a bearish reversal pattern. If the price continues decreasing, the closest support levels are found at $13 and $10.50.
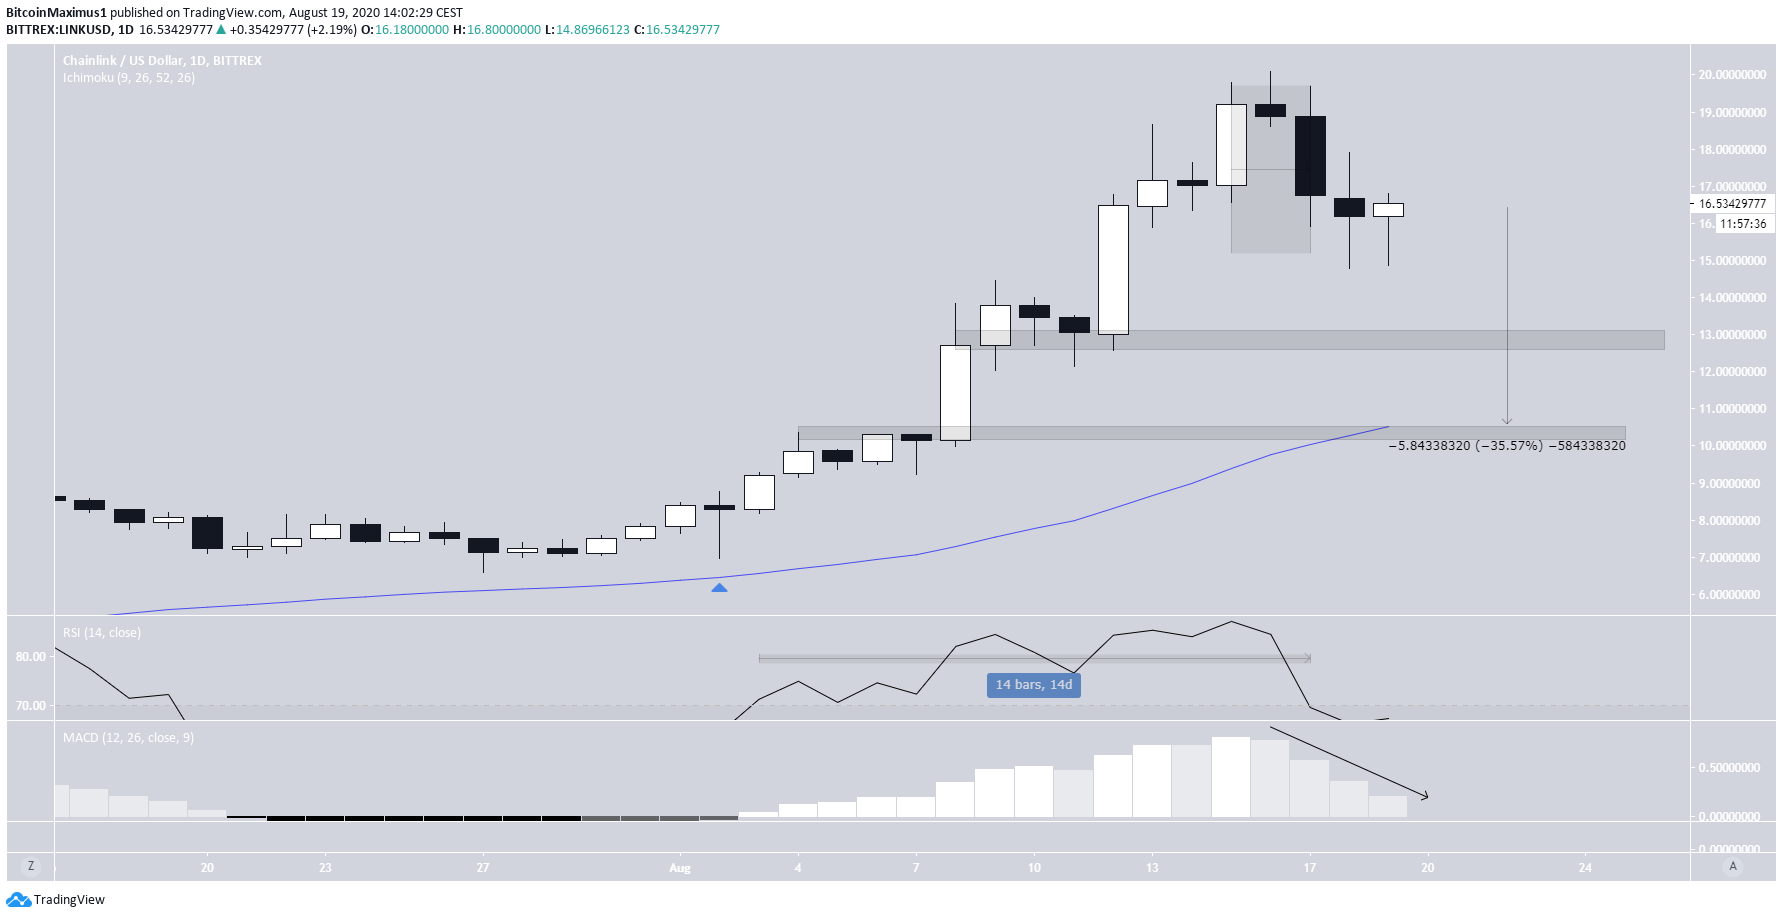
Technical indicators are bearish, though they do not confirm a definite reversal. While the RSI has not generated any bearish divergence, it was overbought for a full 14 days and has fallen since. The MACD has been consistently decreasing over the past four days and has almost moved negative.
Even with the significant decrease from the $20.09 highs, the price is still 35% above the 50-day MA, which coincides with the aforementioned $10.50 support area. This goes to show how overextended the current movement has become.
Cryptocurrency trader @Pentosh1 believes that LINK has already reached a top and gave an initial target of $13 for the upcoming decrease. This is the same level as our first support area, making it likely to initiate some kind of bounce if the price gets there.
Attempt at a Reversal
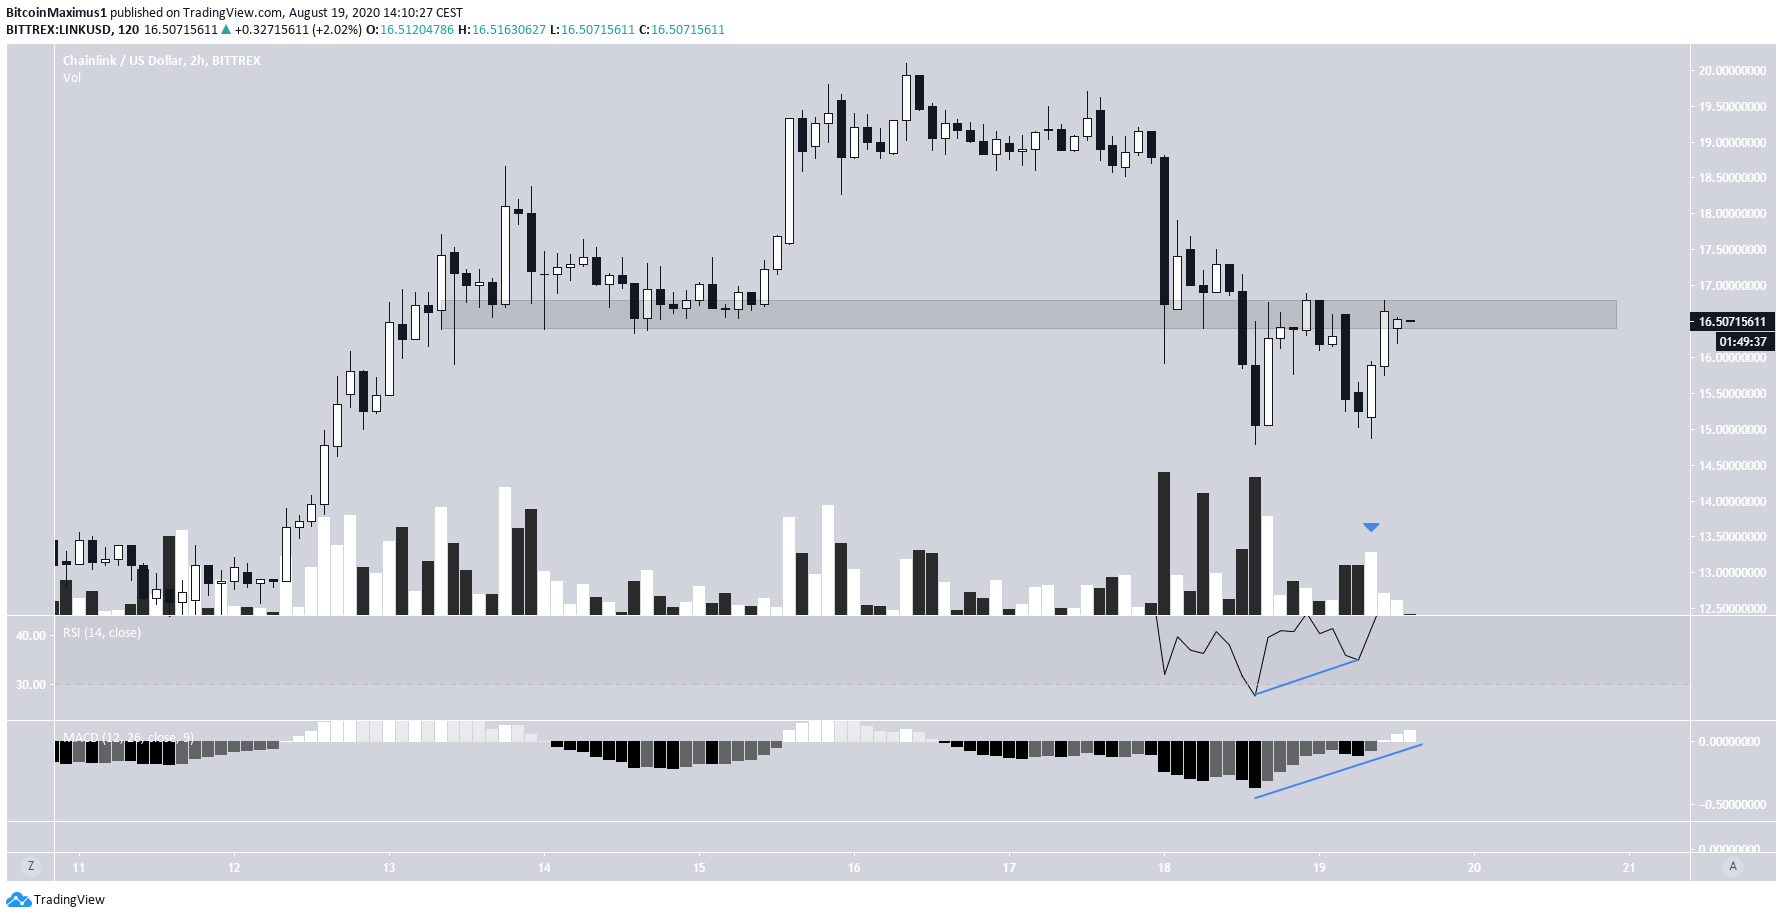
The short-term chart shows that the price has made a double-bottom, which was combined with a bullish divergence in both the RSI and the MACD. However, the price is still struggling to break out from the $16.50 area, which previously acted as support.
Volume has been very low relative to previous decreases during the upward move, reducing the chances of a successful reclaim of the level.
Even if the price were to break out from the current resistance area, it would likely find resistance between $17.50 and $19.
Wave Count
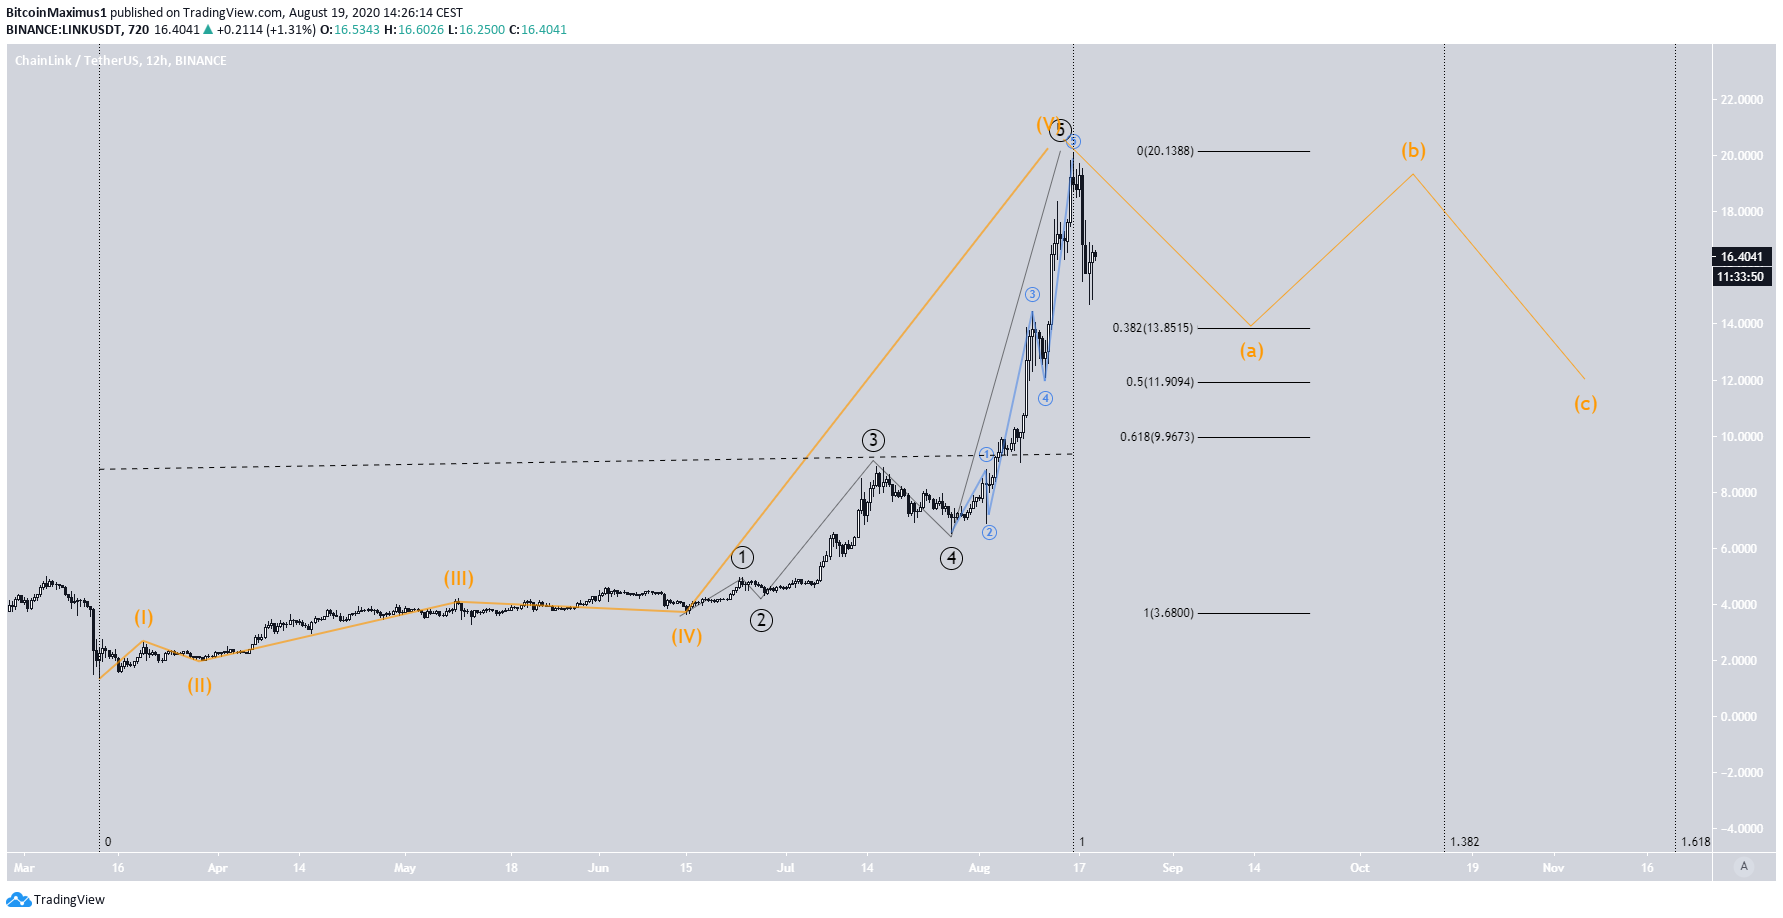
Beginning on March 11, the LINK price began a five-wave impulsive formation (orange). The fifth wave extended into five sub-waves (black), and the fifth sub-wave also extended, creating five more minor sub-waves (blue).
If the price does continue correcting, the most likely reversal levels would be found at $13.85, $11.92, and $9.96, the 0.382, 0.5, and 0.618 Fib levels of the entire upward move.
Due to the length of time it took for the entire upward move to transpire, the correction should be completed between Oct 15-Nov 15, the 1.382-1.618 time Fib levels of the entire upward move.
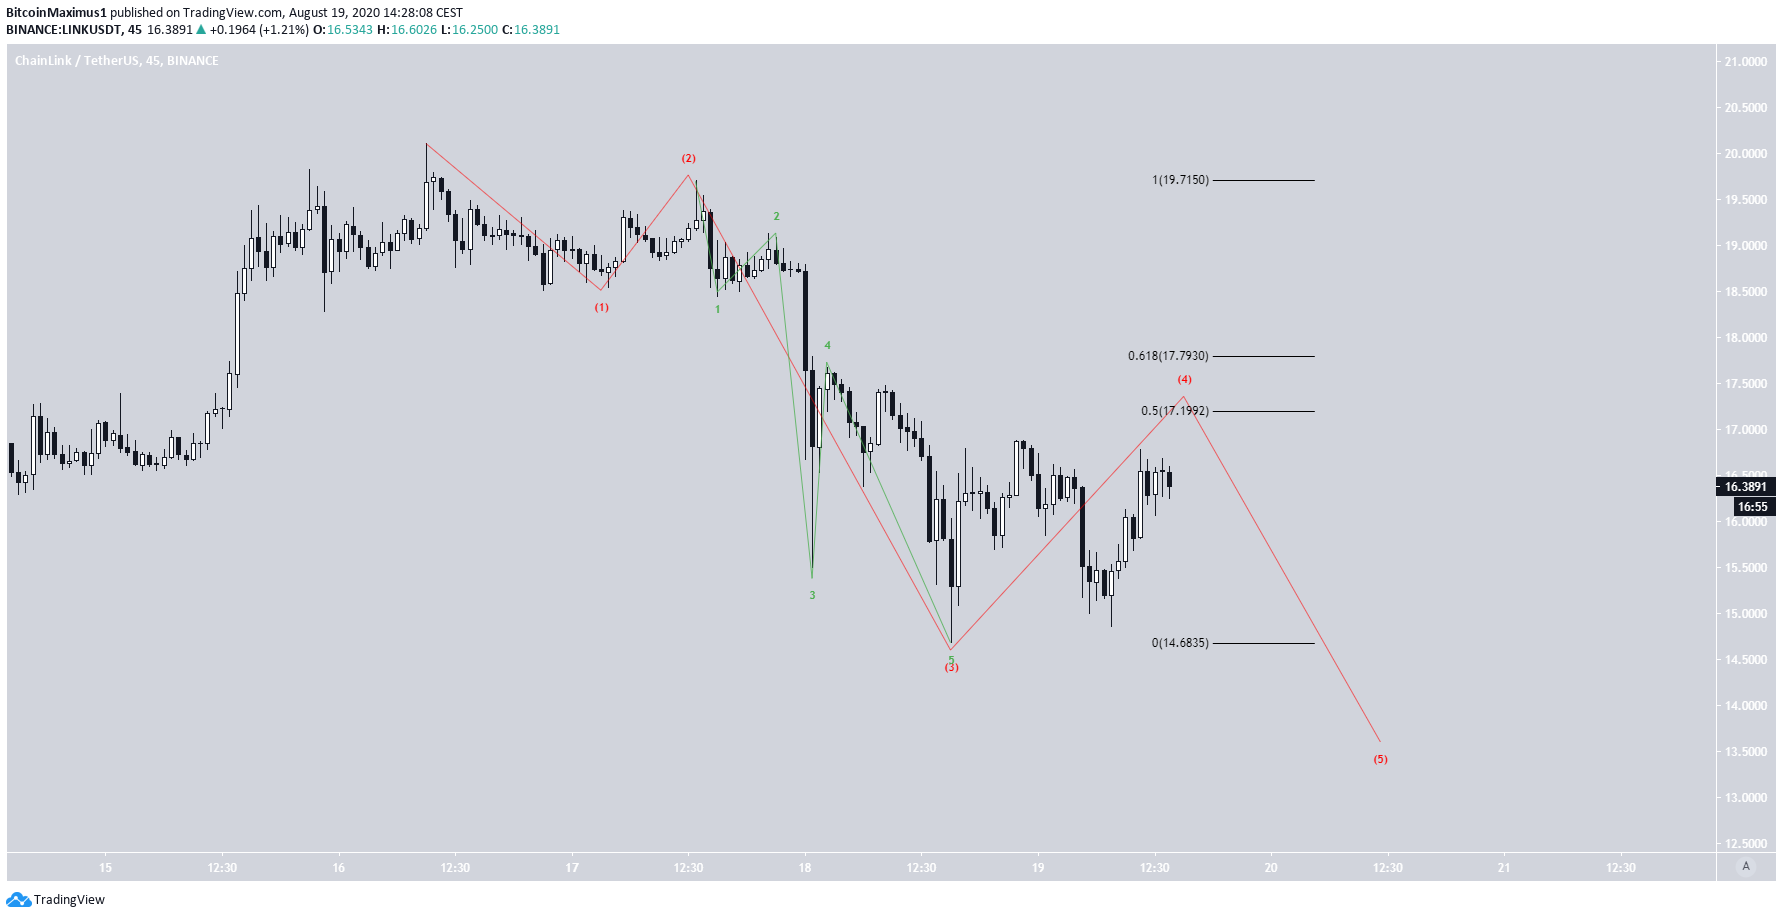
In the short-term, the price is likely in a five-wave impulsive move down, with an extended third wave. The price is currently in the fourth wave, which is expected to end between $17.20-$17.40 before the price resumes its downward movement towards the previously outlined support levels.