
TIA is exhibiting strong bullish momentum, finding support at key technical levels despite facing resistance from the daily Ichimoku Cloud.
Let’s closely examine the price action of TIA, one of the top-performing cryptocurrencies over the past several months.
TIA Experiences Rejection by Daily Ichimoku Cloud
The price of Celestia (TIA) is showing rejection from the upper boundary of the daily Ichimoku Cloud.
The Ichimoku Cloud is acting as resistance, with the price struggling to break above it. Additionally, the 100 EMA (Blue line) at $12.03 is serving as a mid-term resistance level.
The price is currently hovering around $10.73, indicating it is struggling to break both the Ichimoku Cloud and the 200 EMA (in Green).
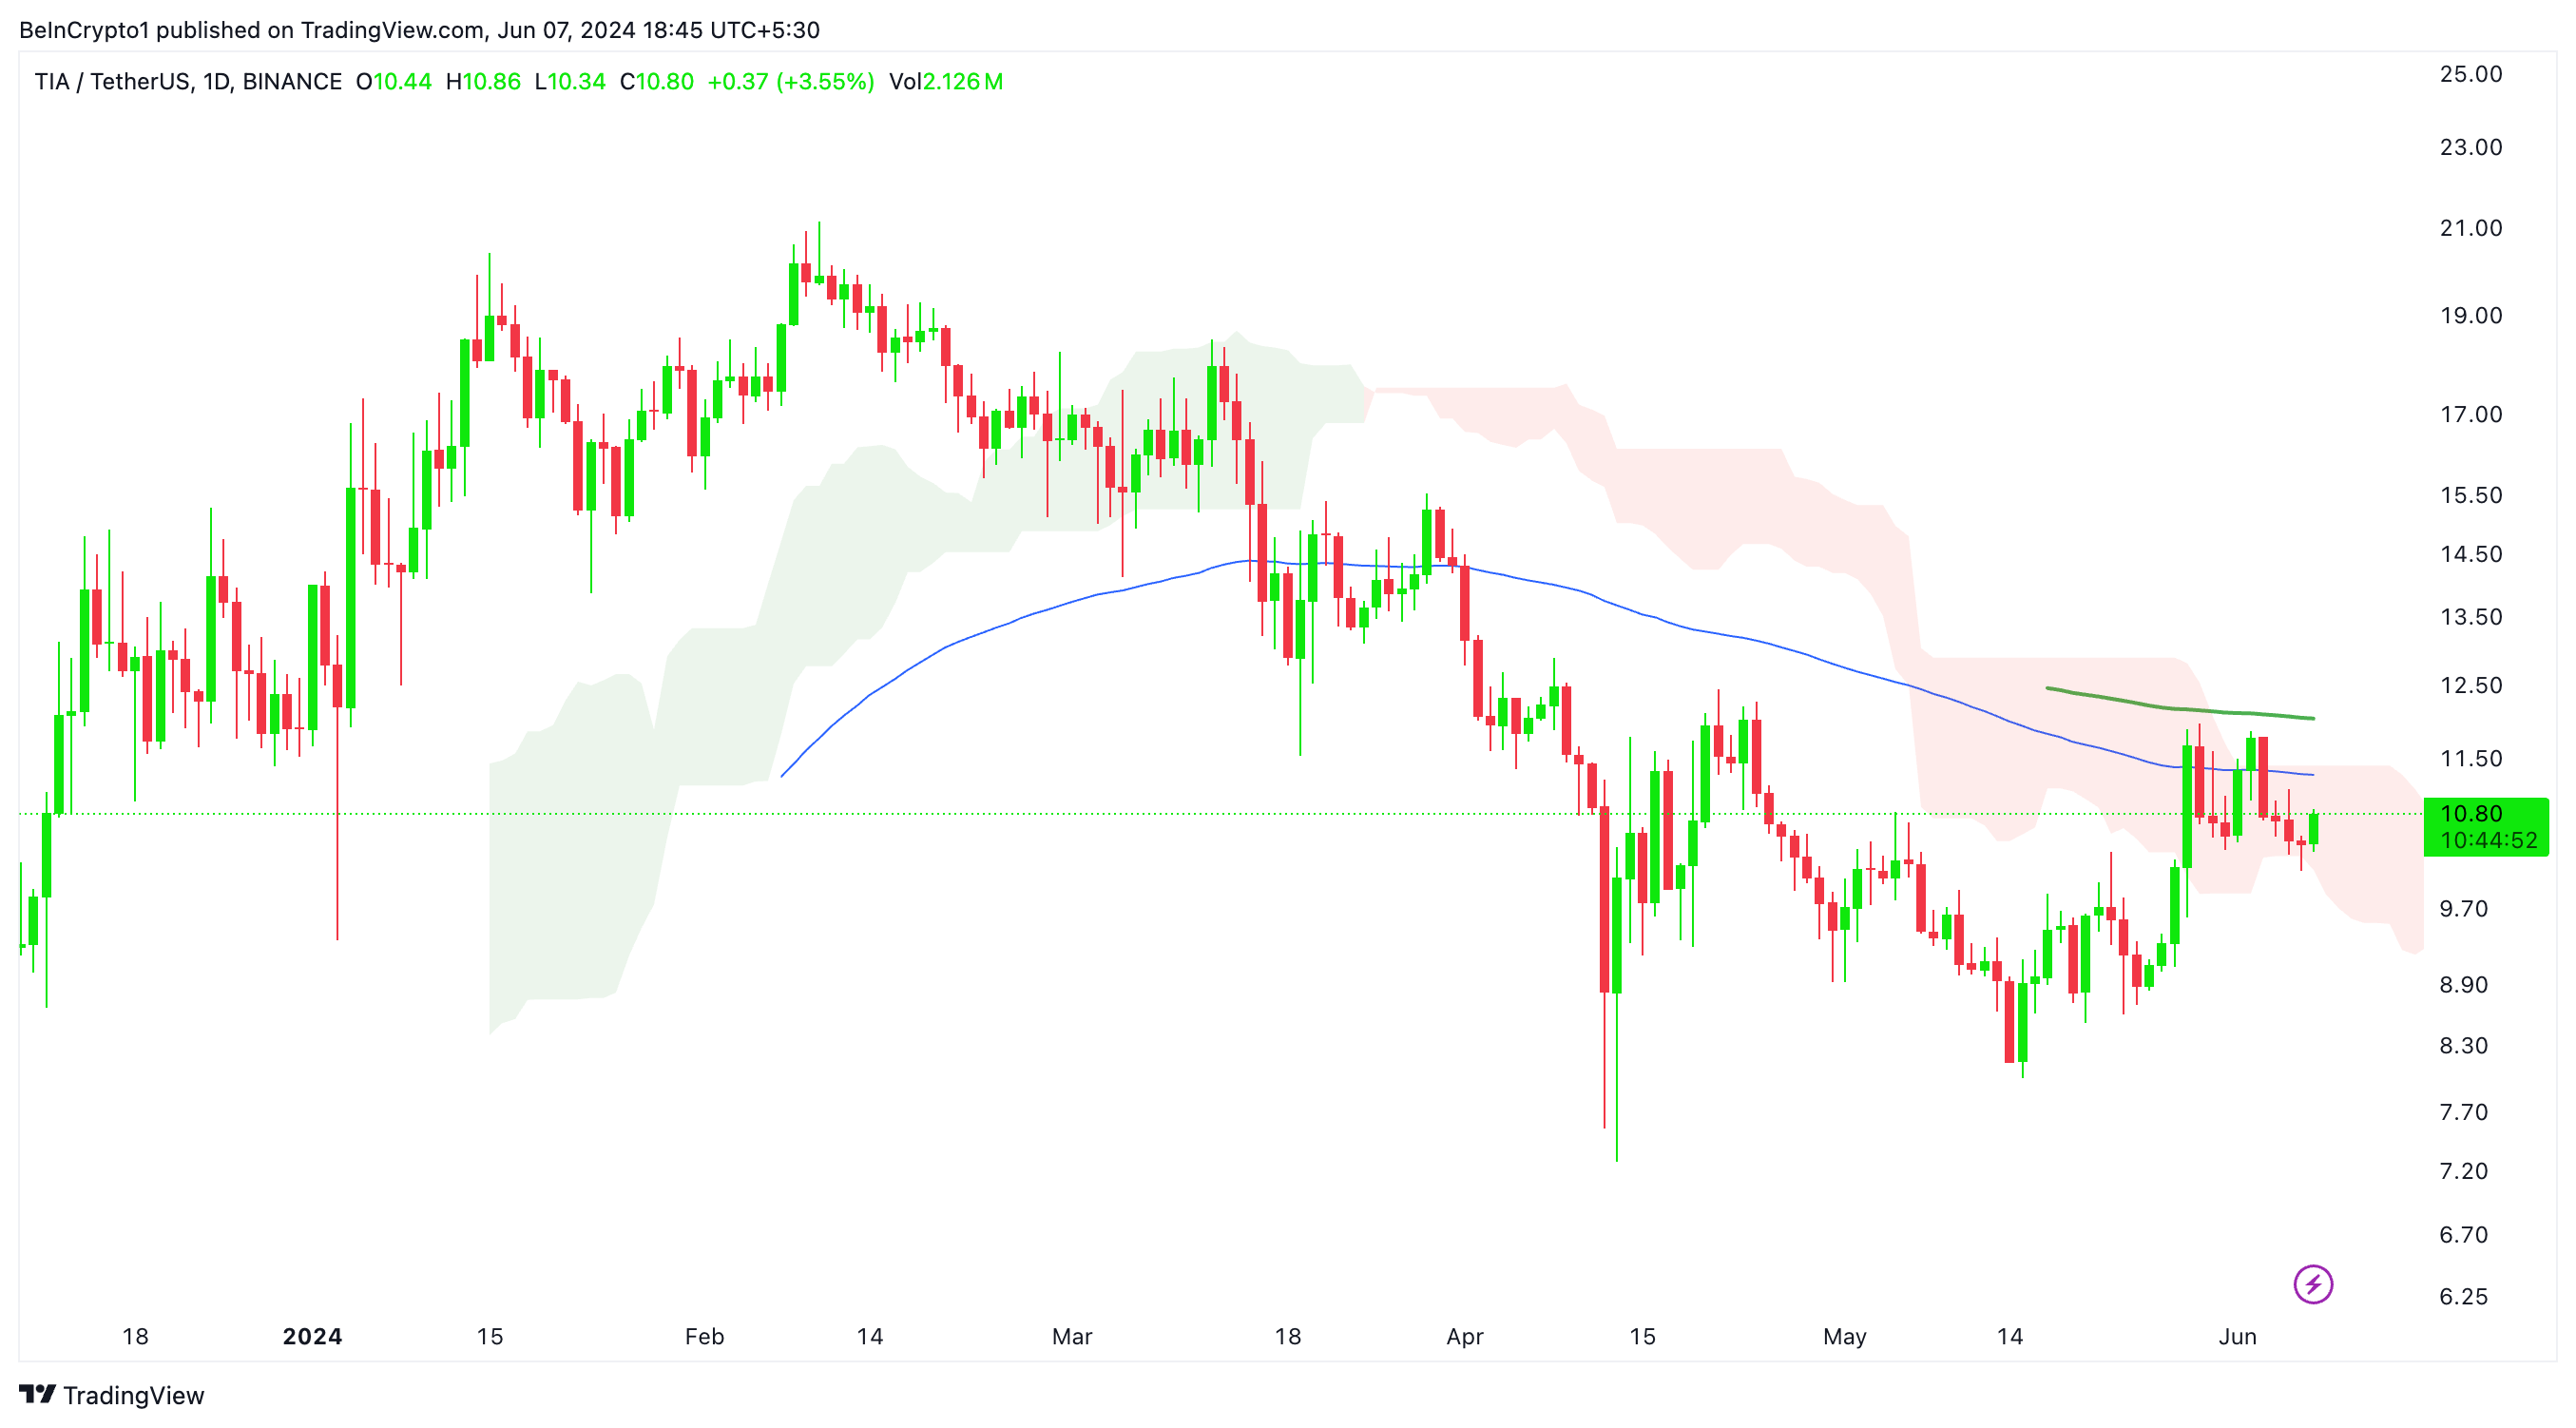
The current price level of $10.73 is below the 100 EMA, suggesting resistance at $12.03. A successful breakout above the 100 EMA could lead to the price testing the 200 EMA and potentially moving above the Ichimoku Cloud, signaling a bullish momentum.
Read More: Best Upcoming Airdrops in 2024
The price of TIA has recovered 46% from its local low of $7.30 set in mid-April, showcasing strong bullish momentum.
Despite the recovery, the price is struggling to break through the Ichimoku Cloud and the 4-hour 200 EMA, indicating significant resistance at these levels.
Support and Resistance Zones Highlighted by Volume Profile
The chart’s volume profile on the right side represents the trading volume at various price levels over a given period.
The areas around $10.50 and $12.00 show higher trading volumes. This suggests these levels are critical points where buyers and sellers have been most active, providing strong support and resistance.
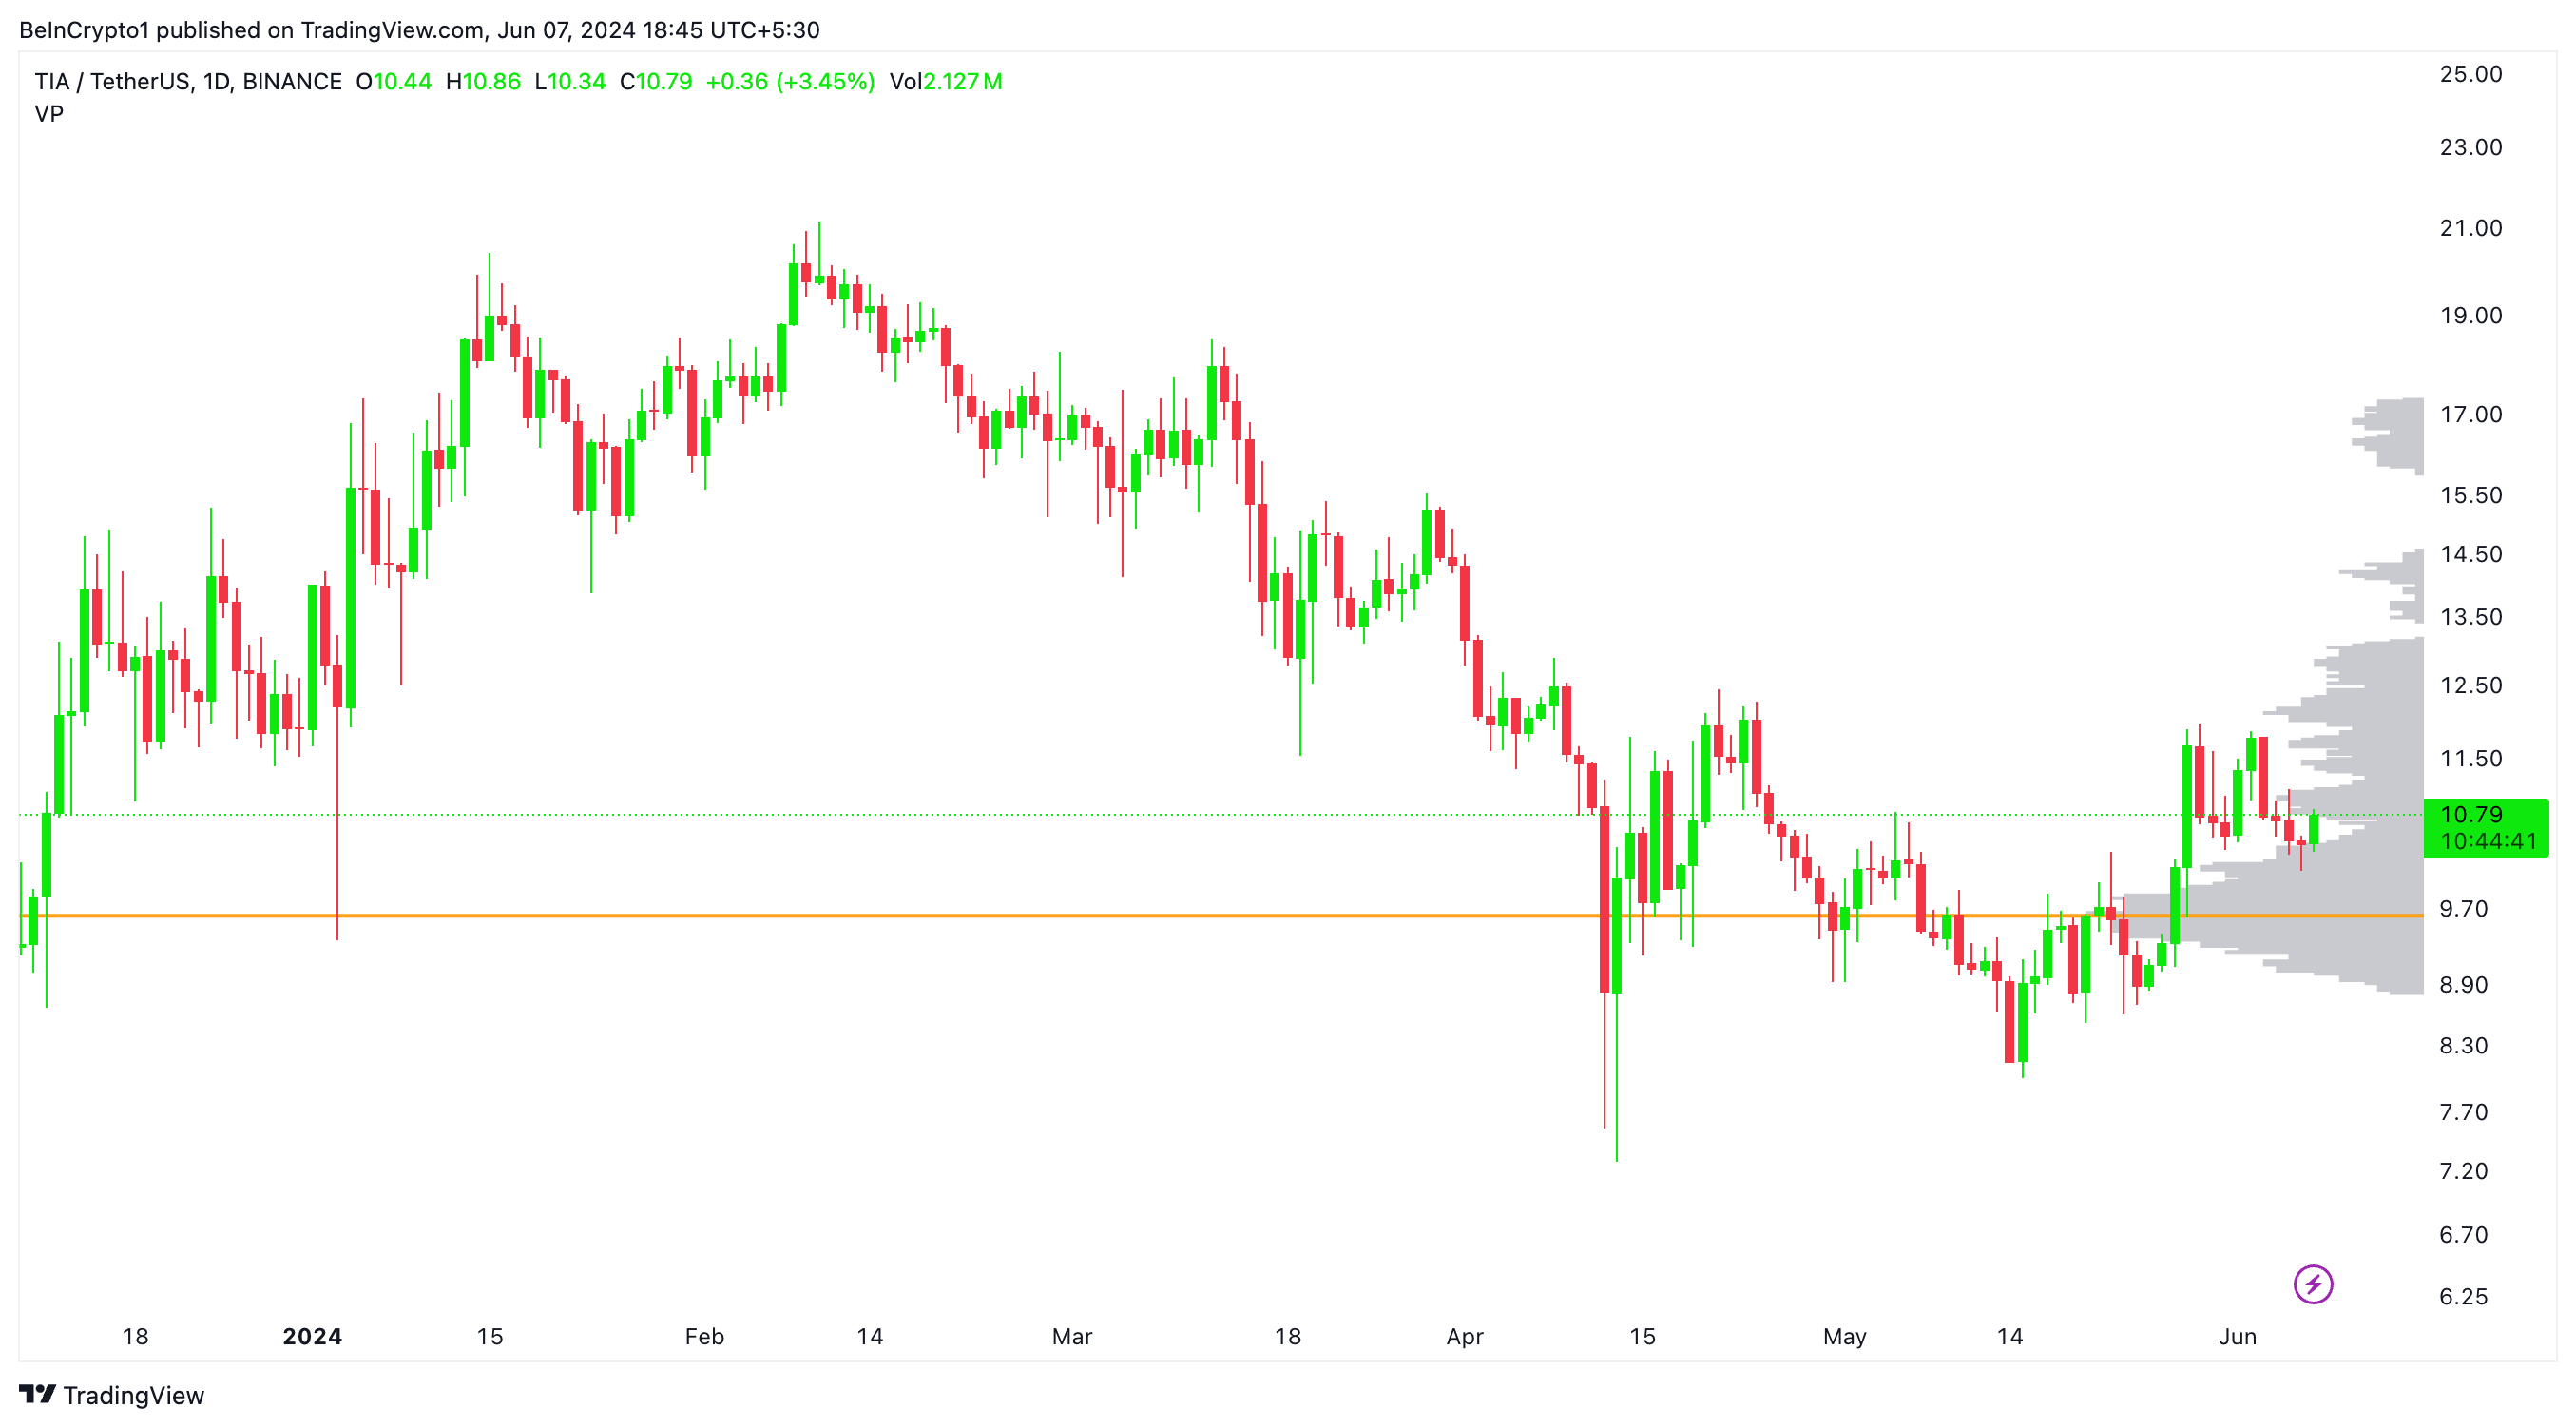
The gaps or lighter areas in the volume profile indicate less trading activity, which, due to lower liquidity, often leads to faster price movements through these levels.
Volume Profile Shows TIA Approaching Low Liquidity Zone
The 4-hour chart indicates a bullish sentiment in the mid-term, with the price finding strong support at the lower boundary of the 4H Ichimoku Cloud.
TIA is currently heading towards the upper boundary of the 4H cloud. However, significant resistance levels are expected at the daily EMA lines depicted in the 1-day chart.
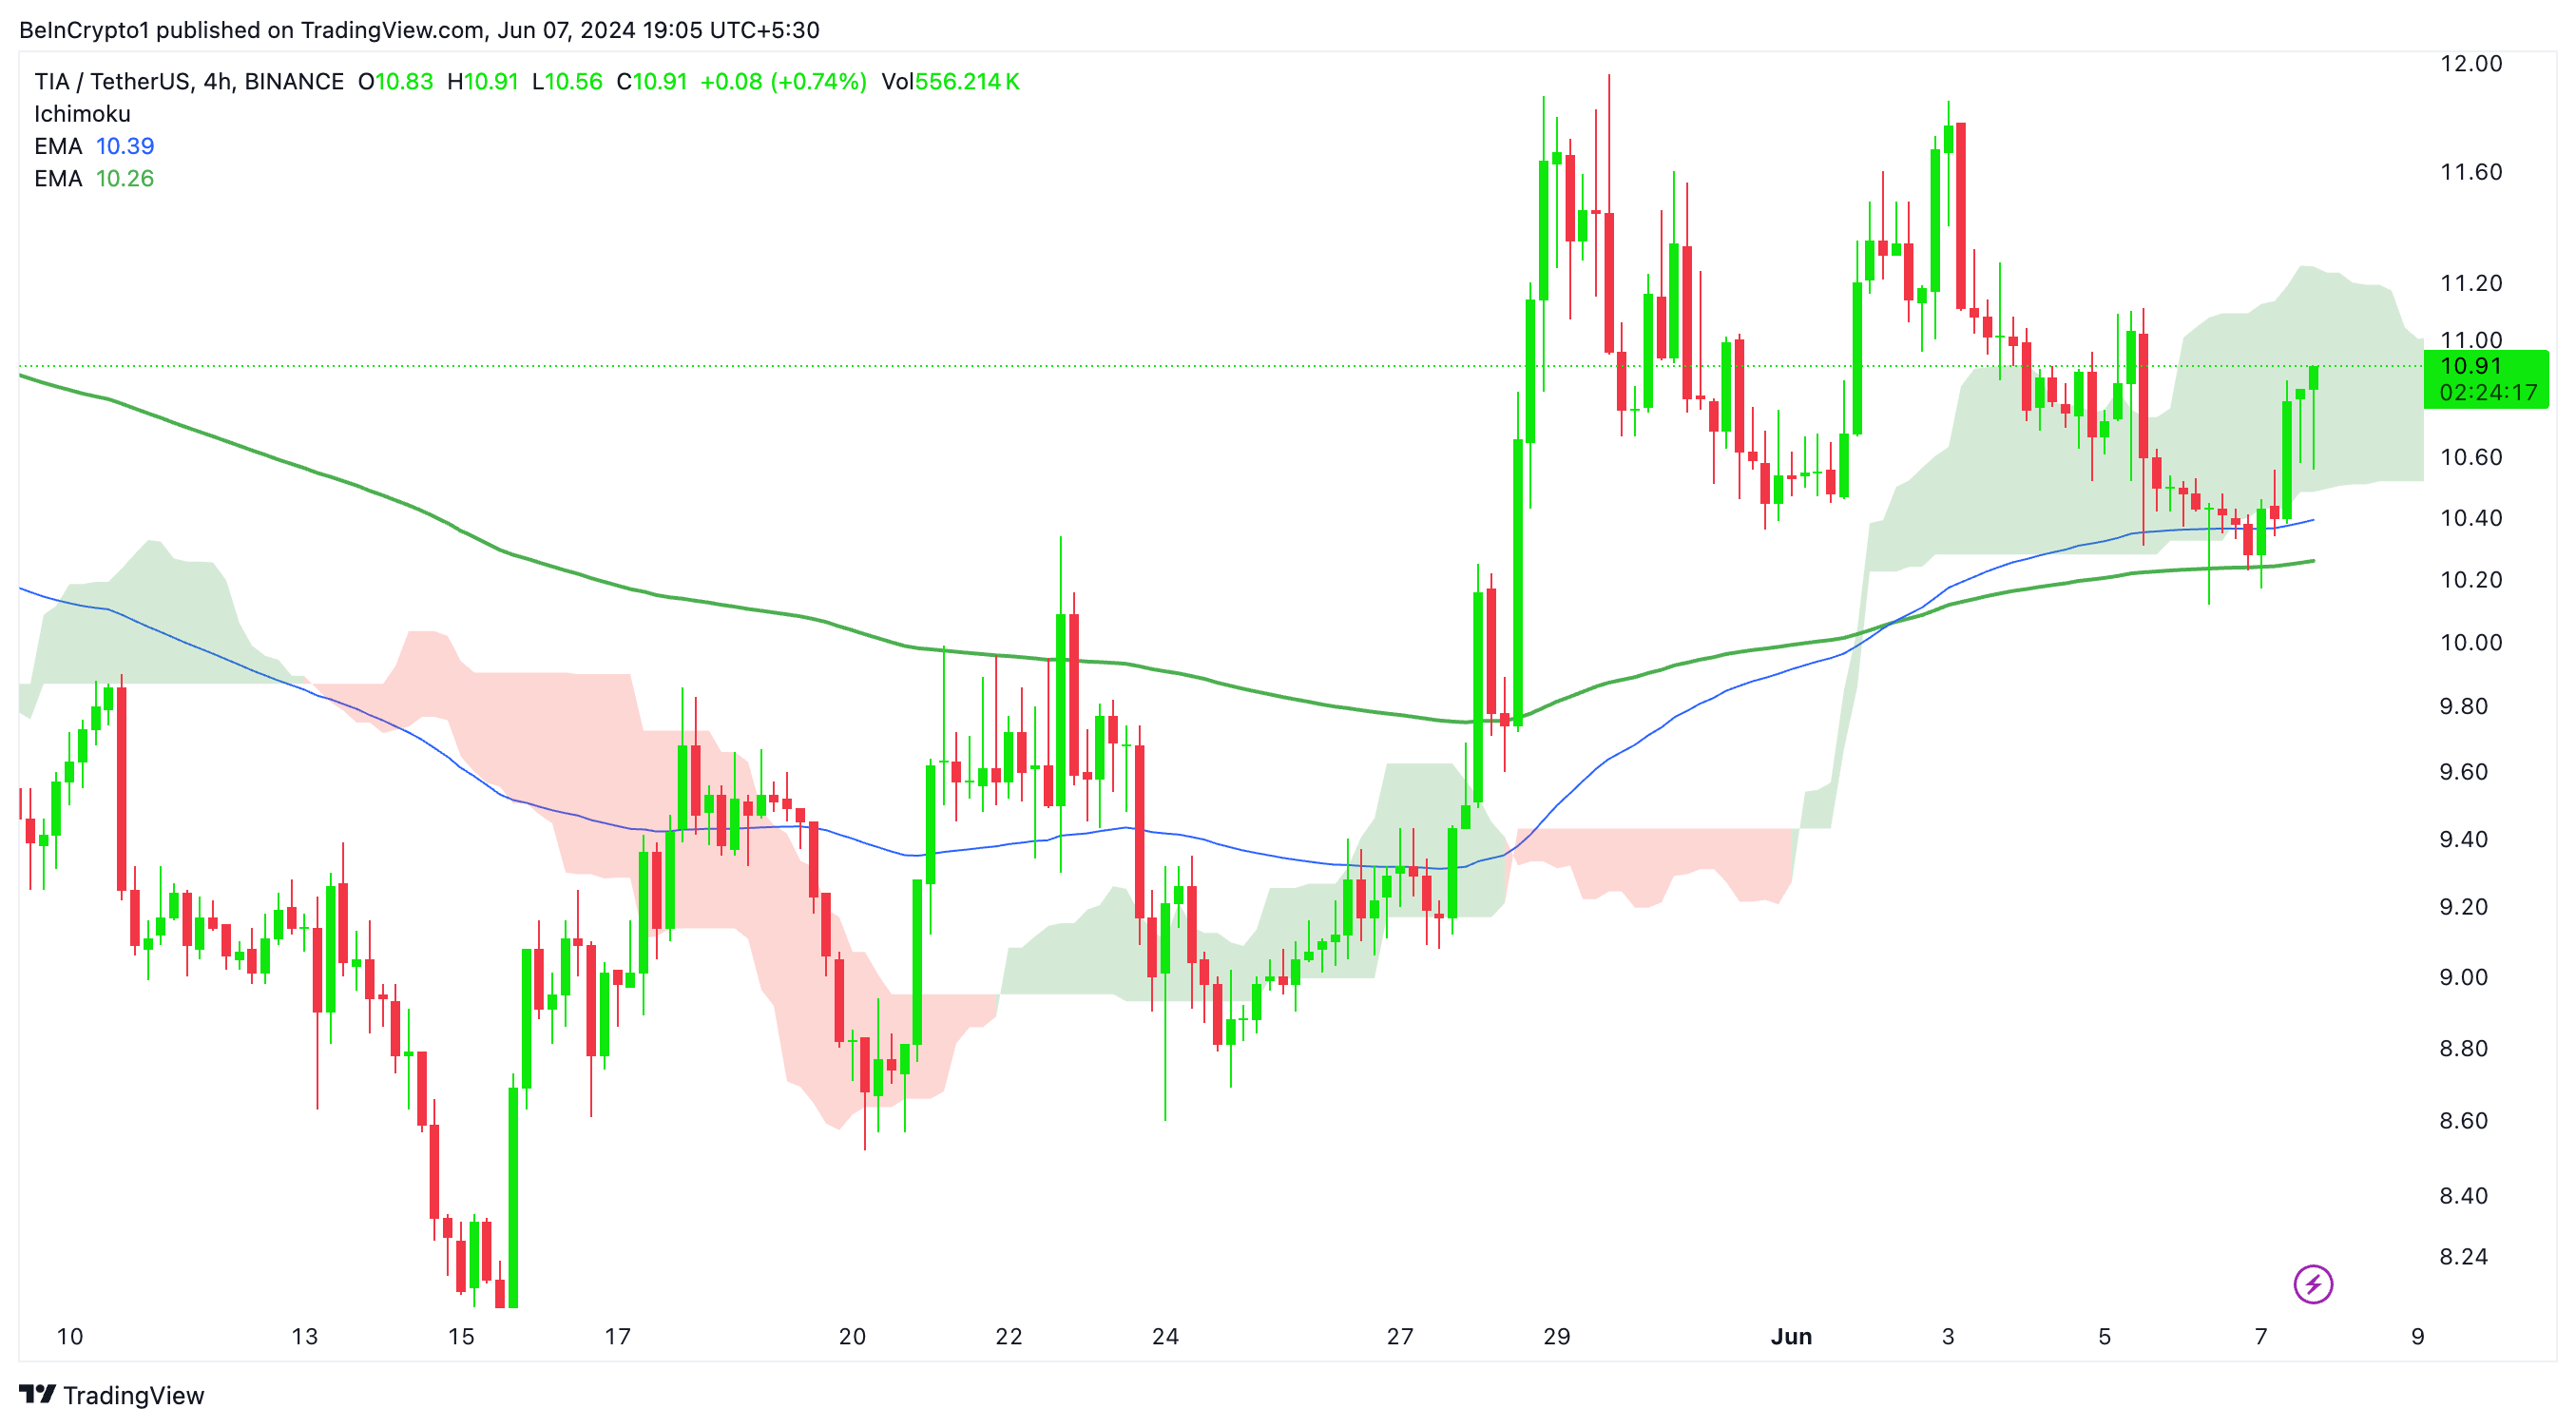
The 4-hour chart indicates a bullish sentiment in the mid-term, with the price finding strong support at the lower boundary of the cloud.
The 4H EMAs are anchored at the lower boundary of the Ichimoku Cloud, providing crucial support levels. It could signal an imminent price drop if the price breaks below these EMAs. Traders should place stop losses wisely below these levels, considering their leverage to manage risk effectively
Volume Profile Indicates TIA Nearing Low Liquidity Zone
The uncolored areas in the volume profile indicate regions with high trading volume. These are critical levels where significant buying and selling have occurred, making them strong support and resistance zones.
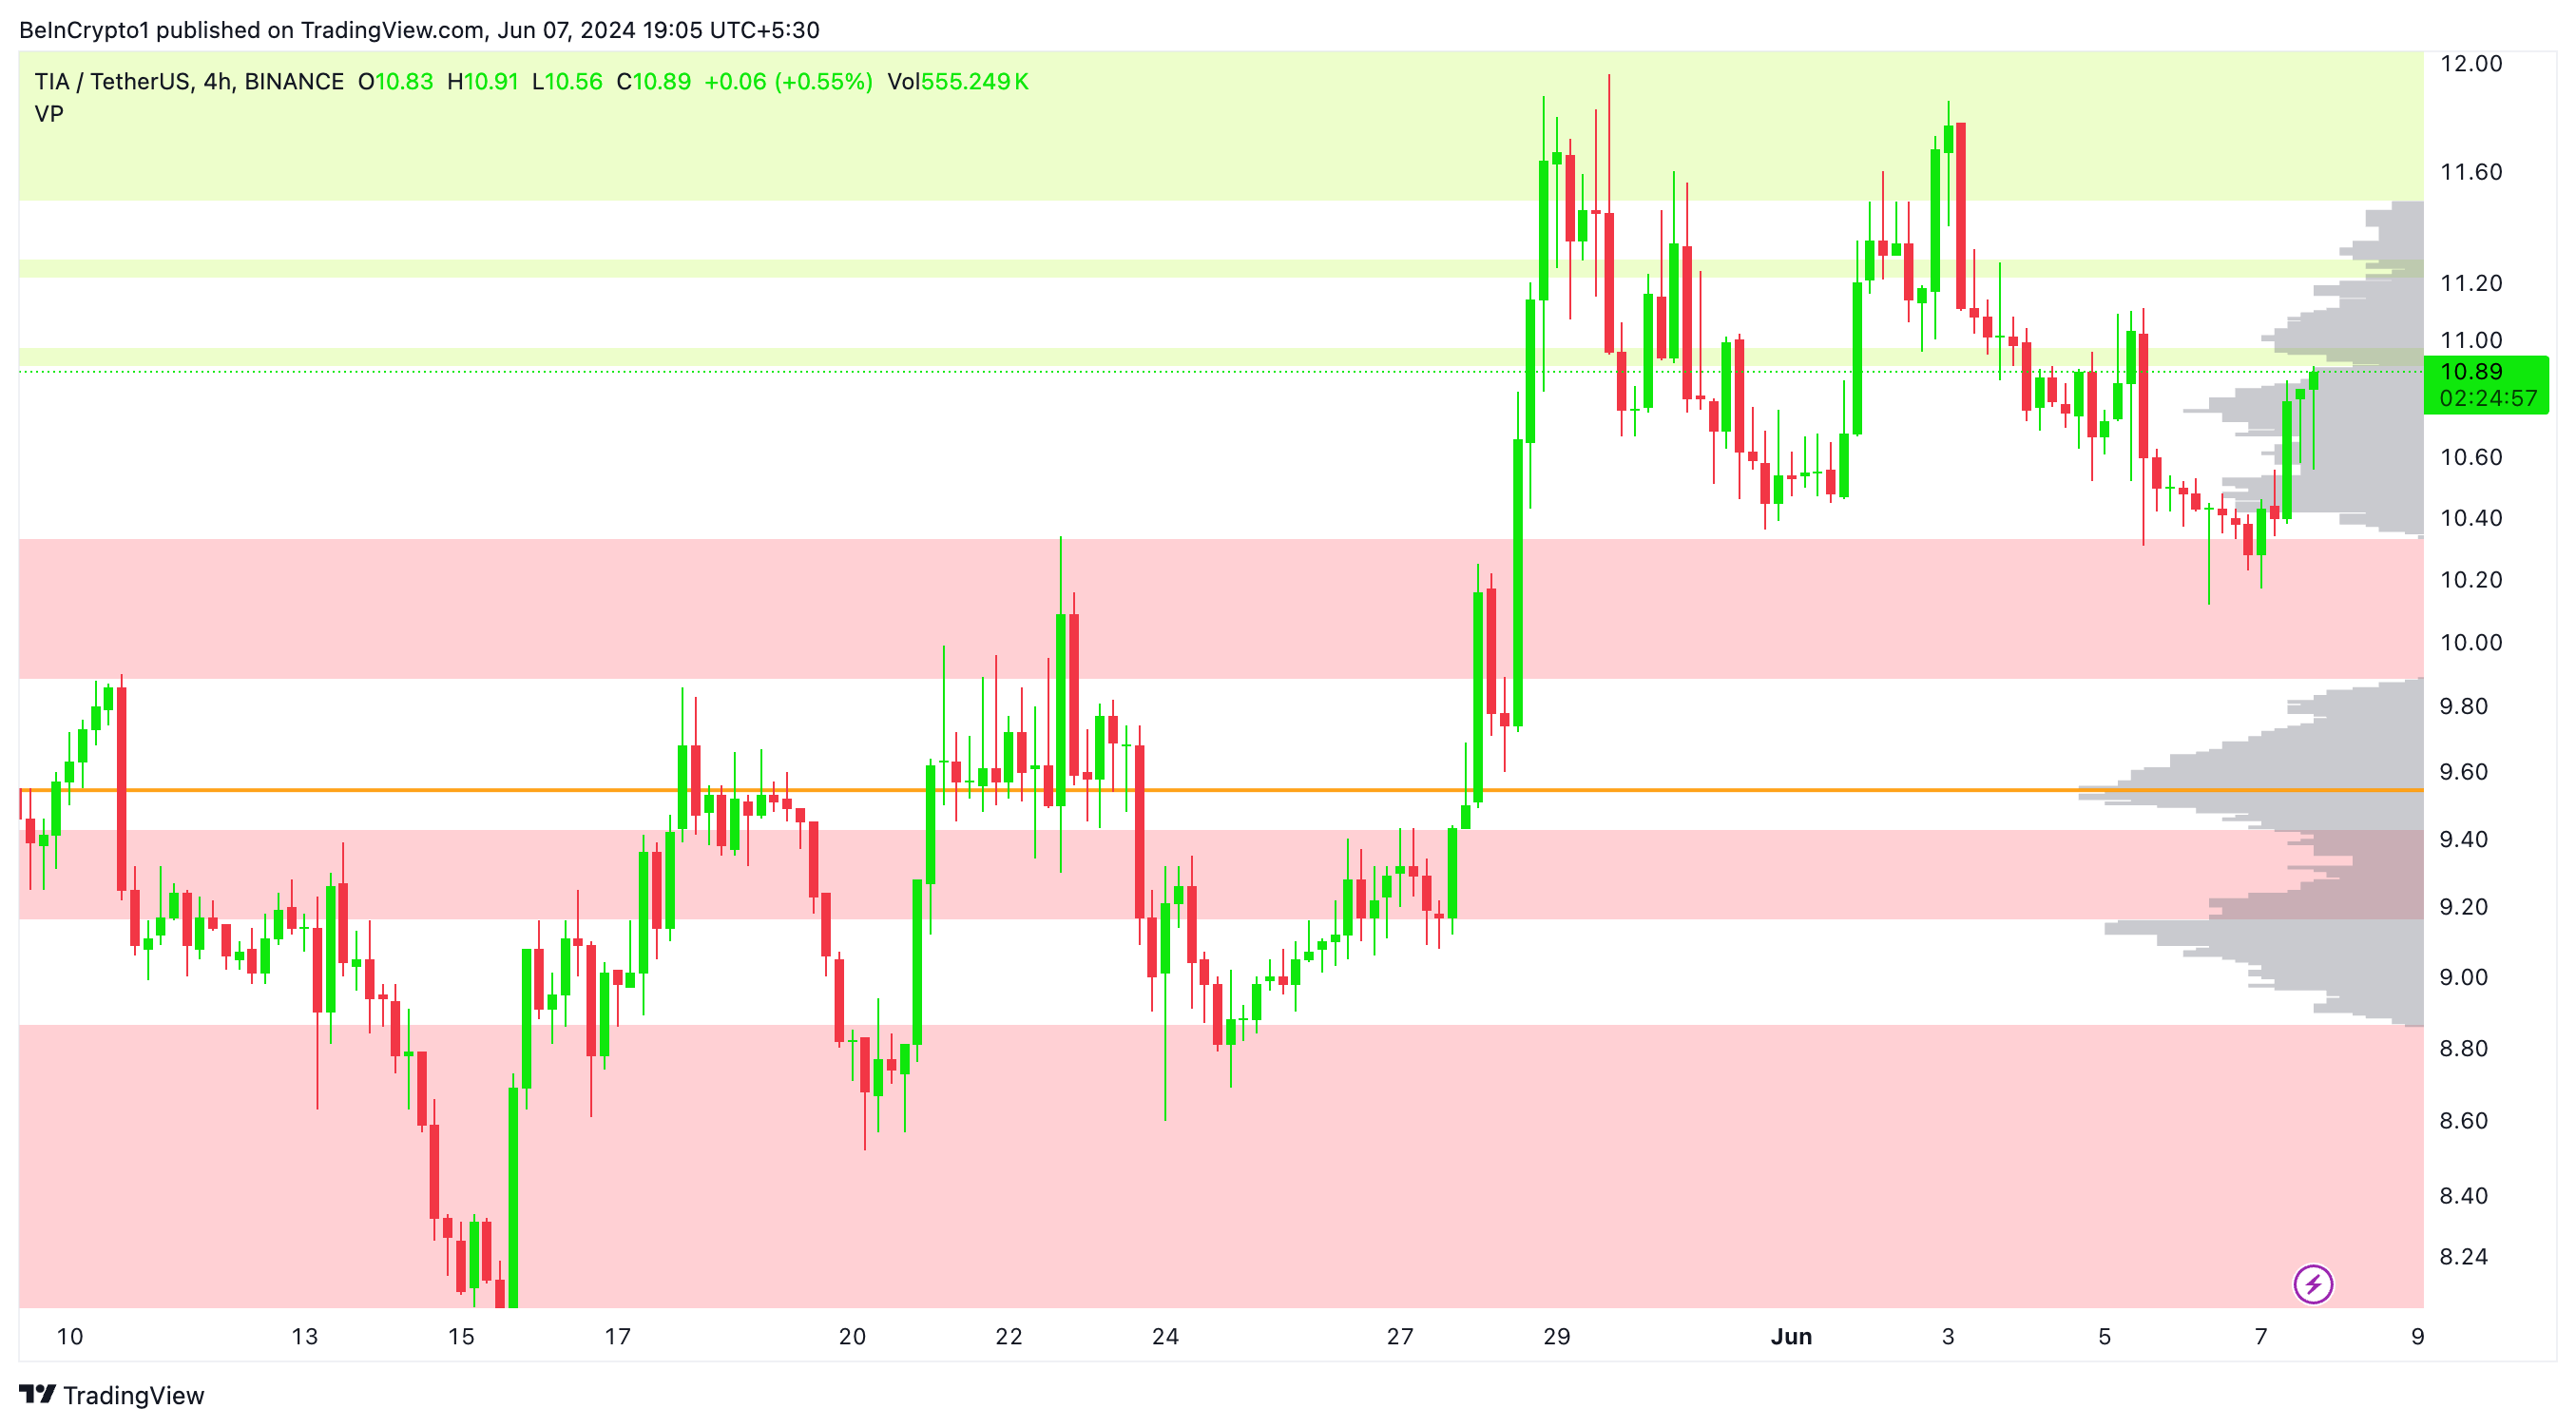
$10.40 – $10.60: This range has witnessed substantial trading activity, suggesting it is a significant support zone. The price recently rebounded from this area, reinforcing its importance.
$11.00 – $11.20: Another high volume area that the price is currently approaching. This zone is likely to act as a formidable resistance level.
The price is approaching a critical zone that could be easily broken due to its low liquidity. The $10.90 to $11.00 range is a crucial area to monitor.
Read More: Top 10 Aspiring Crypto Coins for 2024
A breakout from this zone is likely to propel the price towards exiting the 4-hour Ichimoku Cloud or at least testing its upper boundary.
Strategic Recommendations
The price of Celestia (TIA) faces rejection from the upper boundary of the daily Ichimoku Cloud, indicating resistance. If Bitcoin reaches an all-time high in the mid-term, the upward movement is expected to continue rising to $11.50.
The 100 EMA at $12.03 is also serving as a mid-term resistance level.
The 4-hour chart indicates a bullish sentiment in the mid-term, with the price finding strong support at the lower boundary of the 4-hour Ichimoku Cloud and the 4-hour EMAs.
TIA is heading towards the cloud’s upper boundary, but significant resistance is expected at the daily EMA lines.
Consider placing stop losses just below the 4H EMAs to manage risk effectively. This is particularly important if the price breaks below these EMAs, as it could signal an imminent price drop.
