
Recently, Celestia has undergone substantial price movements, particularly a sharp 20% decline on Friday, June 7.
This drop saw the price exit the 4-hour Ichimoku Cloud to the downside, breaking through both the 100 and 200 EMA lines.
This analysis will explore the critical support and resistance levels on both the 4-hour and 1-hour charts, offering insights into potential future price actions.
4-Hour Chart Analysis
On the 4-hour chart, TIA’s price highlights several important levels. The $8.00 mark stands out as a critical support point, reinforced by significant trading volume, which indicates strong buyer interest.
The volume profile is an essential tool for understanding where the majority of trading activity has taken place. Based on high-volume price areas, traders can identify significant support and resistance levels.
The volume profile shows a significant concentration of trading activity at this price, indicating strong buyer interest. This suggests that many traders consider around $9.00 to be a fair price, providing a solid base for potential upward movements.
The $9.00 level acts as both a support and resistance zone. When the price drops to this level, buyers step in, considering it a good entry point. Conversely, when the price rises to this level, sellers may take a profit, considering it a reasonable exit point.
Read More: Best Upcoming Airdrops in 2024
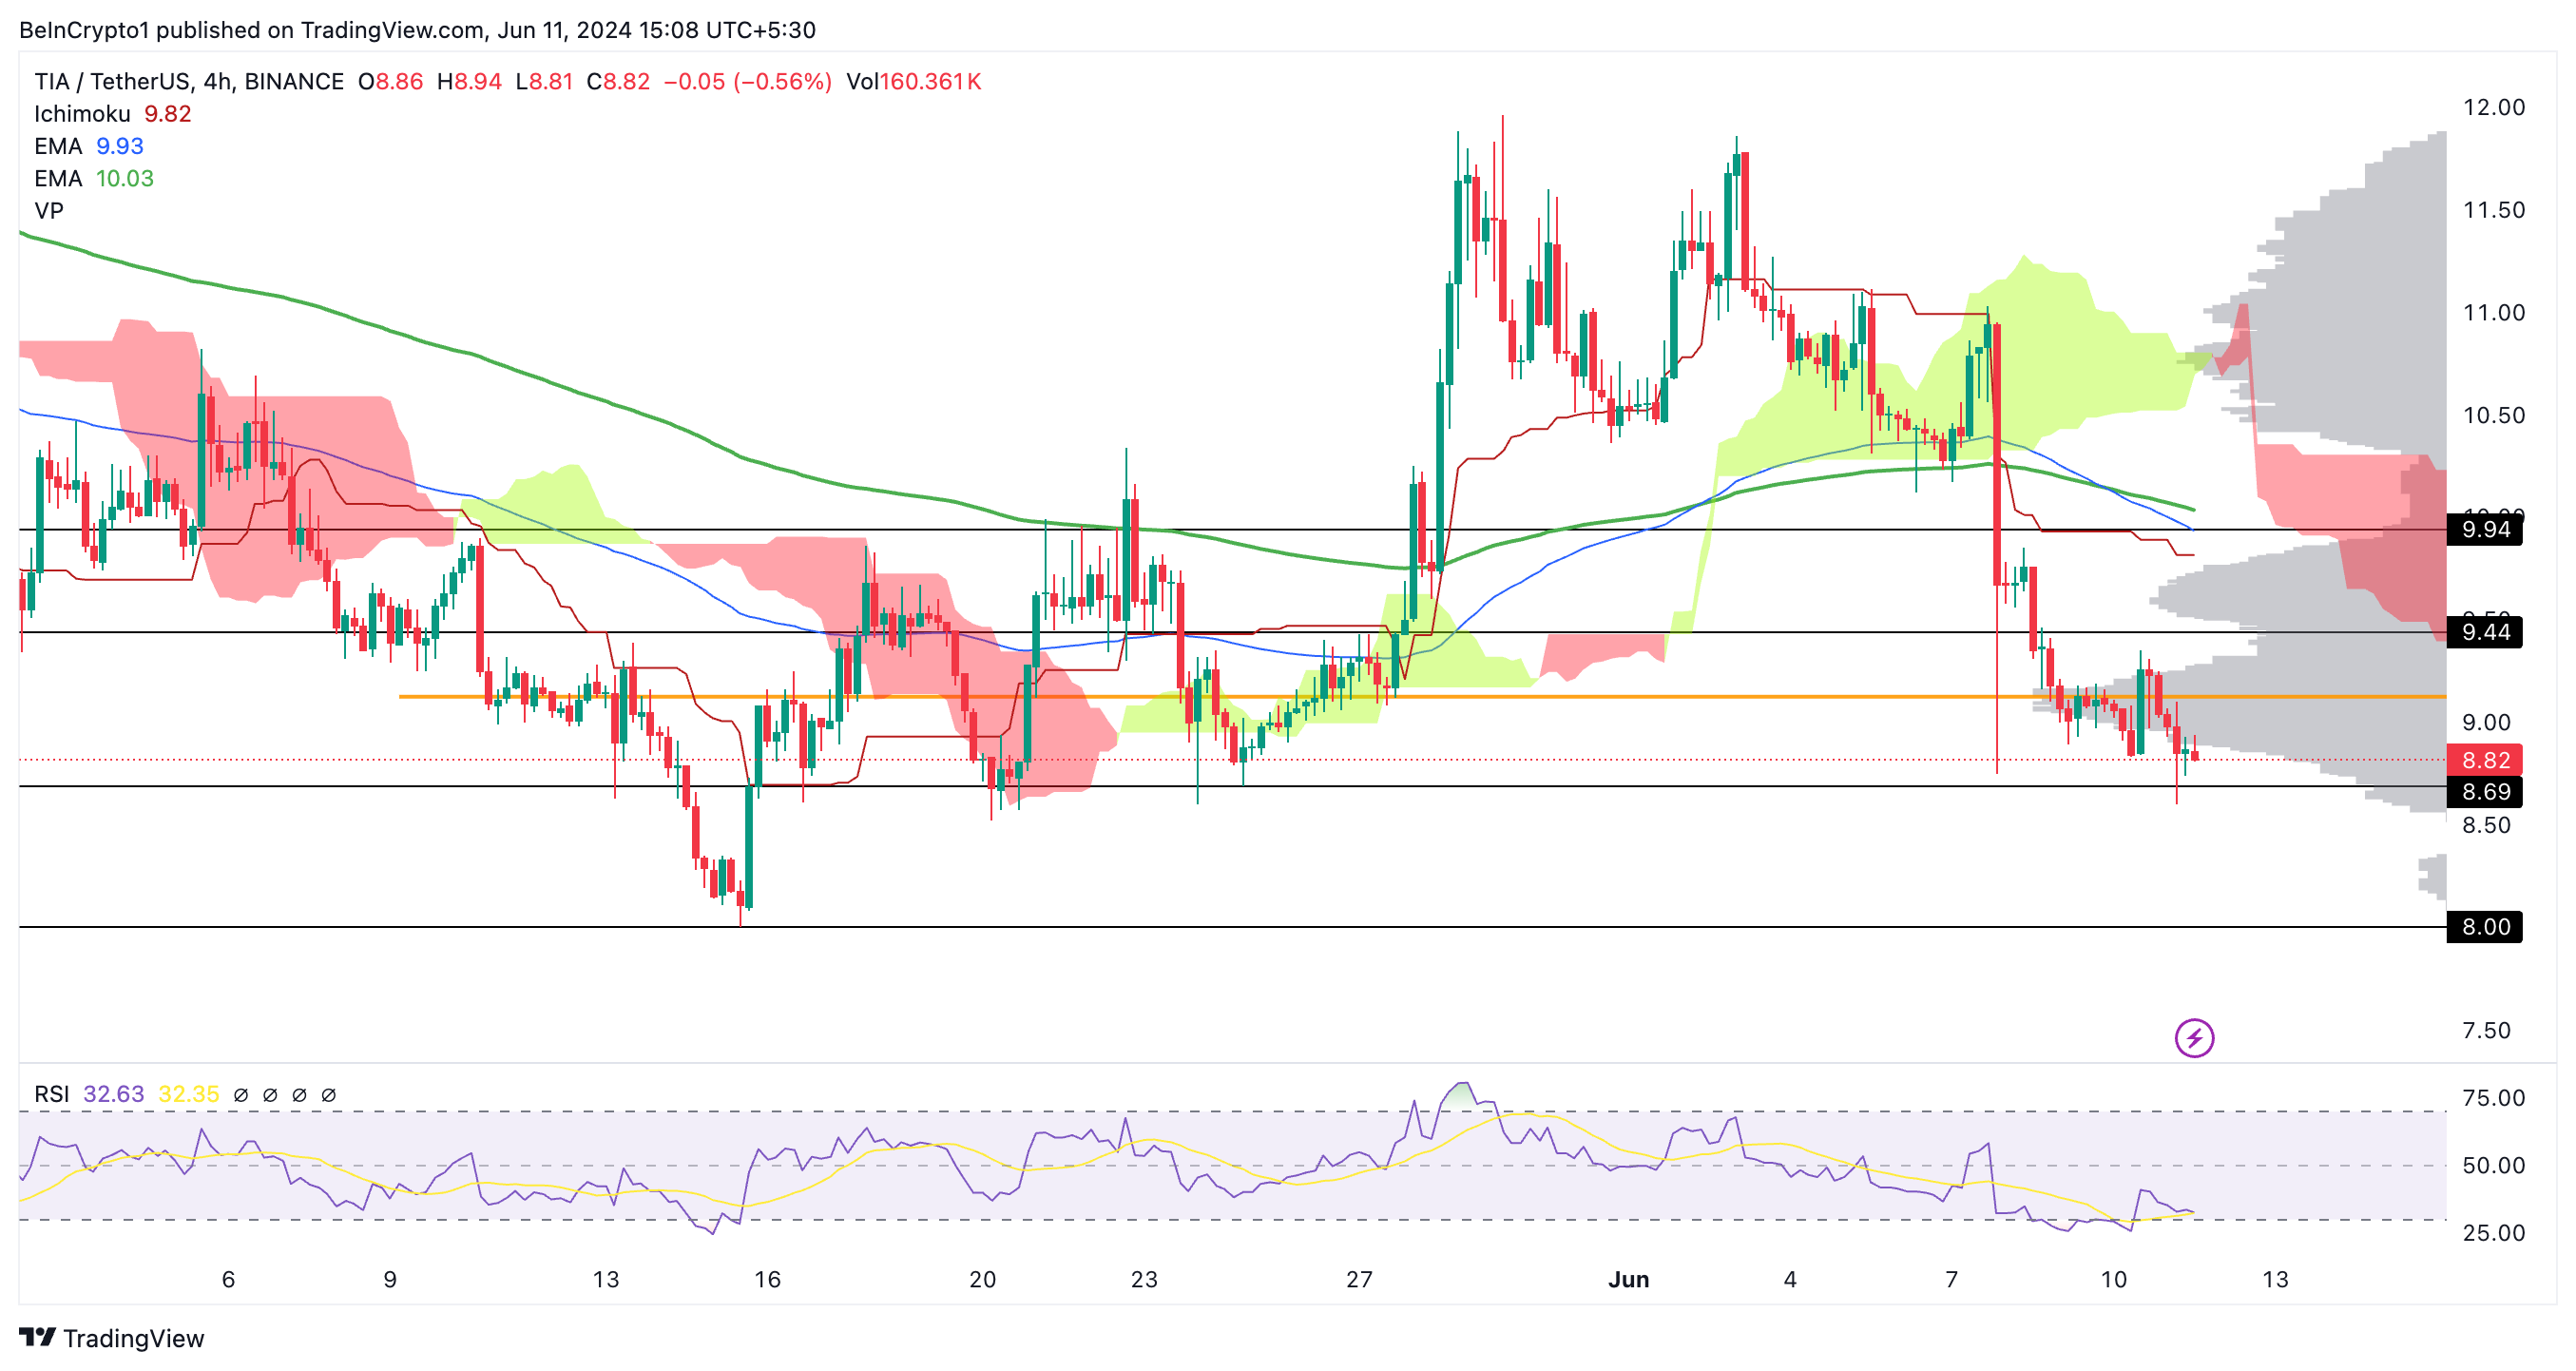
On the resistance side, $9.44 is particularly noteworthy. This level has seen considerable trading activity, suggesting robust seller resistance. Additionally, the $9.94 level marks the upper boundary of the current volume profile range, presenting a formidable resistance point.
This price point has seen considerable trading activity, suggesting strong seller resistance. Additionally, the $9.94 level marks the upper boundary of the current price range, presenting formidable resistance.
1-Hour Chart Analysis
The 1-hour chart offers a closer look at the price movements, especially concerning the Ichimoku Cloud. The price has consistently struggled to break above this cloud, which is a significant resistance area.
This indicates that upward movements are likely to encounter considerable selling pressure.
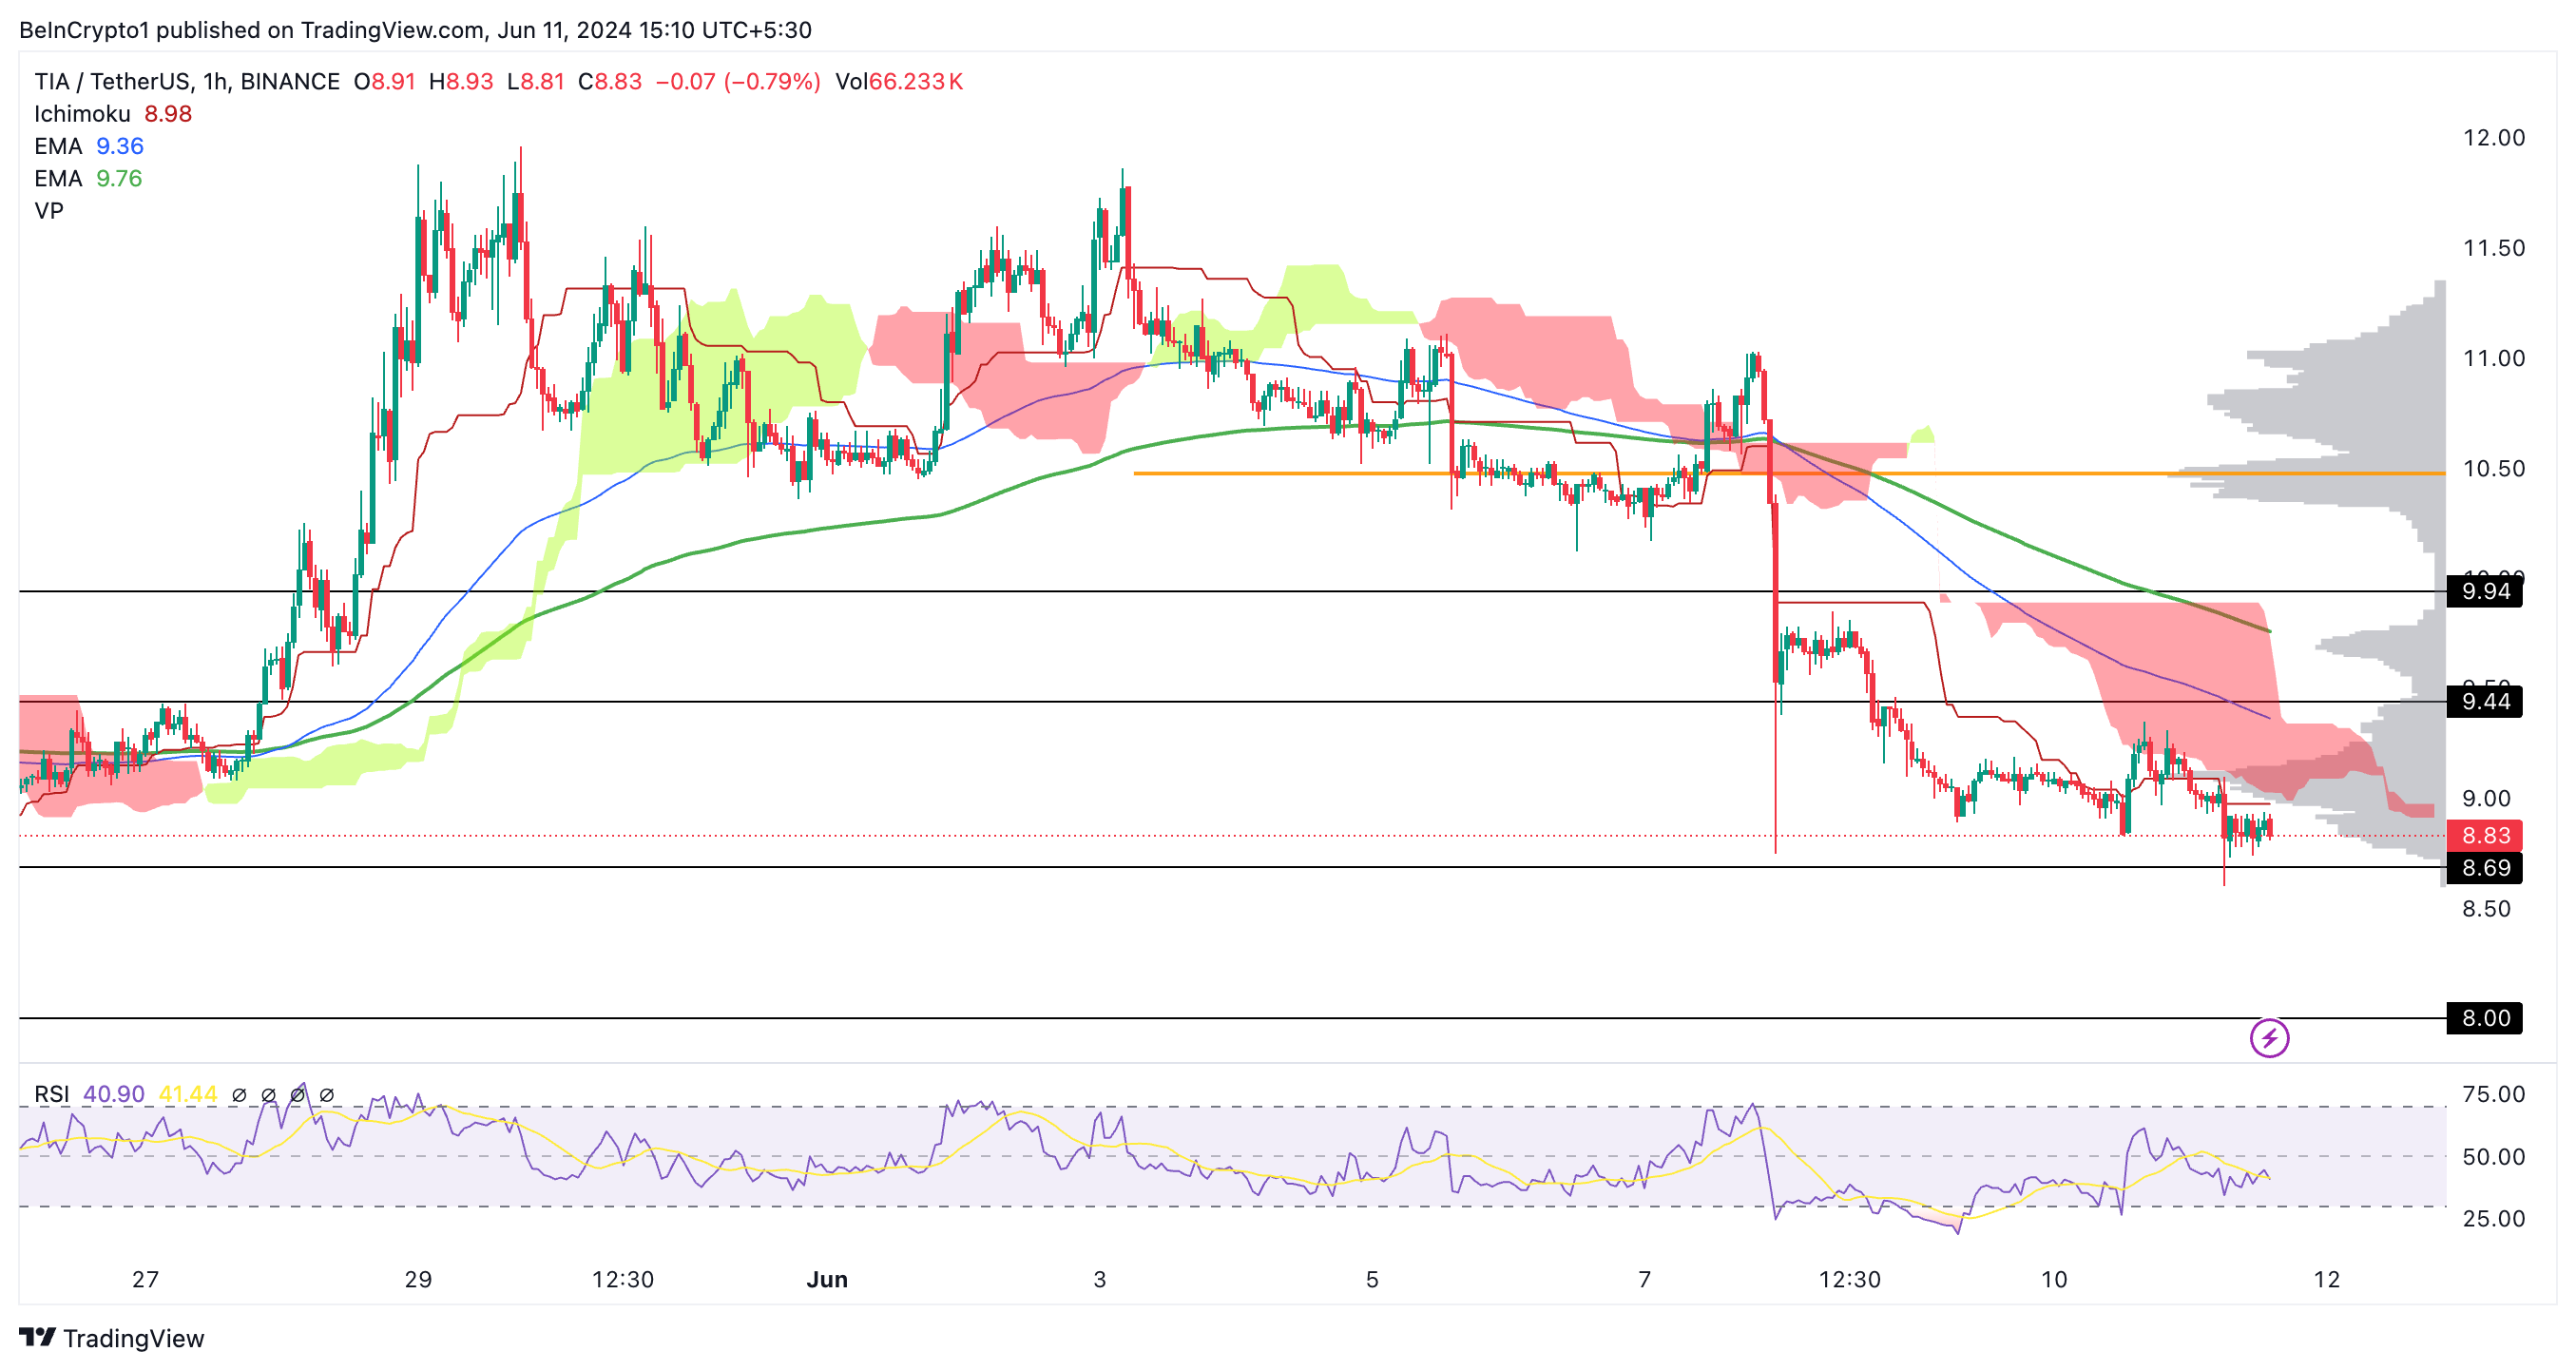
Support levels on the 1-hour chart include $8.69, providing immediate support as evidenced by recent price action.
The $8.00 level also remains significant, bolstered by the volume profile and previous trading activity. As for resistance, $9.44 continues to be a critical level where the price faces persistent difficulty breaking through.
Read More: Top 10 Aspiring Crypto Coins for 2024
Similarly, $9.94 is another strong resistance point, supported by historical price action and trading volume. The 4H-RSI has fallen below 30 and is now recovering to 38, indicating a potential shift in sentiment as the price is considered oversold.
Strategic Recommendations
TIA’s price movement is currently characterized by well-defined support and resistance levels.
The support at $8.00 and $8.69 offers a solid foundation for potential upward trends. Conversely, resistance at $9.44 and $9.94 poses significant obstacles. The 1-hour Ichimoku Cloud adds another layer of resistance, implying that upward movements might face considerable selling pressure.
If TIA’s price can break above the Ichimoku Cloud, it could potentially surge to reach the 100 EMA on the 1-hour chart. Such a breakout would indicate a successful exit from the cloud, signaling a bullish trend. Additionally, the 200 EMA on the hourly chart is another crucial resistance level.
For mid to long-term holders, buying in the $8.90 to $9.00 range could be a wise strategic move, given the current technical indicators and market conditions. Monitoring these key levels closely will be essential to anticipate TIA’s next significant price movement.
