


BeInCrypto takes a look at the eight altcoins that decreased the most over the past seven days, from April 23 to April 30.
These altcoins are:
- Bitcoin Gold (BTG) – 34.58%
- Celsius (CEL) + 5.86%
- Flow (FLOW) + 15.45%
- Digibyte (DGB) + 15.58%
- Stacks (STX) + 15.99%
- Nexo (NEXO) + 16.98%
- Reserve Rights (RSR) + 17.03%
- Bancor (BNT) + 17.07%
BTG
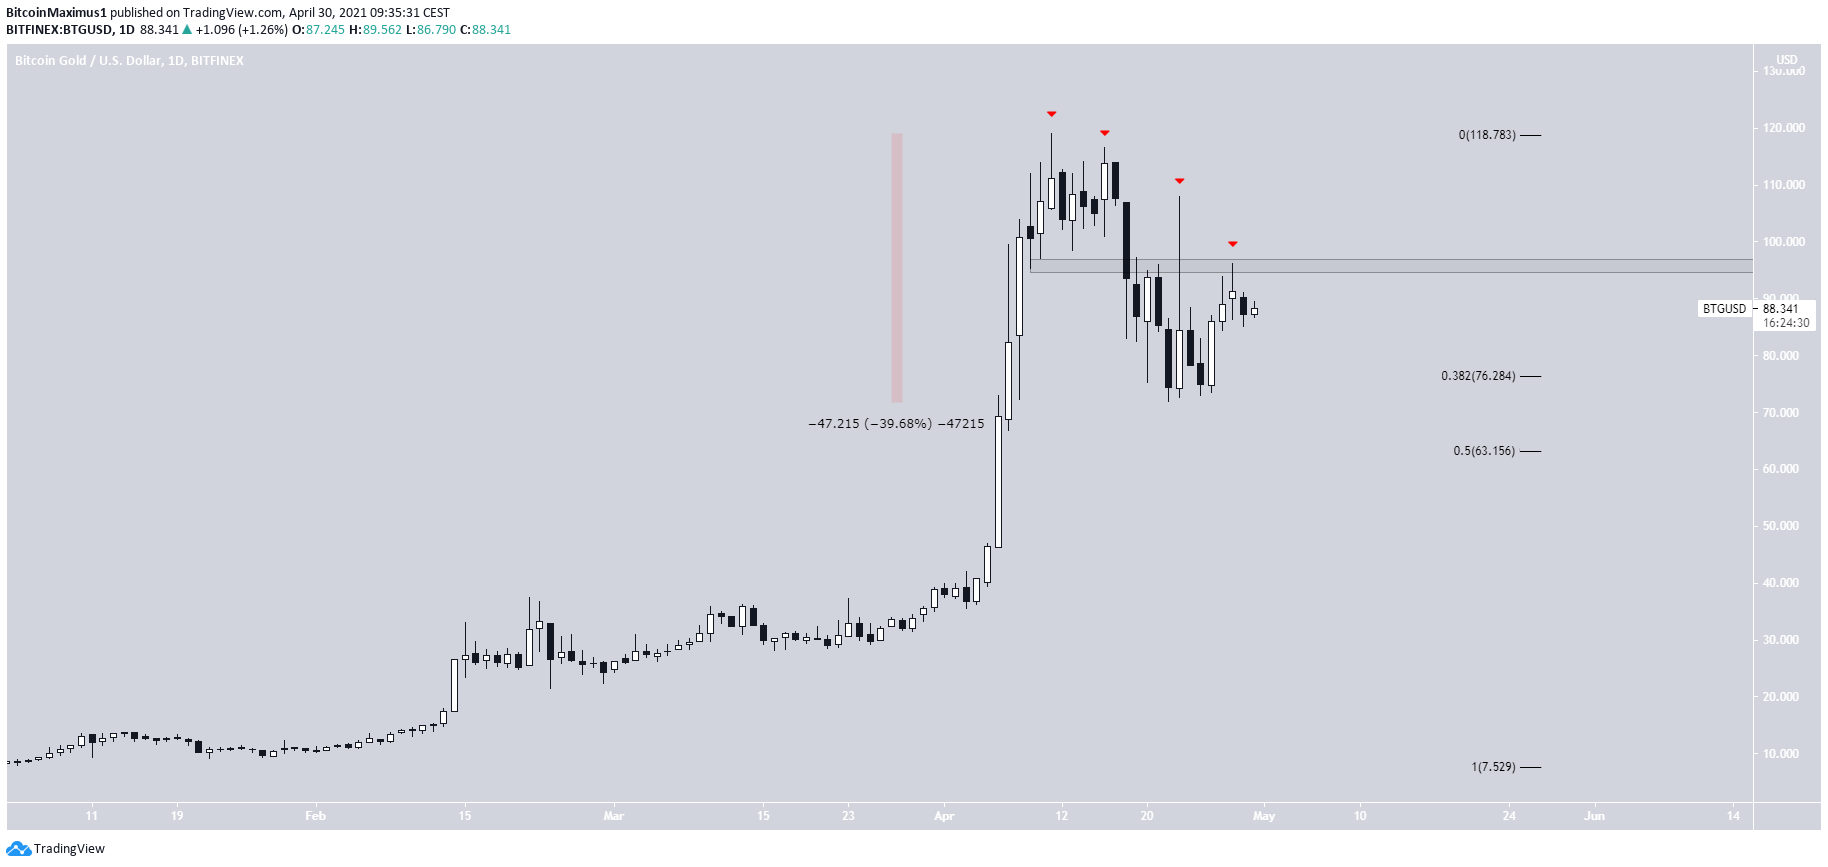
BTG has been moving downwards since April 11, when it attained a high of $119. So far, it has reached a low of $72, bouncing at the 0.382 Fib retracement support level. This amounted to a decrease of 39.50%.
Despite the bounce, there are no clear bullish reversal signs. BTG has created four lower highs so far, most recently being rejected by the $96 resistance area.
Therefore, it is more likely that it continues to decrease towards the 0.5 Fib retracement support at $63.
CEL
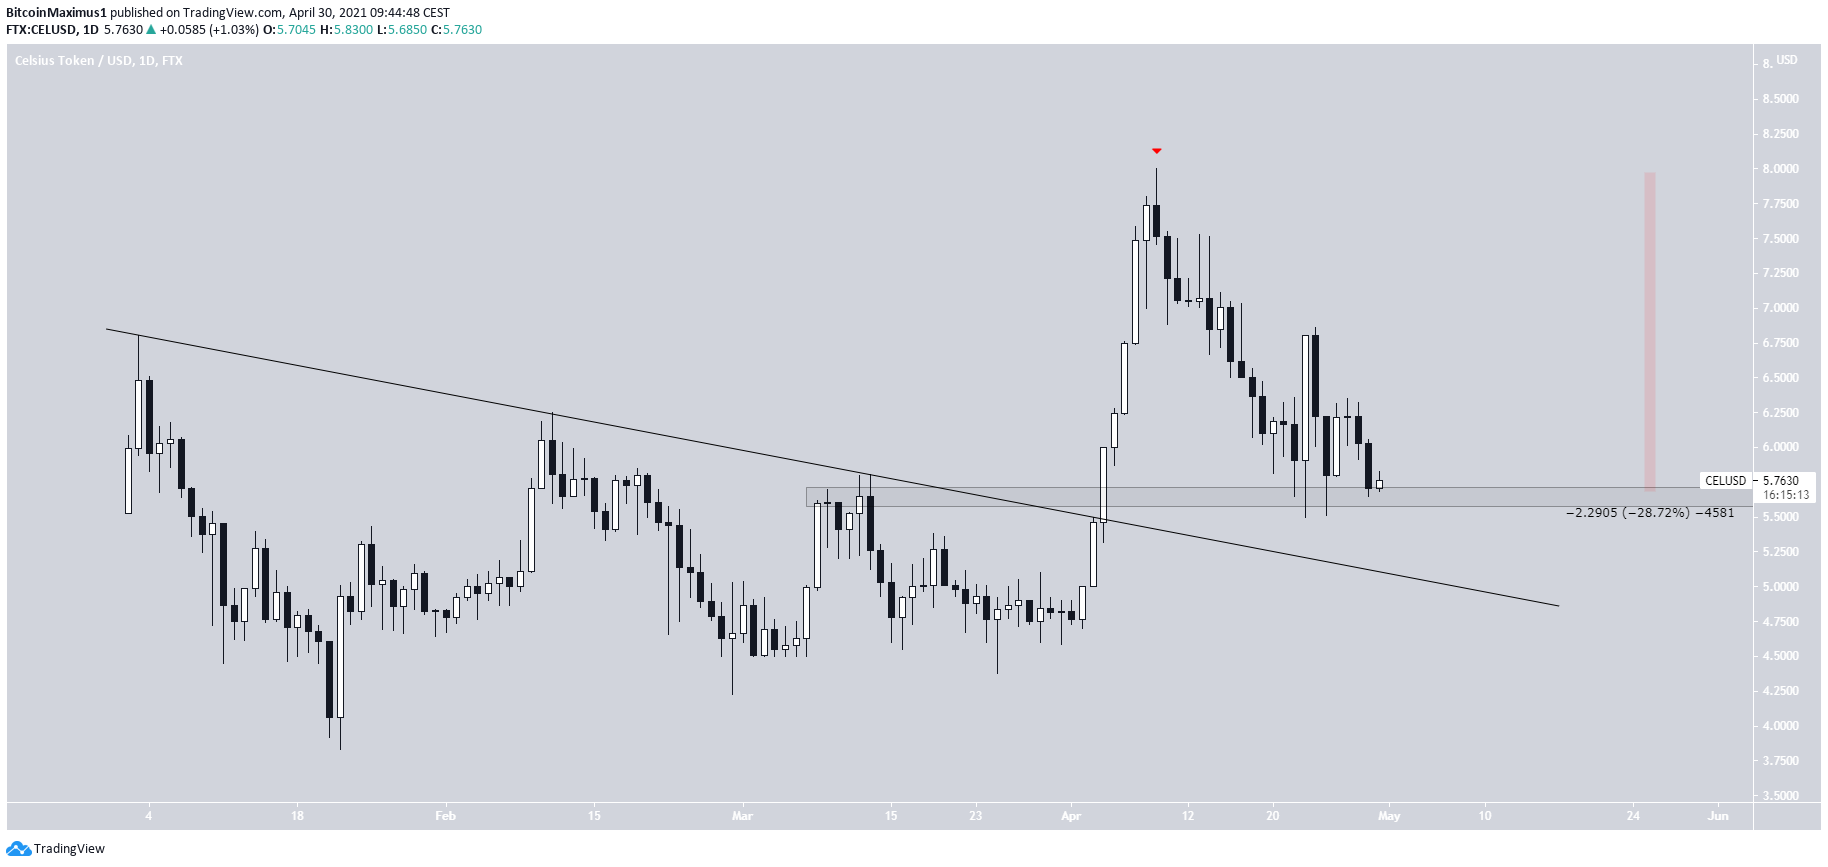
CEL has been moving downwards since it reached a high of $8 on April 9. So far, it has dropped by 28.72%.
While CEL bounced at the $5.60 support area on April 23, it has since returned to the same level once more.
It is possible that CEL returns to validate the previous descending resistance line before moving upwards once more.
FLOW
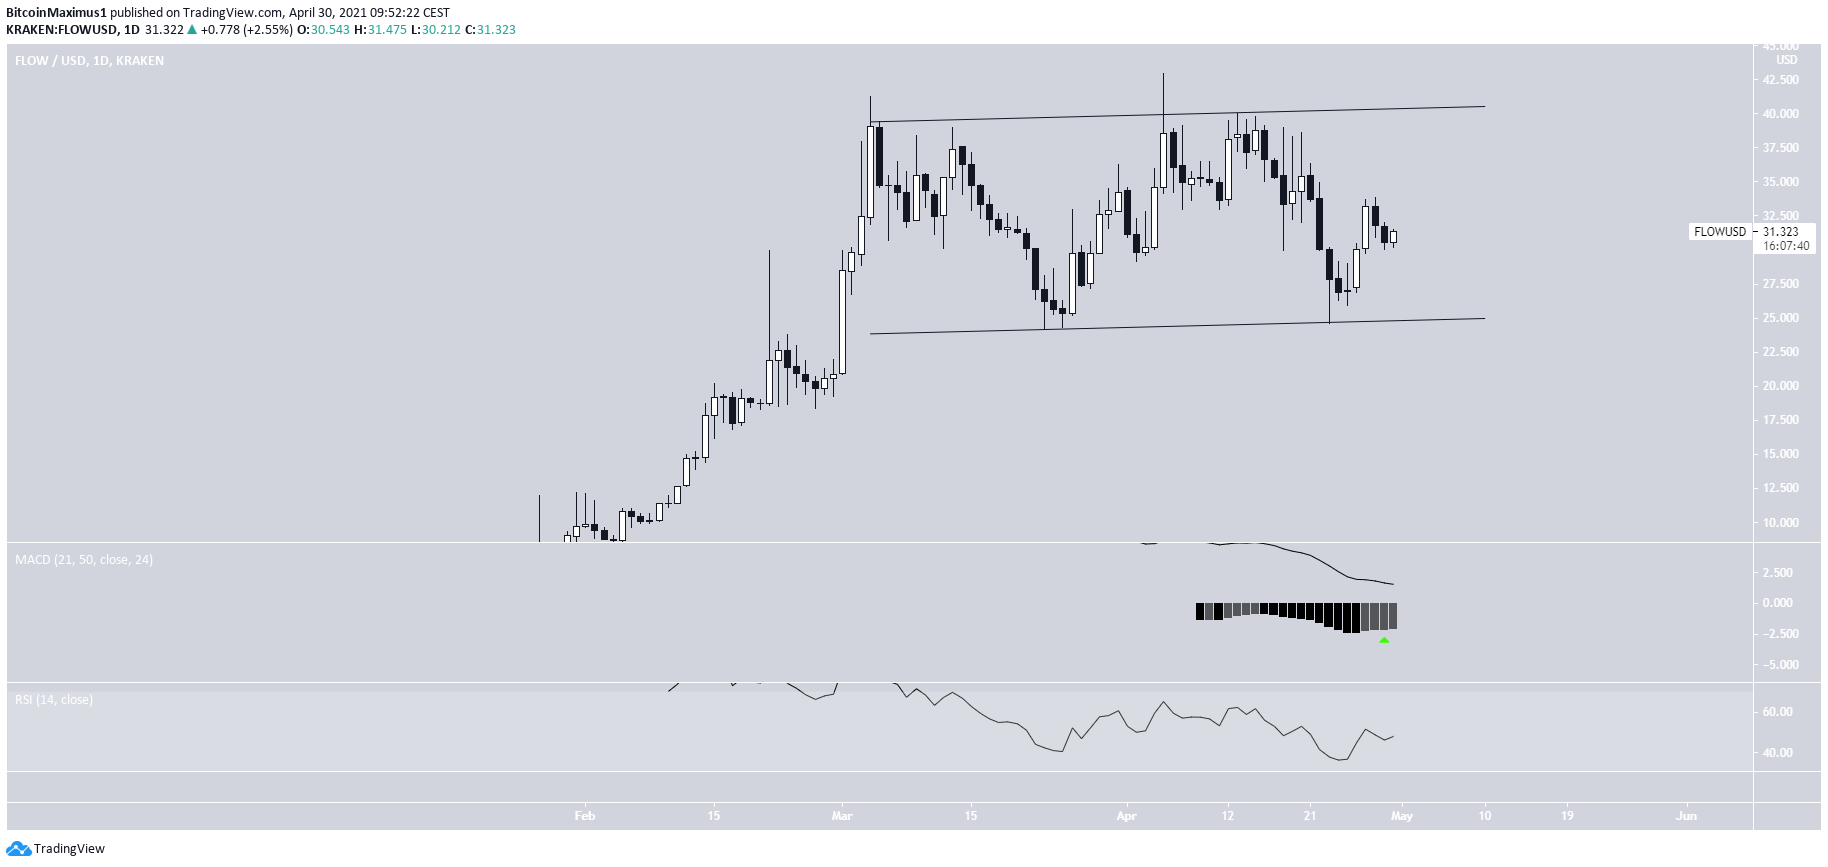
FLOW is trading inside an ascending channel and has been doing so since the beginning of March.
This is often a corrective movement, and it is possible that it is a running flat correction. If so, the April 23 bounce marked the bottom of the correction and FLOW will now move towards the resistance line.
The MACD & RSI are showing bullish signs.
DGB
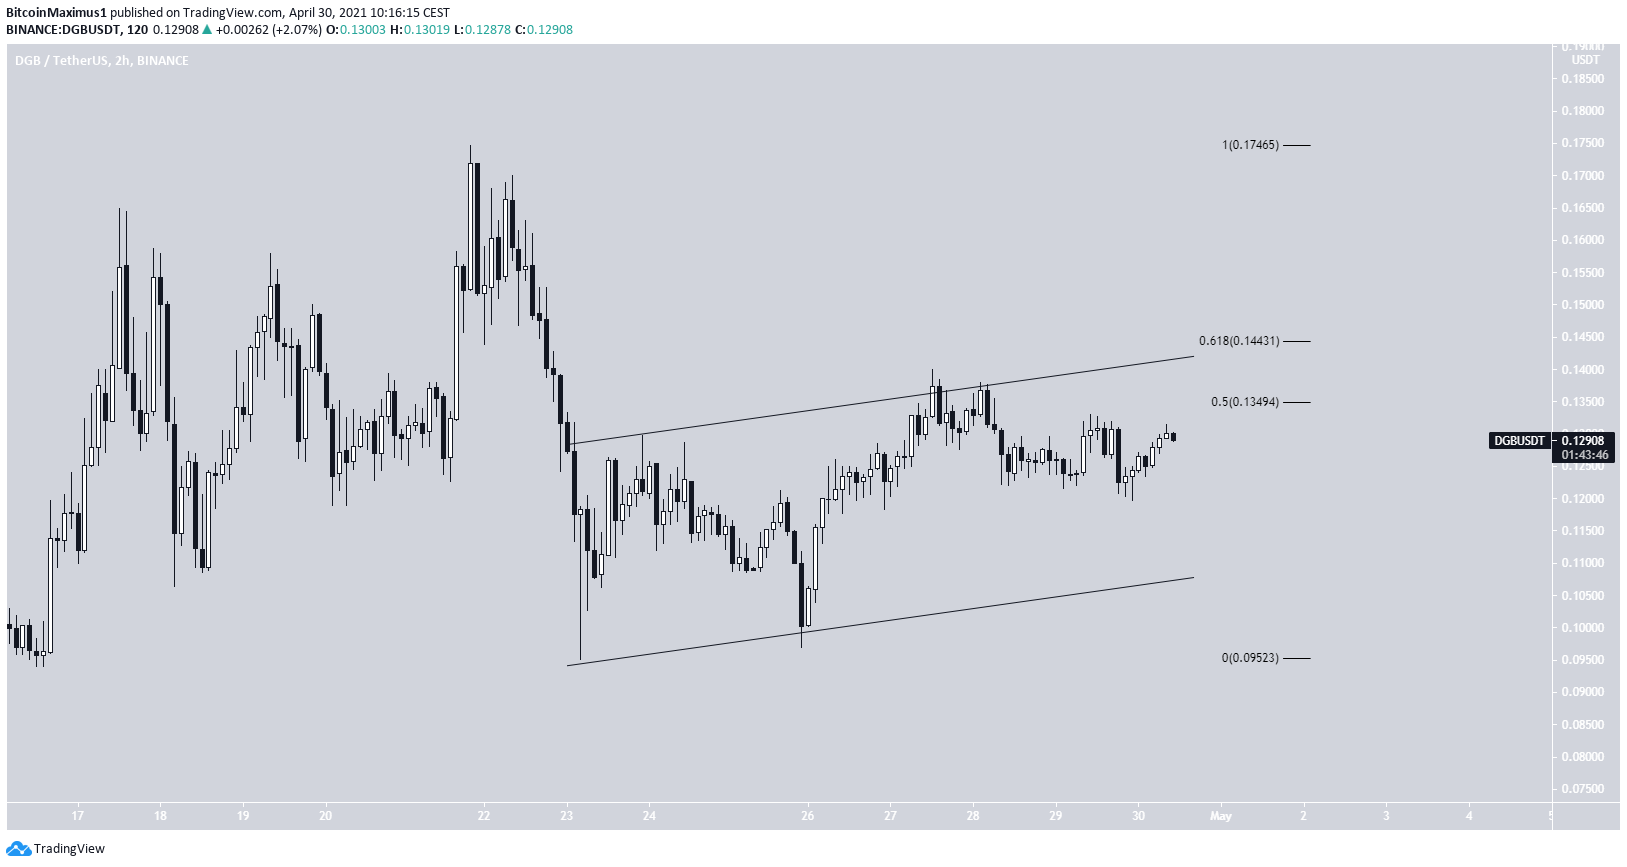
DGB has been moving upwards since bouncing on April 25. However, it was rejected once it reached the 0.5-0.618 Fib retracement resistance levels between $0.134-$0.144.
Furthermore, the upward movement looks very corrective, similar to an A-B-C structure. Therefore, it is possible that DGB will make another low before reversing.
STX
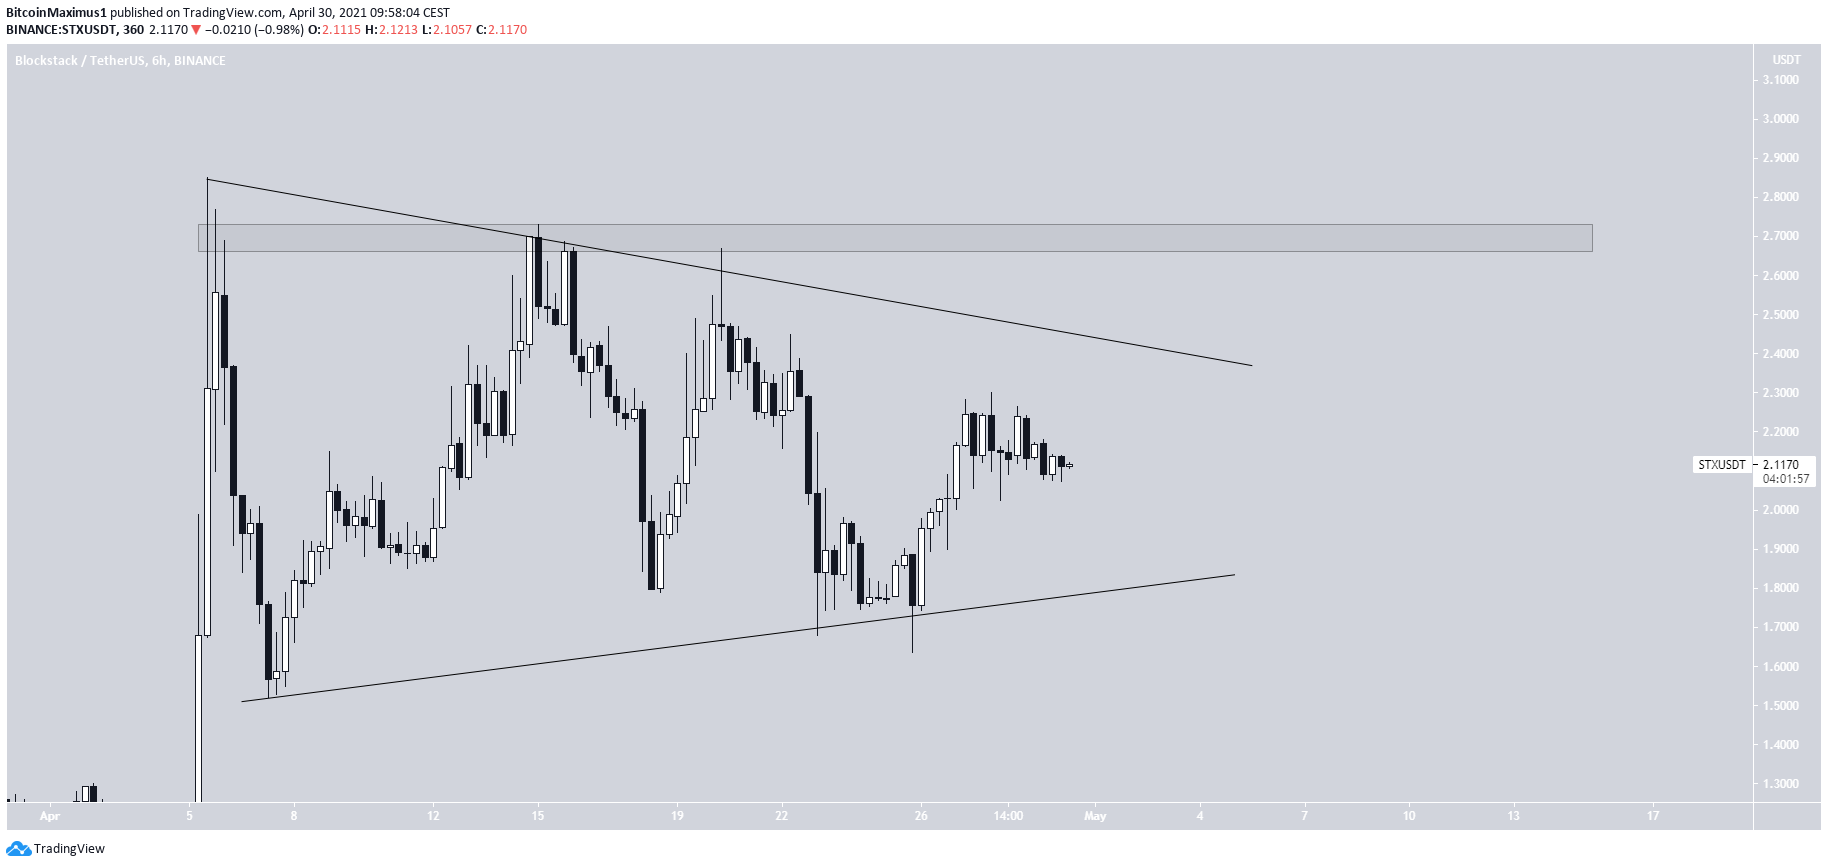
STX has been trading inside a symmetrical triangle since reaching a high of $2.85 on April 5. This is considered a neutral pattern, but a breakout would be more likely since it is transpiring after an upward movement.
STX has been increasing since bouncing on its support line on April 25. A breakout would likely take the token back to the $2.70 resistance area created by the April highs.
NEXO
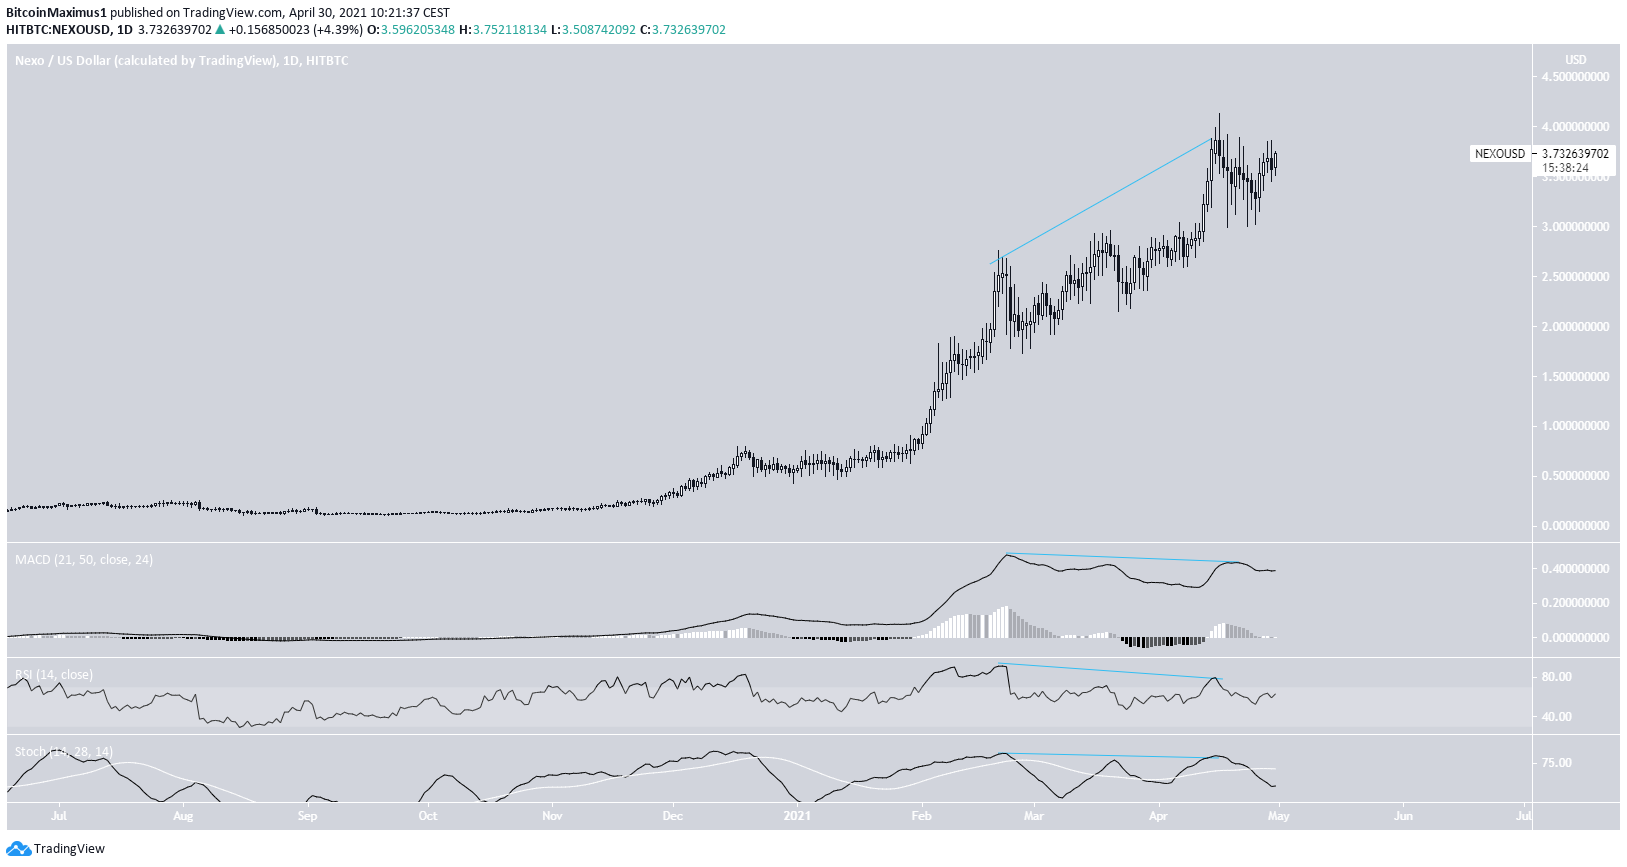
NEXO has been increasing parabolically the entire year. On April 16, it reached an all-time high price of $4.16. It has been moving downwards since.
While it is possible that the parabolic upward continues, there are signs of weakness in the form of bearish divergence in the RSI, MACD & Stochastic Oscillator.
RSR
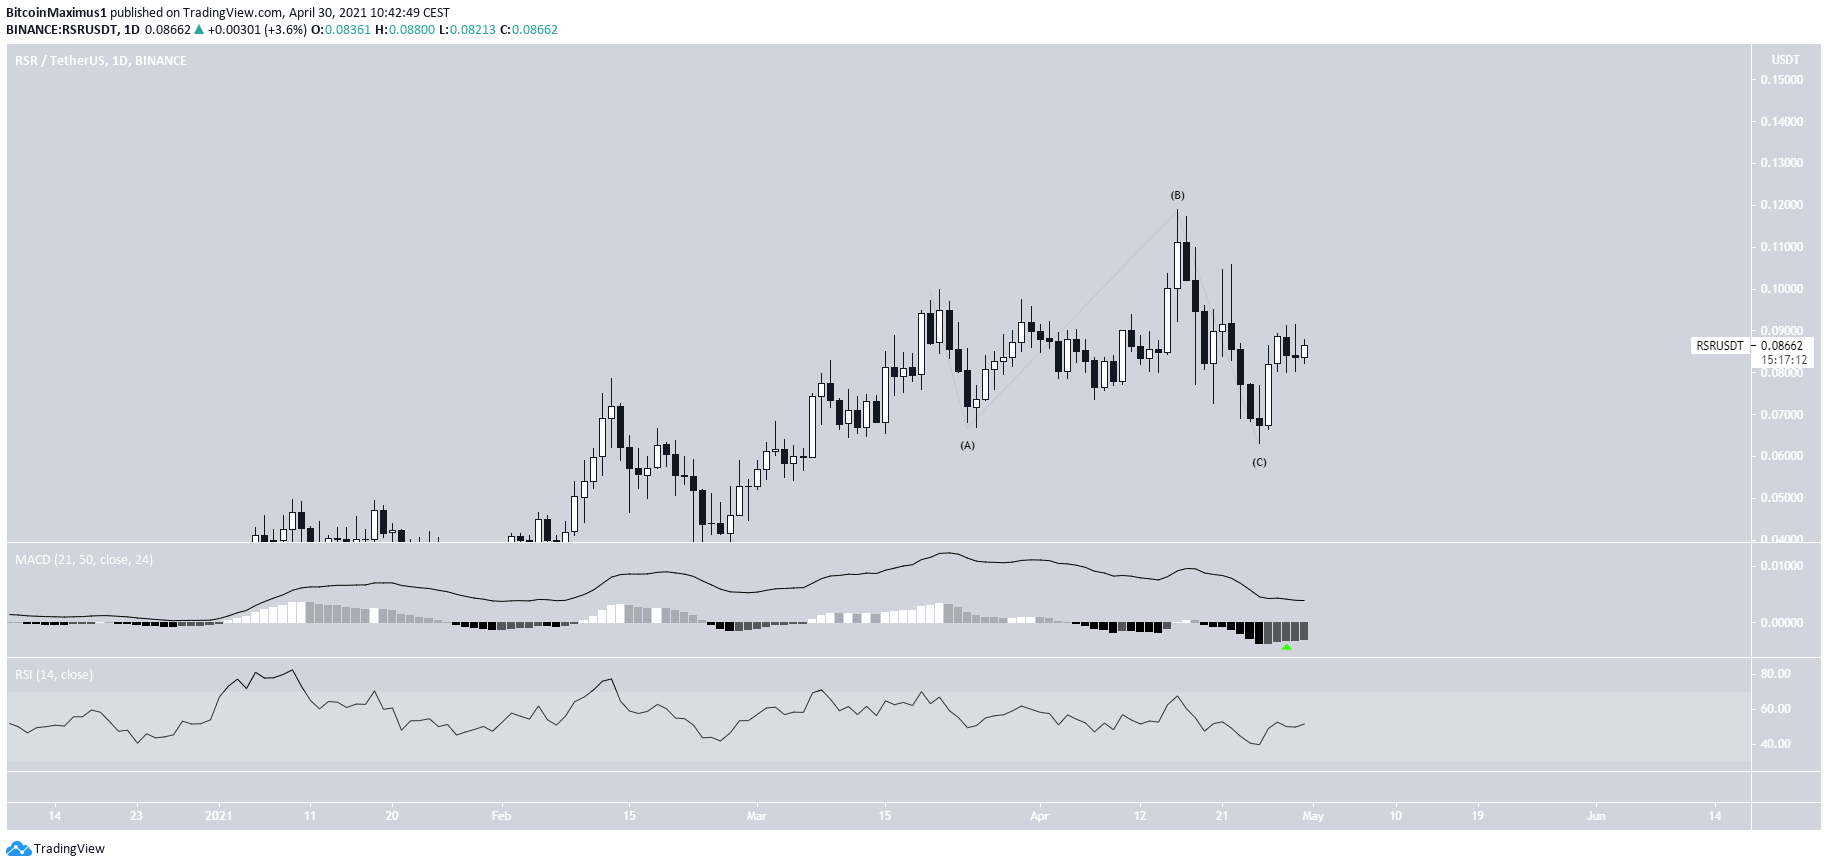
RSR has been decreasing since April 16, when it reached a high of $0.119. The drop continued until April 25. The token has been moving upwards since.
Similarly to FLOW, it is possible that it has completed a running flat correction and will now move upwards. This is also supported by the bullish reversal signal in the MACD.
BNT
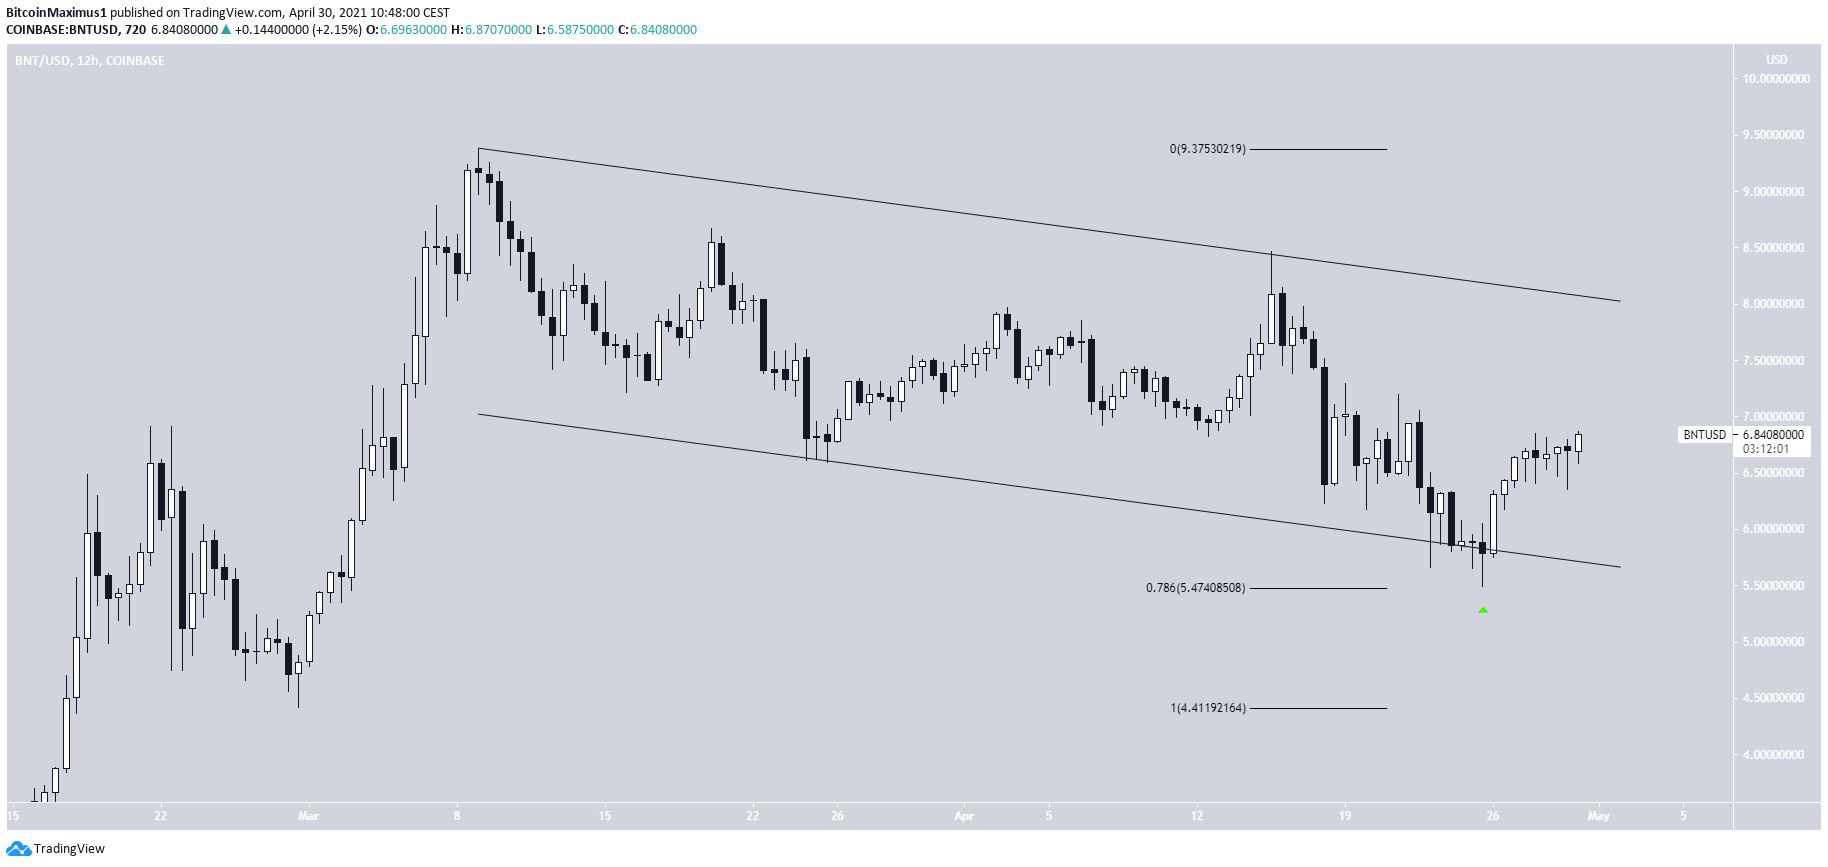
On Feb. 28, BNT began an upward movement that led to an all-time high price of $9.37 being reached on March 9.
It has been retracing since, trading inside a descending parallel channel.
The decrease continued until BNT bounced at the 0.786 Fib retracement support level at $5.47. This also coincides with the support line of the channel. It is possible that this marked the end of the correction.
Currently, the token is moving towards the resistance line of the channel.
For BeInCrypto’s latest bitcoin (BTC) analysis, click here.


