
Cartesi (CTSI) has been trading above the $0.145 horizontal support area since May 12. However, it is at risk of breaking down below it.
CTSI has been falling since reaching an all-time high price of $1.73 in Nov 2021. The downward movement has so far led to a low of $0.127 in May 2022. This amounted to a decrease of 92% from the aforementioned all-time high.
Furthermore, the weekly RSI has fallen below 50 (red icon) and is now in firmly bearish territory.
The main horizontal resistance and support levels are at $0.32 and $0.10, respectively. The latter acted as resistance in Aug. 2020 and is now expected to provide support.

Bearish triangle
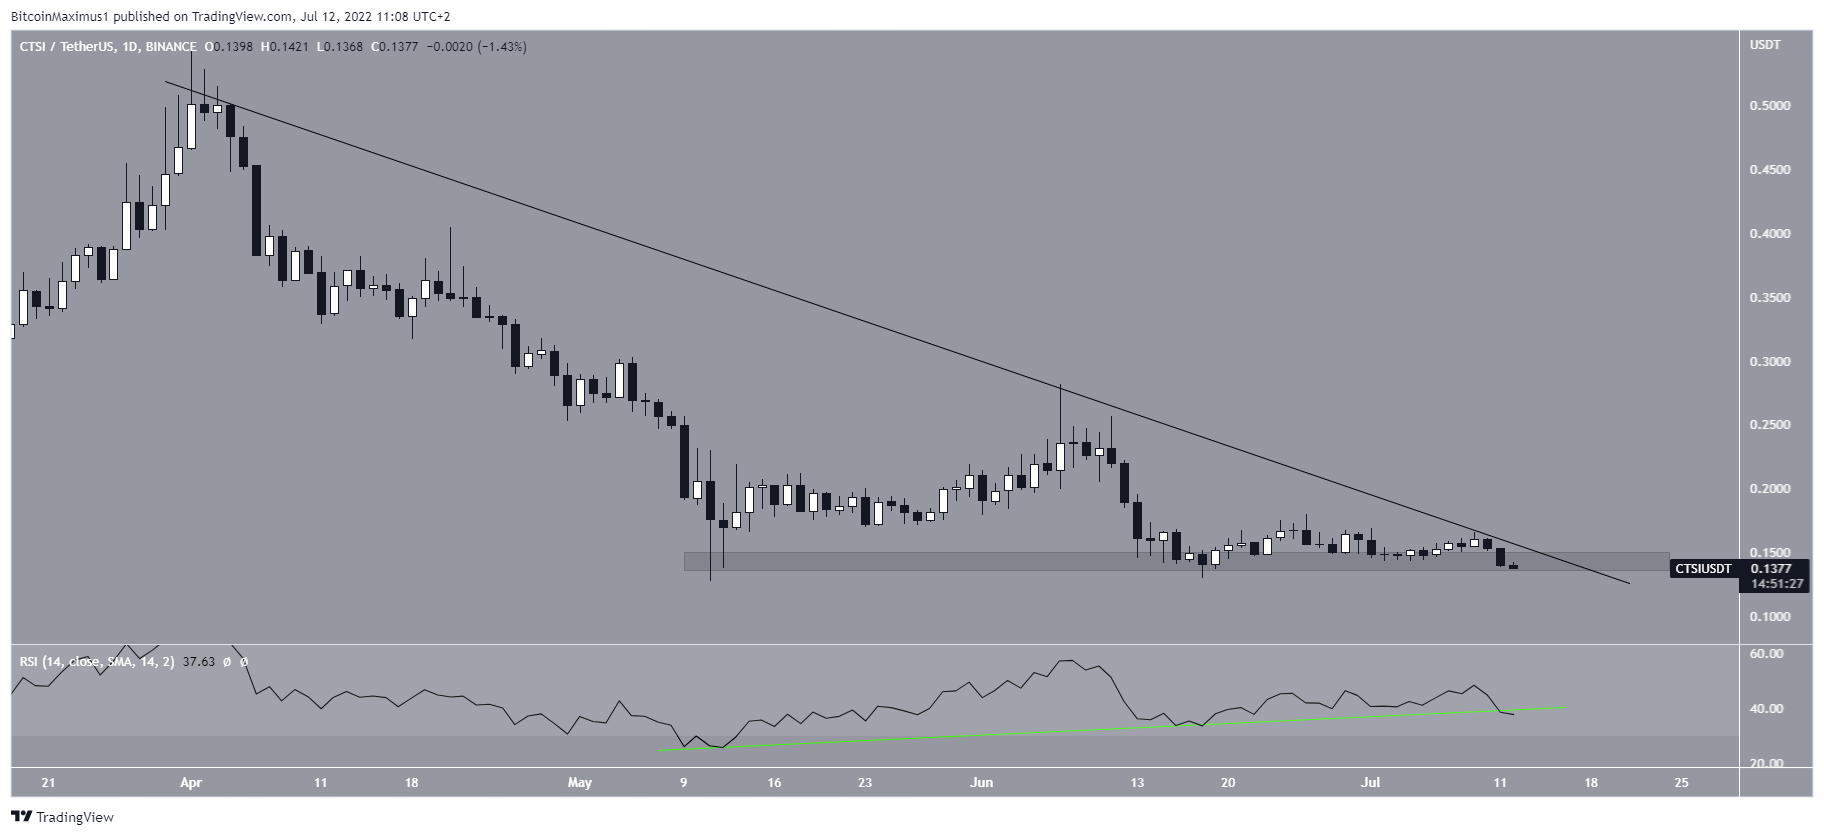
The daily chart shows that the price has been falling underneath a descending resistance line since the beginning of April. More recently, the line caused rejections on June 7 and July 9.
Currently, the price is at risk of breaking down from the $0.14 horizontal support area. Doing so would be expected to greatly accelerate the rate of decrease.
Similar to the weekly time frame, the daily RSI is bearish. The indicator is below 50 and is currently breaking down from its bearish divergence trend line (green line). If this were to be confirmed, it would support the possibility of a price breakdown.
CTSI wave count analysis
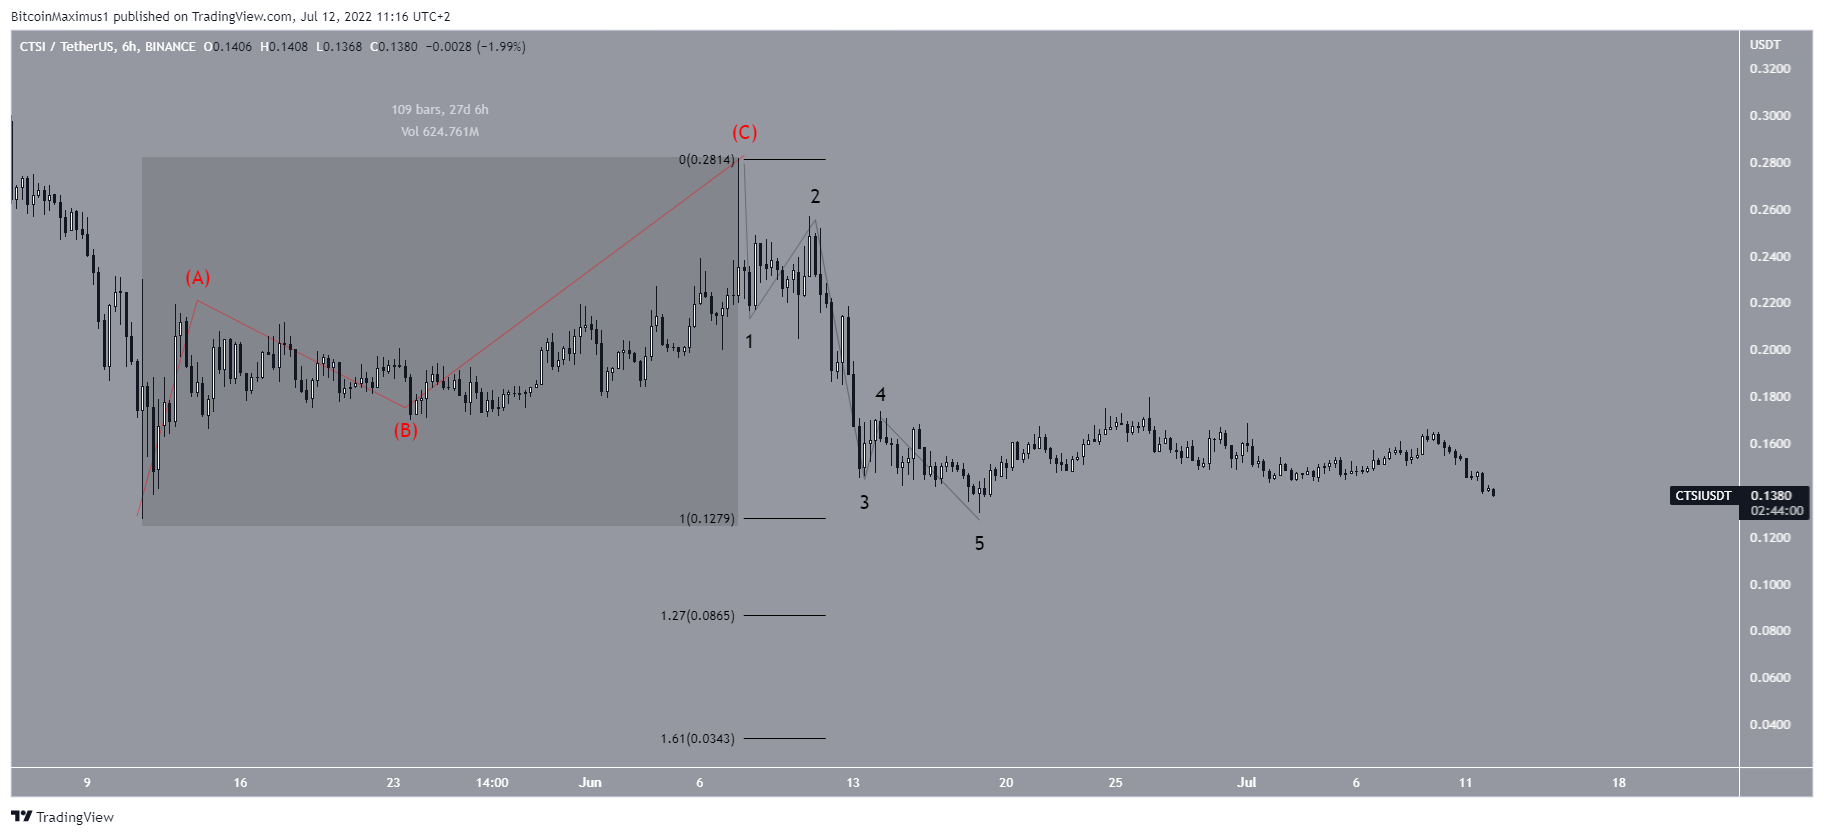
Cryptocurrency trader @CVOTrades tweeted a chart of CTSI, stating that another bounce is expected to transpire prior to a final fall.

The upward movement that began on May 12 looks corrective (highlighted, red), making it likely that it is an A-B-C structure (red). Afterward, the ensuing downward movement looks like a five-wave structure. This suggests that the underlying trend is bearish.
If a breakdown occurs, the first potential bottom would be at $0.0865, while the next one at $0.034. These are created by the 1.27 and 1.61 external Fib retracement levels when measuring the most recent portion of the bounce.
For Be[in]Crypto’s latest bitcoin (BTC) analysis, click here.
Trusted
Disclaimer
In line with the Trust Project guidelines, this price analysis article is for informational purposes only and should not be considered financial or investment advice. BeInCrypto is committed to accurate, unbiased reporting, but market conditions are subject to change without notice. Always conduct your own research and consult with a professional before making any financial decisions. Please note that our Terms and Conditions, Privacy Policy, and Disclaimers have been updated.
