


Cartesi (CTSI) has increased by 40% since July 13 and could further accelerate its rate of increase if it manages to break out from the current short-term resistance.
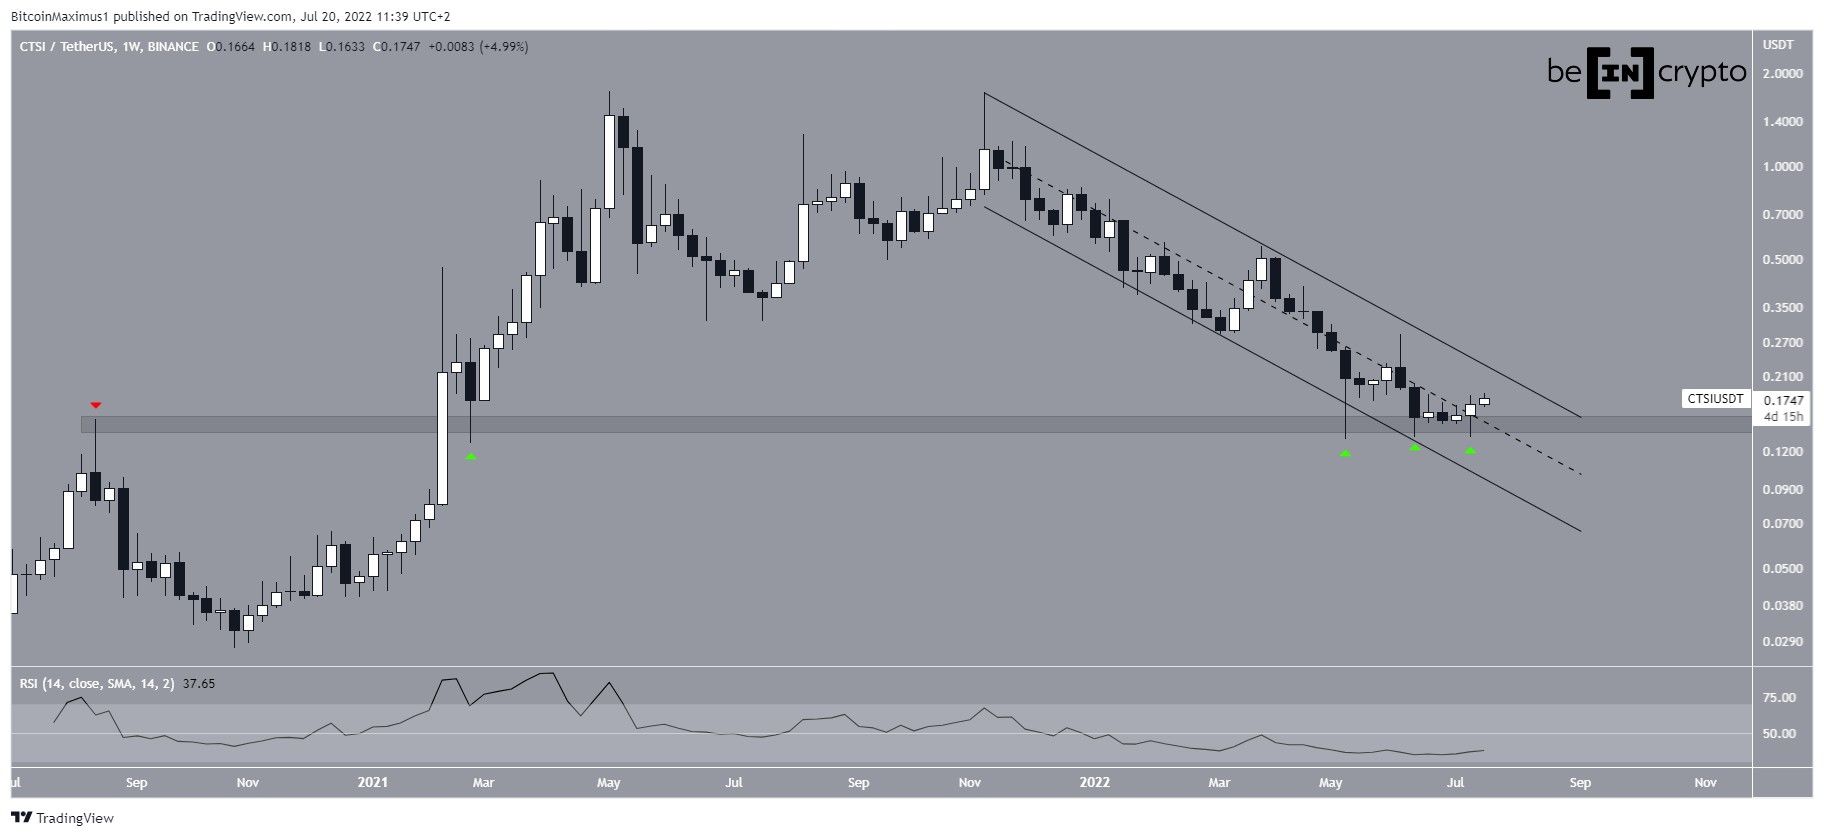
CTSI has been falling inside a descending parallel channel since reaching an all-time high price of $1.73 in Nov. The downward movement has so far led to a low of $0.127 in May. Once there, the price created a triple bottom (green icons) that was combined with long lower wicks. The triple bottom is considered a bullish pattern and wicks are considered signs of buying pressure.
Moreover, the ensuing bounce served to validate the $0.145 horizontal area as support. This is an important level due to it having intermittently acted as both resistance and support since Aug 2020.
Since then, the price has moved upwards and is now trading in the upper portion of the channel.
Currently, the weekly RSI is still below 50, a sign which is associated with bearish trends. So, a RSI movement above 50 and a price breakout from the channel would be required in order for the trend to be considered bullish.
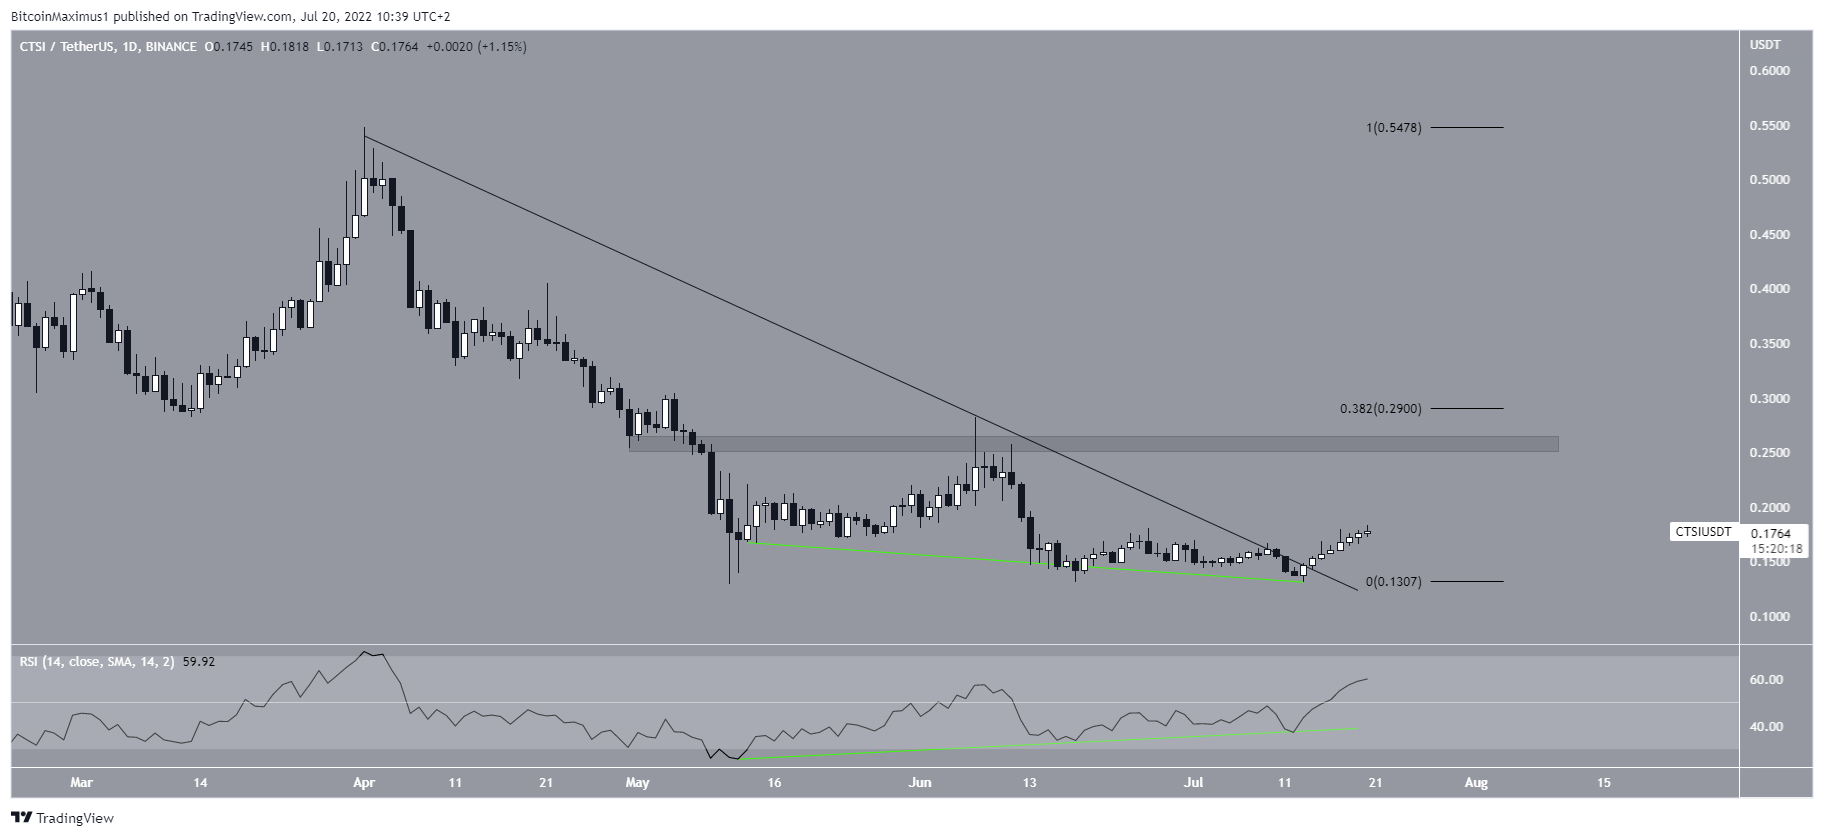
Daily breakout
A closer look at the daily movement shows that CTSI broke out form the resistance line after the daily RSI generated a very significant bullish divergence (green line). Moreover, the RSI has now moved decisively above the 50 line. Both of these are considered signs of a bullish trend.
If the upward movement continues, the closest horizontal resistance area is at $0.25, while the closest Fib resistance is at $0.29.
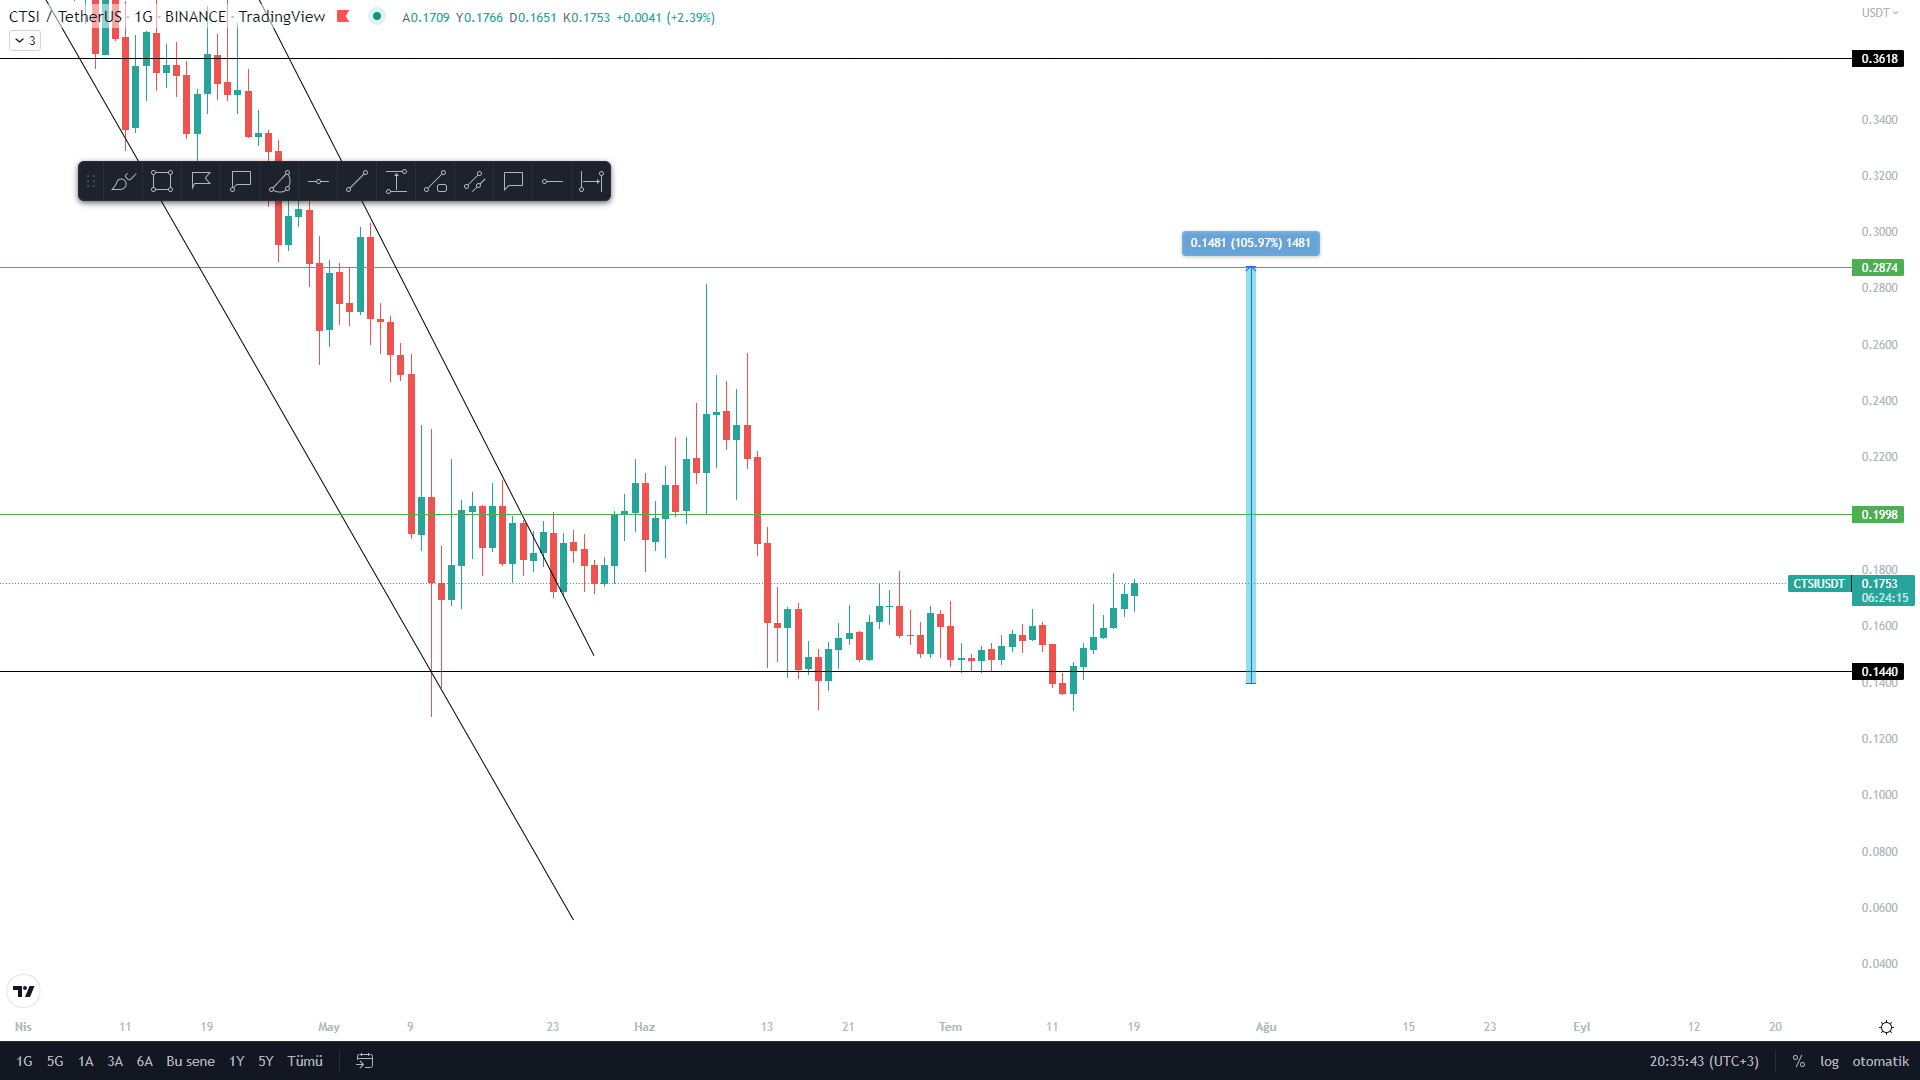
Cryptocurrency trader @Nikolaivicyus tweeted a chart of CTSI, stating that the price could increase all the way to $0.29. This is in alignment with the readings from the daily chart.
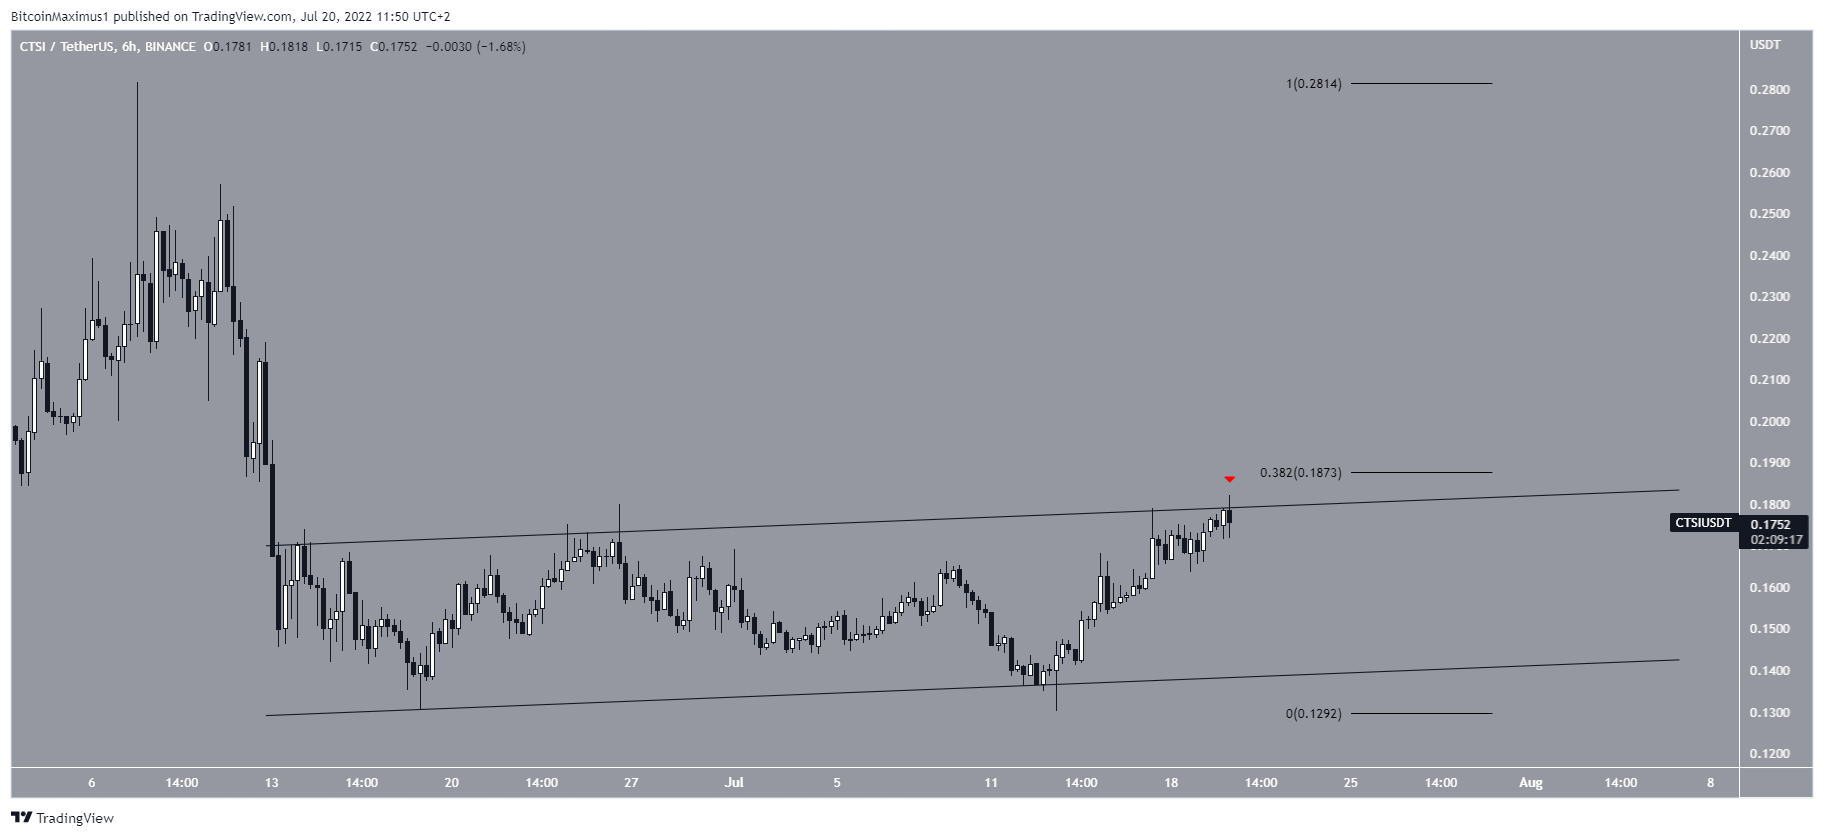
Short-term CTSI movement
While both the weekly and daily charts are bullish, the six-hour one casts some doubt as to whether the price will continue to increase.
The reason for this is that CTSI has been rejected by the resistance line (red icon) of an ascending parallel channel, which coincides with the short-term 0.382 Fib retracement resistance level.
Since channels usually contain corrective movements, a breakout from this one would be required in order for the trend to be considered bullish.
For Be[in]Crypto’s latest Bitcoin (BTC) analysis, click here


