
The Cardano price has gained nearly 10% over the past seven days. But it is still down around 13% year-to-date. While the recent recovery may look strong, the structure suggests something else is building underneath.
A bearish pattern is forming, momentum is weakening, and leverage is rising. Yet whales are still buying, and that creates a key conflict.
Cardano Forms Bearish Pattern Despite Recent Recovery
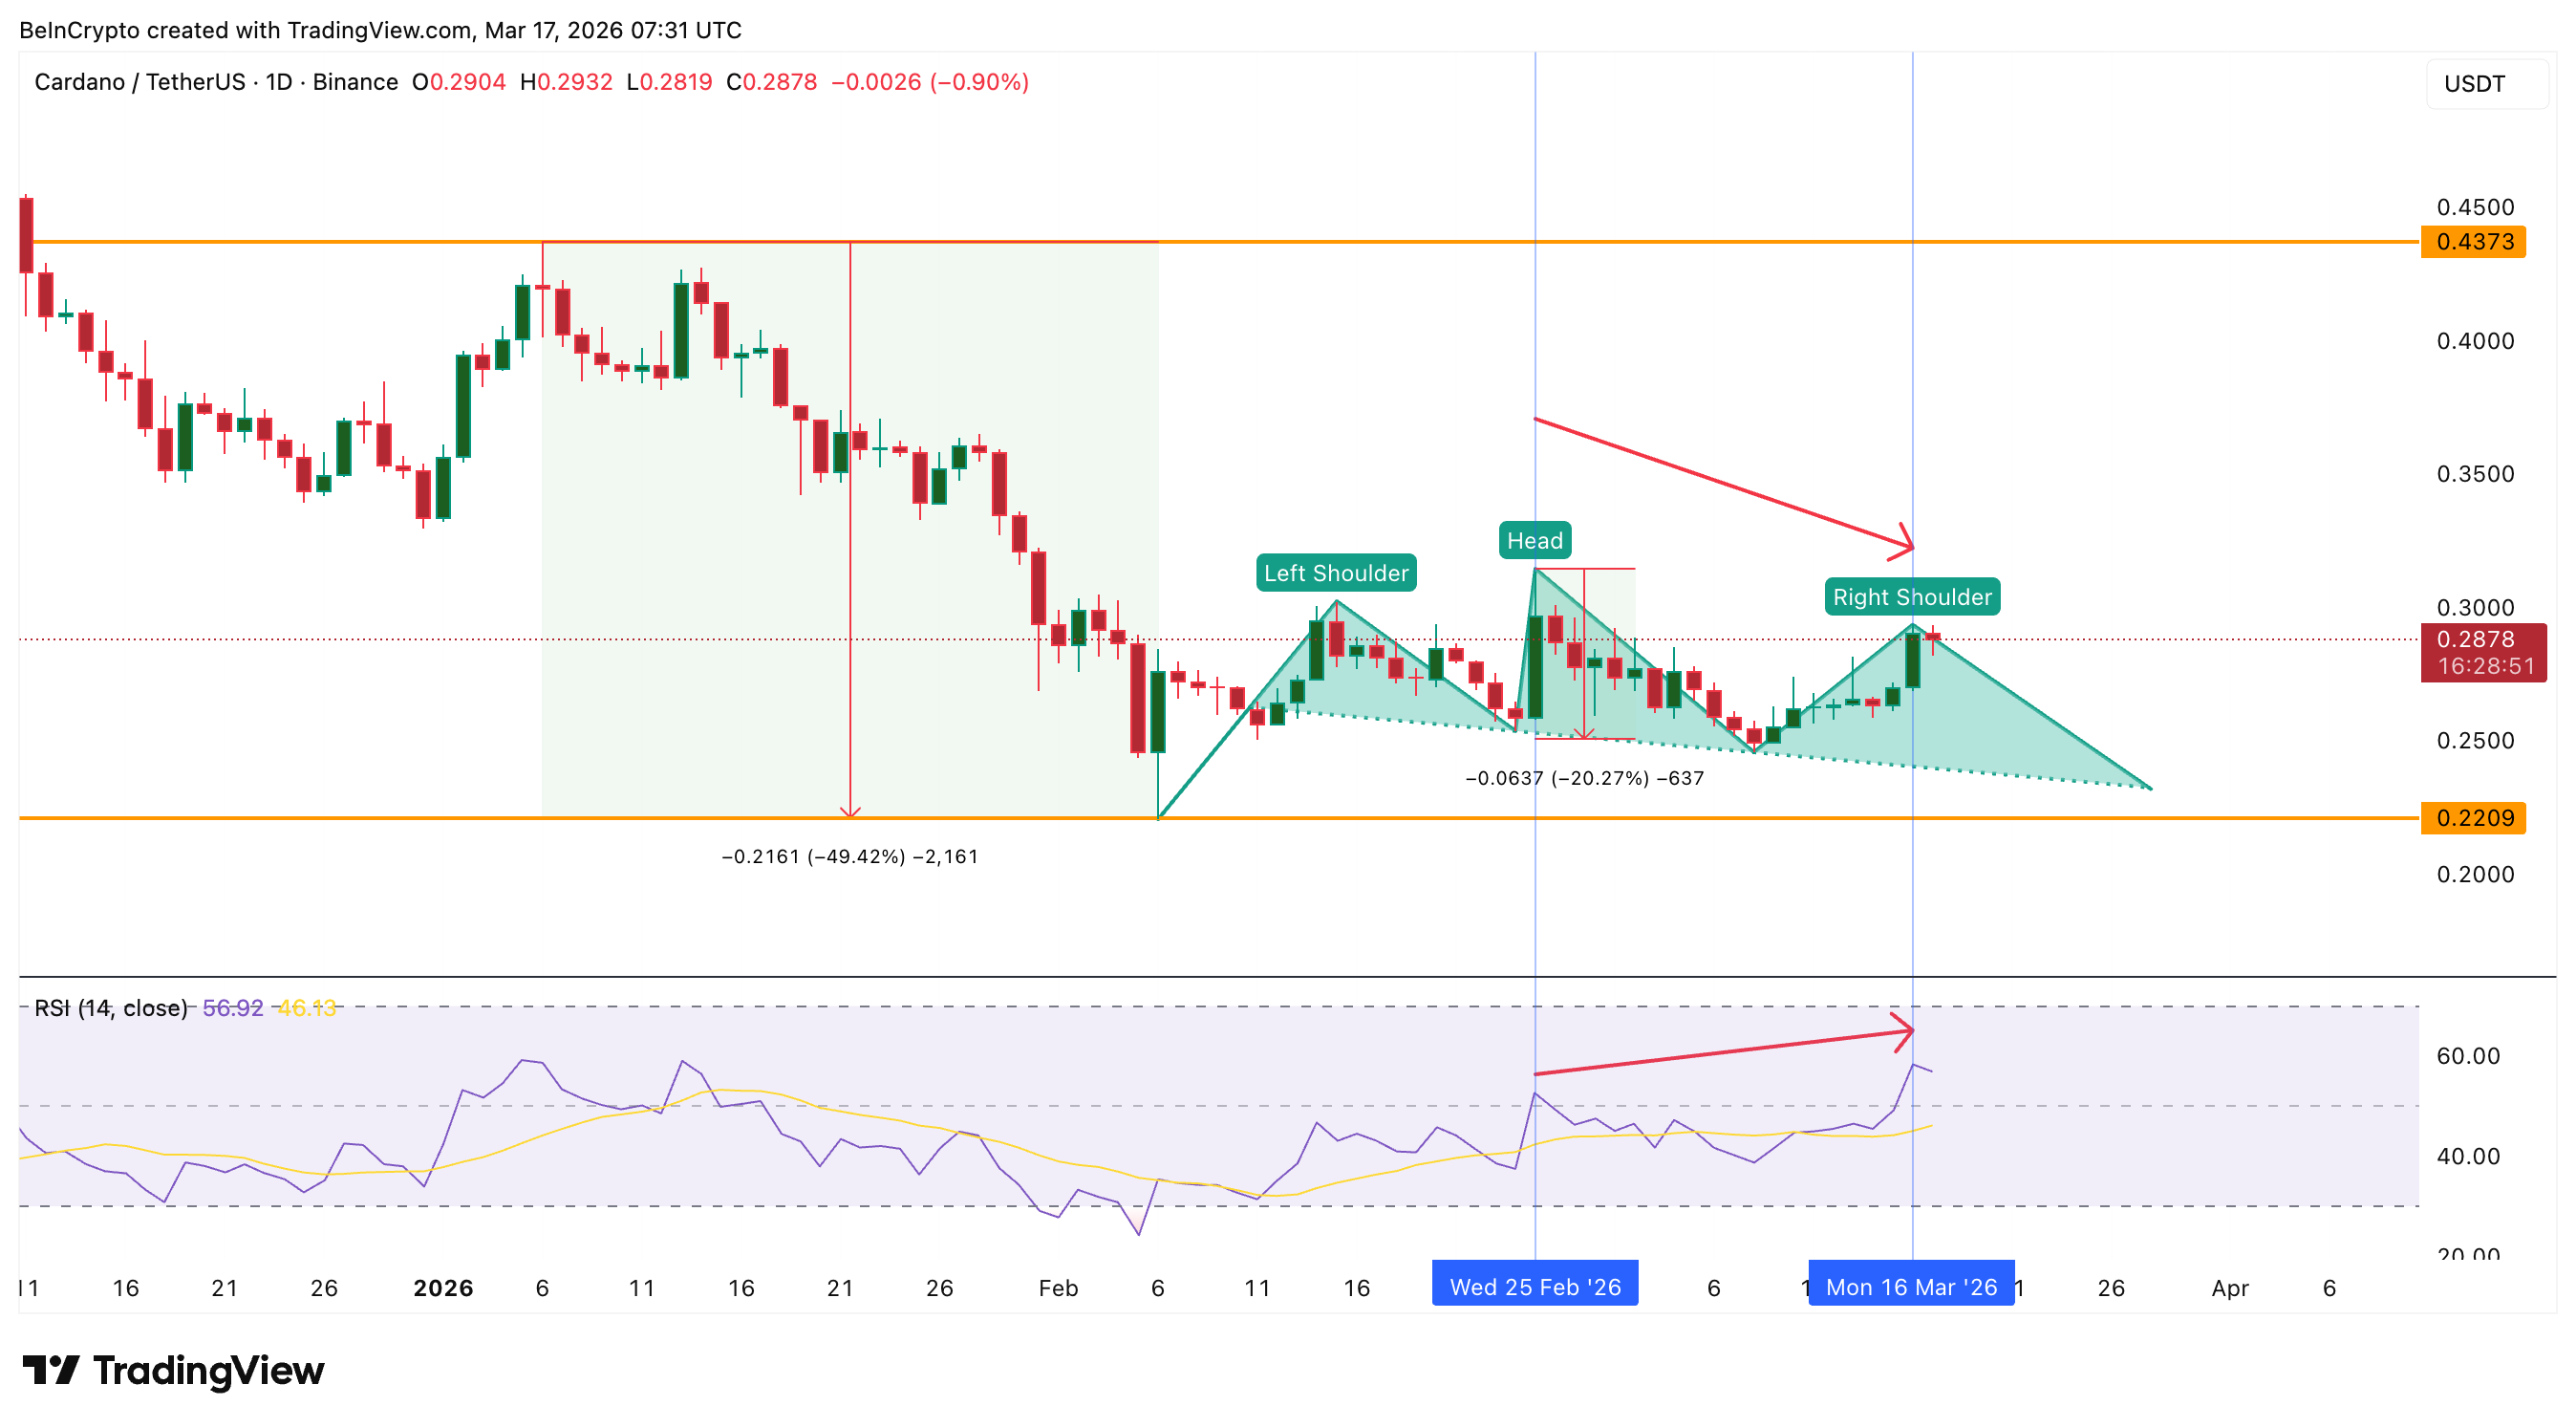
Cardano’s broader trend remains weak despite the recent rebound. After peaking near $0.43 in early January, ADA dropped almost 50% to around $0.22 by early February. Since then, the price has recovered, but that recovery now appears to be forming a head-and-shoulders pattern. This pattern usually signals a continuation of the downtrend once the neckline breaks.
The right shoulder is now forming near current levels, while the neckline is sloping downward. A downward-sloping neckline suggests that sellers are active and controlling the trend.
At the same time, momentum is weakening. Between February 25 and March 16, the Cardano price formed a lower high, while the Relative Strength Index (RSI), a momentum indicator, formed a higher high. This creates a hidden bearish divergence, which usually signals that the broader downtrend may continue.
Want more token insights like this? Sign up for Editor Harsh Notariya’s Daily Crypto Newsletter here.
This means the recent recovery may not reflect strength, but a temporary move within a larger downtrend.
But price structure alone does not tell the full story. To understand whether this weakness is being supported or ignored, it helps to look at what large holders are doing.
Cardano Whales Add $30 Million, But Timing Raises Risk
Large holders have been increasing their positions during this phase. Wallets holding over 1 billion ADA added around 50 million tokens between March 15 and March 16. The 100 million to 1 billion cohort added about 20 million ADA on March 16. Additionally, the 10 million to 100 million group added roughly 40 million ADA on March 15. While the smallest whale group offloaded a bit once the divergence flashed, the net holding remains positive relative to March 15.
In total, whales accumulated close to 110 million ADA over this period.
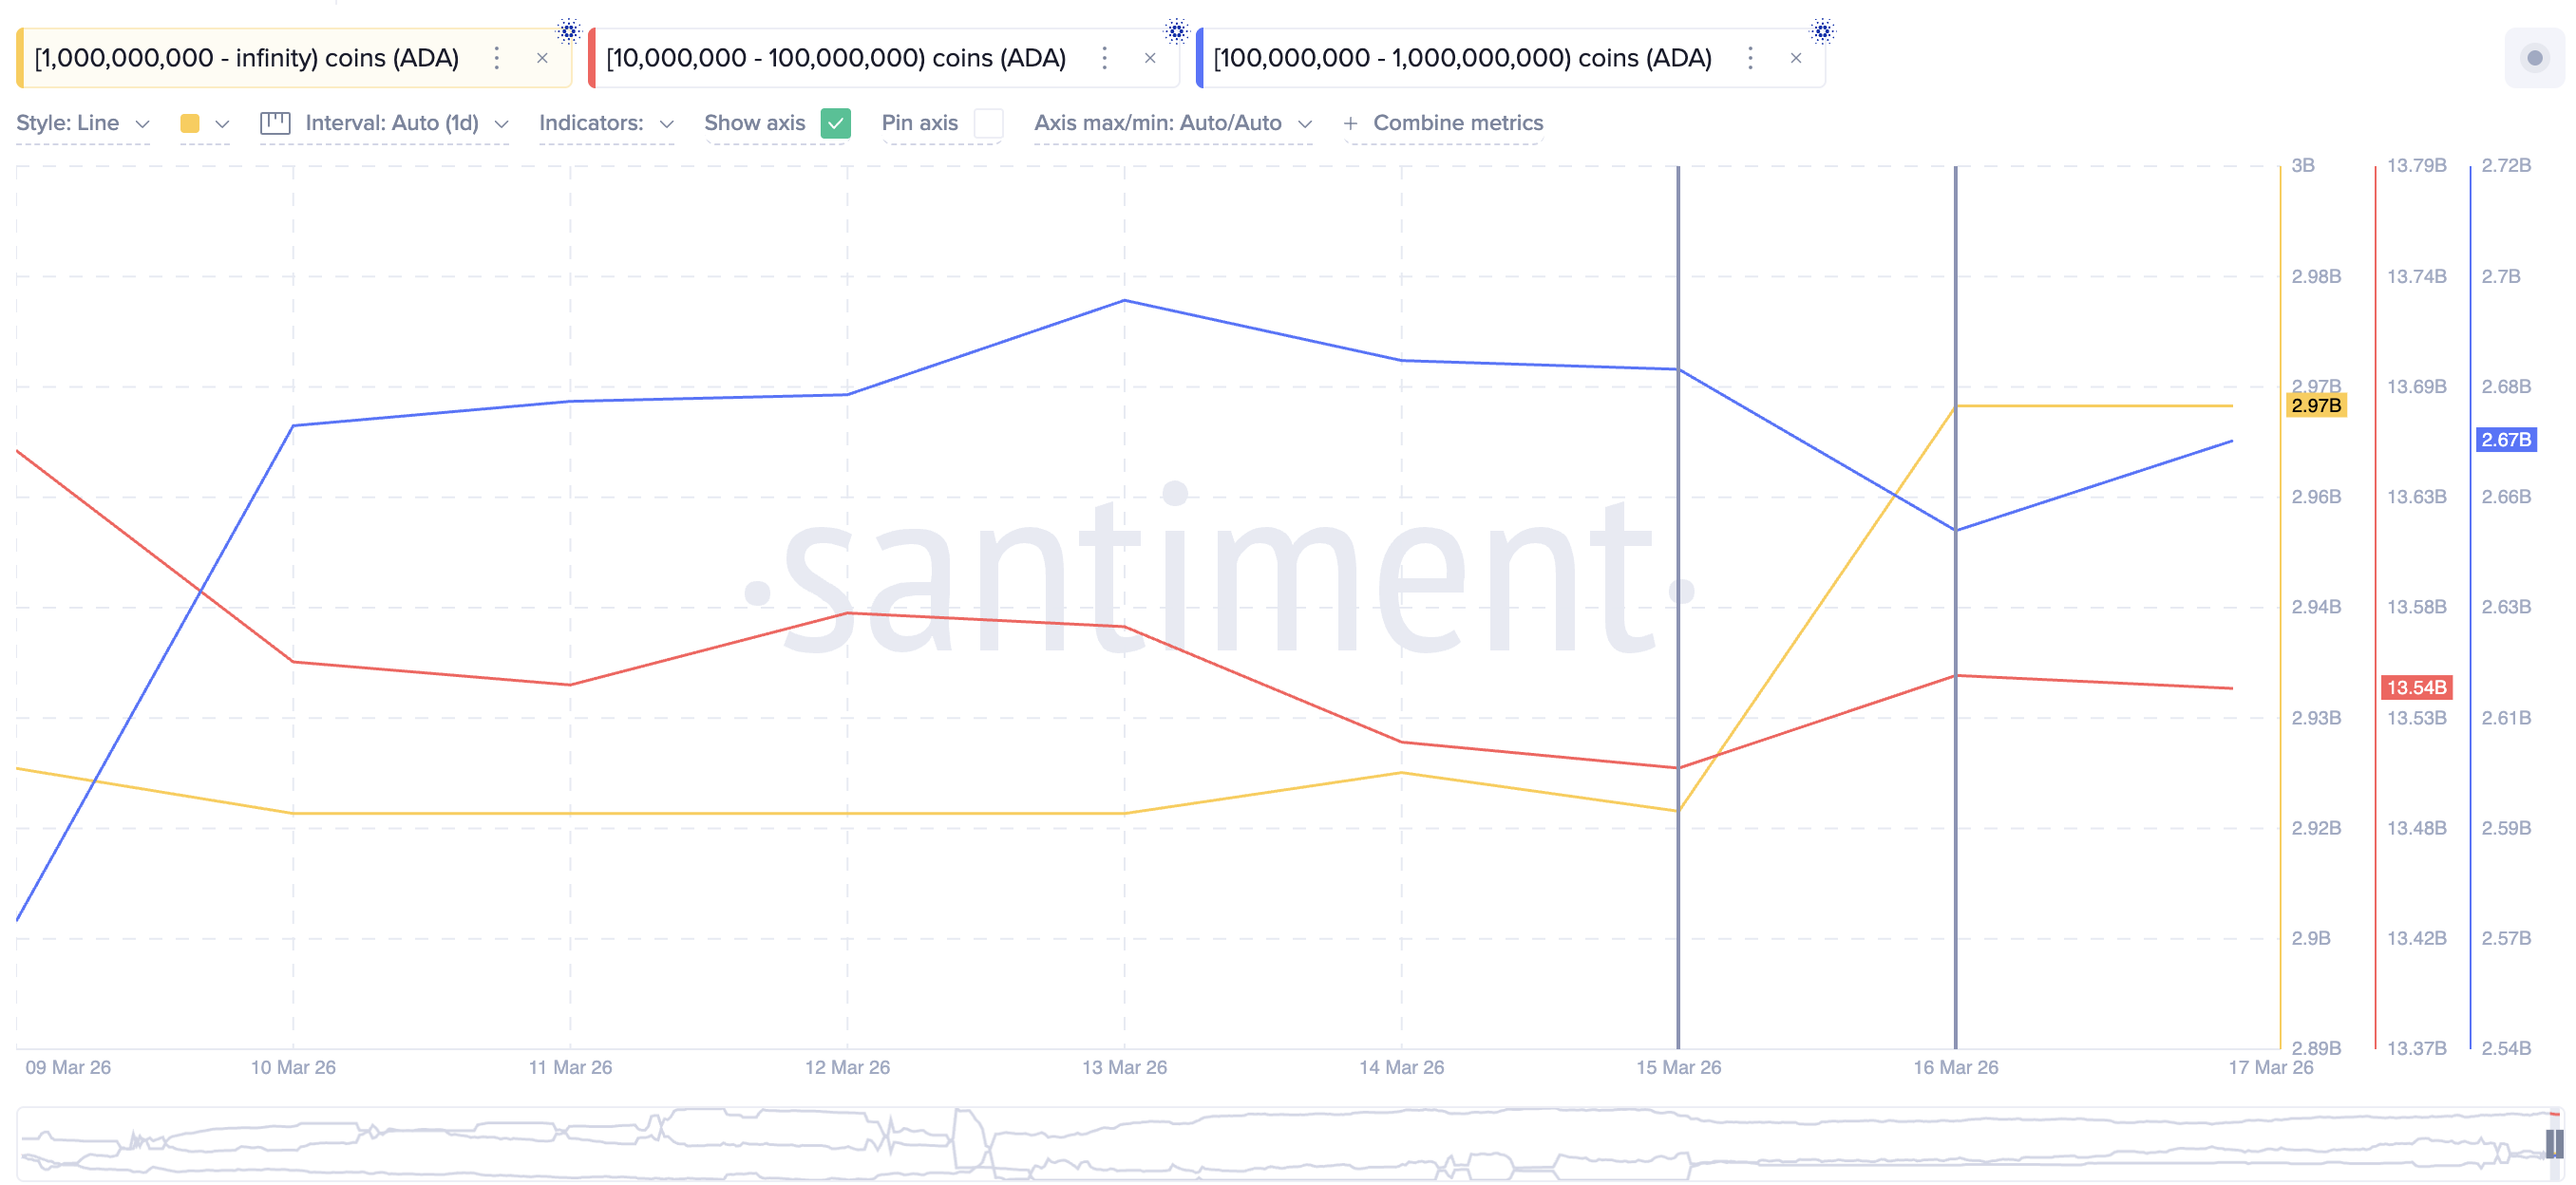
At the current price, this equals roughly $30 million in buying. However, the timing matters. This accumulation happened as the bearish divergence appeared and the right shoulder formed.
Instead of buying at support, whales are adding near resistance (the right shoulder). This suggests that large players may be positioning early, but it also increases the risk if the structure fails. To see whether the broader market agrees with this positioning, it is important to look at derivatives data, where trader sentiment becomes clearer.
Long Leverage Builds as Liquidation Risk Increases
Derivatives data show that traders are heavily leaning bullish.
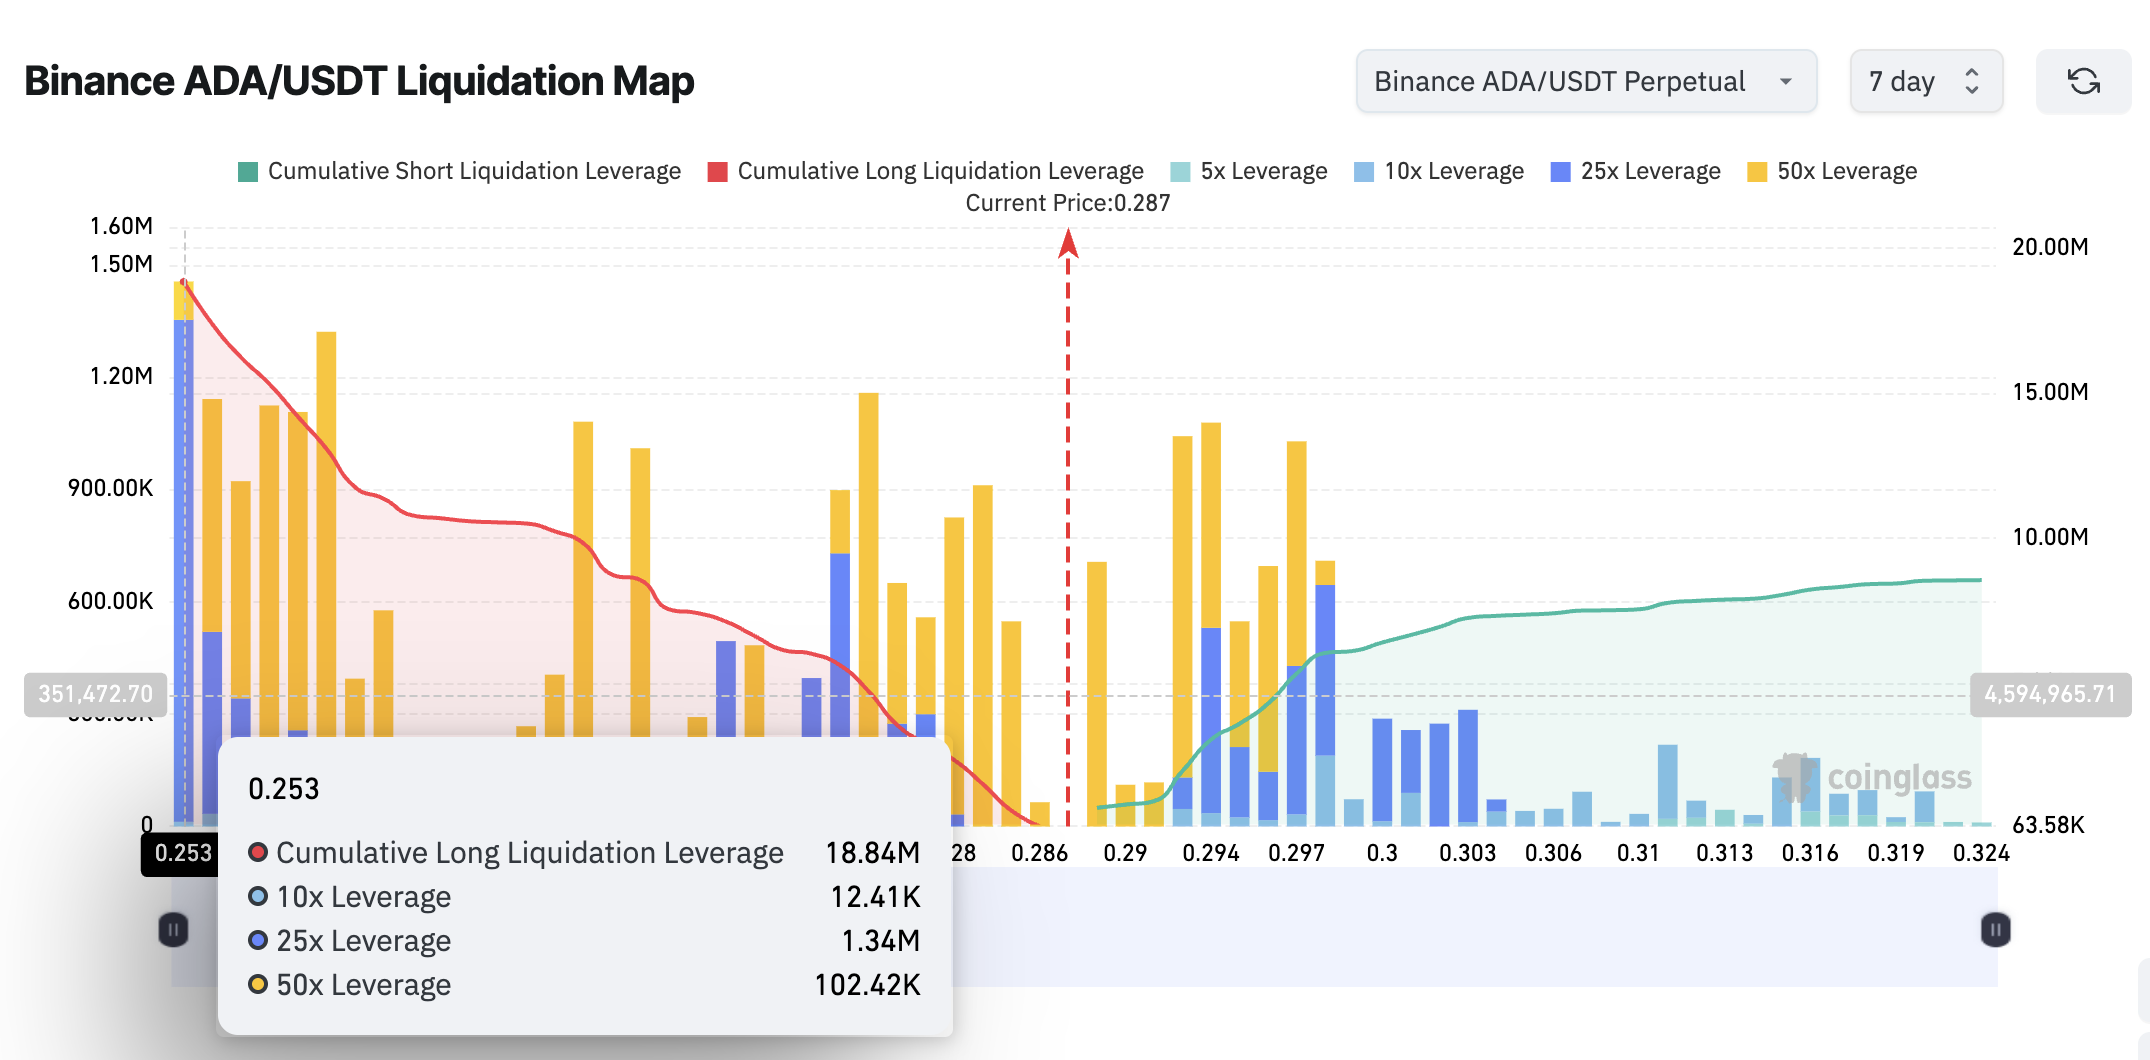
On Binance alone, long ADA/USDT positions stand near $18.84 million, while short positions are around $8.55 million. This shows a clear 2x imbalance toward long positions.
Liquidation data highlights that a large portion of these positions sits around $0.267. Nearly $9.8 million in long positions are exposed in this range. If the price starts to fall toward these levels, it could trigger forced liquidations. This would add selling pressure and accelerate the downside move.
When heavy long positioning combines with resistance and weakening momentum, it often creates conditions where the market moves sharply in the opposite direction.
With both whale activity and leveraged positioning now visible and leaning bullish, the next step is to identify the key levels that could confirm either outcome.
Cardano Price Levels: 20% Drop Risk If Neckline Breaks
The Cardano price is now trading near a critical decision zone.
On the upside, a daily close above $0.293 would break the right shoulder and signal short-term strength. However, the broader bearish structure would remain unless the price moves above $0.314, which sits near the head of the pattern. As long as the price stays below $0.314, the bearish structure and the hidden divergence (lower high structure) both remain intact.
On the downside, the first key level is $0.267, where a large amount of leveraged positions are clustered. A break below this level could trigger liquidations.
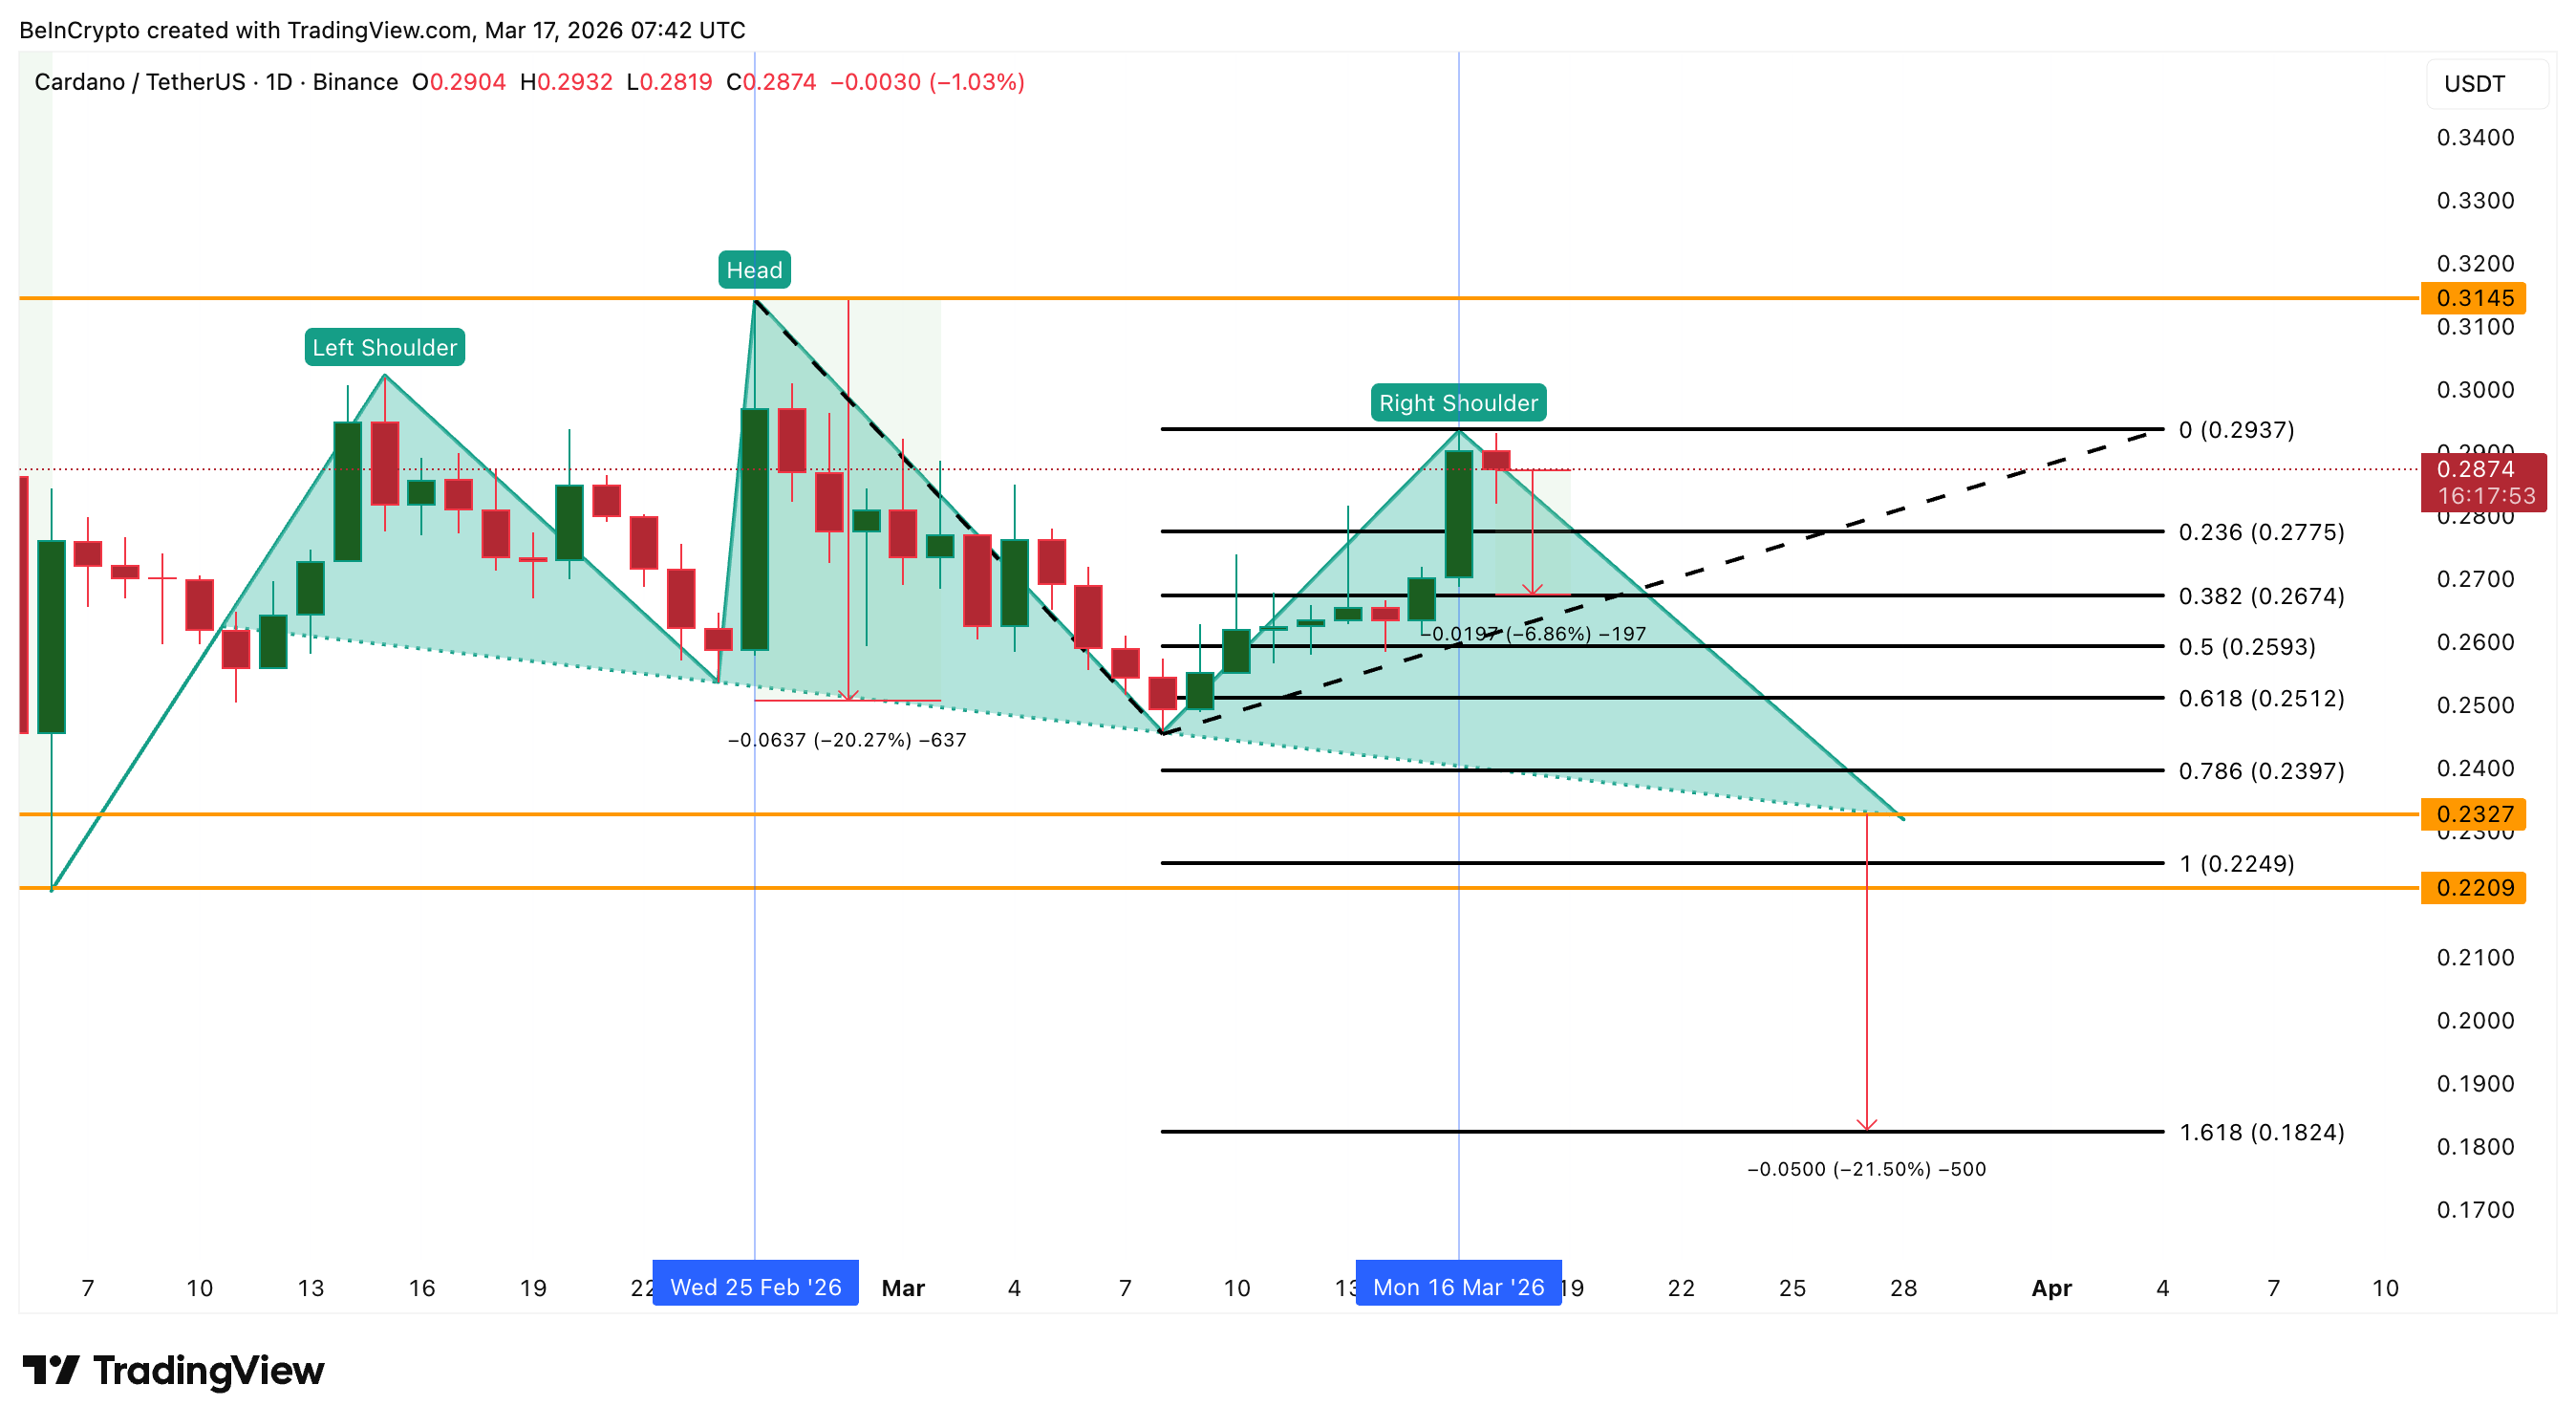
Below that, $0.251 is the next support. Then the $0.239 to $0.232 range becomes critical, as this marks the neckline zone. If the neckline breaks, the pattern confirms. That could push Cardano down by around 20%, with a projected target near $0.182.
For now, the setup is clear. The recovery is visible, but the structure, positioning, and key levels all suggest that risk remains tilted to the downside unless resistance at $0.293 is decisively broken.
